High-resolution spectroscopic observations of the new CEMP-s star CD-50∘776††thanks: Based on the observations made with the 2.2m telescope at the European Southern Observatory (La Silla, Chile) under the agreement between Observatório Nacional (Brazil) and Max-Planck-Institute für Astronomie
Abstract
Carbon enhanced metal poor (CEMP) stars are a particular class of low metalicity halo stars whose chemical analysis may provide important contrains to the chemestry evolution of the Galaxy and to the models of mass transfer and evolution of components in binary systems. Here, we present a detailed analysis of the CEMP star CD-50776, using high resolution optical spectroscopy. We found that CD-50776 has a metalicity [Fe/H] = and a carbon abundance [C/Fe] = . Analyzing the s-process elements and the europium abundances, we show that this star is actually a CEMP-s star, based on the criteria set in the literature to classify these chemically peculiar objects. We also show that CD-50776 is a lead star, since it has a ratio [Pb/Ce] = . In addition, we show that CD-50776 develops radial velocity variations that may be attributed to the orbital motion in a binary system. The abundance pattern of CD-50776 is discussed and compared to other CEMP-s stars already reported in the literature to show that this star is a quite exceptional object among the CEMP stars, particularly due to its low nitrogen abundance. Explaining this pattern may require to improve the nucleosynthesis models, and the evolutionary models of mass transfer and binary interaction.
keywords:
nuclear reactions, nucleosynthesis — stars: abundances — stars: individual: CD-50776 — stars: chemically peculiar — stars: evolution — stars: fundamental parameters1 Introduction
During the last decades, considerable theoretical and observational efforts have been made to investigate the formation and evolution of the chemistry of the Galaxy through the study of its halo stars. The chemical composition of the halo stars is important because it can provide information not only about the early stages of the Galaxy formation, but also about some sites where nucleosynthesis of several elements took place, thus providing significant evidence to describe the initial stages of galactic nucleosynthesis. In order to carry on such studies, an adequate sample of halo stars must be selected. After the first surveys of low metallicity stars initiated by Bond et al. (1970, 1980), Bidelman (1981) and Bidelman & MacConnell (1973), where the metallicity limit was around (Frebel & Norris, 2013, Beers et al. 2014), the surveys by Beers et al. (1985) and Christlieb et al. (2001) significantly increased the known number of low metalicity stars, including several candidates with metallicities less than .
Following these surveys, spectroscopic studies revealed that some of the metal-poor stars from Beers et al. (1985) were also carbon-rich objects (Beers et al. 1992). Before 2005, high-resolution spectroscopic analysis of these stars confirmed the carbon-rich nature for some of them. In addition, it was noted that some of these stars were also enriched in either the r-, s- or r/s-procesess (McWilliam et al. 1995; Sneden et al. 1994, 1996, 2003a, 2003b; Barbuy et al. 1997, Norris et al. 1997a, 1997b, Bonifacio et al. 1998, Hill et al. 2000, 2002, Sivarani et al. 2004). In 2005, Rossi et al. (2005) using medium-resolution spectra of the stars in the samples of Beers et al. (1985) and Christlieb et al. (2001), noted the high frequency occurrence of the carbon-rich stars among the metal-poor stars, also known as CEMP (carbon enhanced metal poor) stars. According to Lucatello et al. (2006), 20% of the stars with metallicities down to are CEMP stars. CEMP stars have been found in all the metallicity range from to , with increasing frequency towards the lower metallicities (Lucatello et al. 2006). In view of this, several astrophysical sites for the origin of the carbon overabundances have been proposed (see Beers & Christlieb 2005 for a discussion).
Beers & Christlieb (2005) (but see also Masseron et al. 2010) proposed that CEMP stars could be distinguished according to their barium and europium abundances, and also according to their [Ba/Eu] ratio. After their study, the CEMP stars were divided in CEMP-s, CEMP-r, CEMP-r/s and CEMP-no stars according to the heavy elements abundance pattern. The majority of CEMP stars are CEMP-s stars (Aoki et al. 2007). The most likely explanation for the observed excess of carbon and s-process elements in CEMP-s stars is the mass-transfer, just like in the CH stars and the barium stars. This conclusion is supported by the radial-velocity variations observed in several CEMP-s stars (Hansen et al. 2016). Therefore, detailed abundance analysis of CEMP-s stars is important to set observational constraints to the physics of mass-transfer (in the case of CEMP-s binaries), and also to the nucleosynthesis models.
In this work we present the spectroscopic analysis of a new CEMP-s star: CD-50∘776. CD-50∘776 came to our attention during our high-resolution spectroscopy survey started in 1999, during the first agreement between Observatório Nacional and the European Southern Observatory, with the aim to search for halo chemically peculiar stars. Later on, we also searched for metal-poor hypervelocity candidate stars, following our analysis of CD-62∘1346, a CH hypervelocity star candidate (Pereira et al. 2012), and the analysis of two metal-poor red-horizontal-branch stars: CD-41∘115048 and HD 214362 (Pereira et al. 2013). To select these peculiar stars, we search over several surveys from the literature. In particular, CD-50∘776 was selected from the work of Bidelman & MacConnel (1973), whose stars sample was later investigated by Norris et al. (1985) and Beers et al. (2014, 2017). In particular, Beers et al. (2014), based on a medium-resolution spectrum, determined the metallicity and the [C/Fe] ratio of this star, obtaining values of and , respectively. Here, we show that CD-50∘776 is in fact a CEMP star with an excess of the elements created by the s-process, without europium enrichment. Therefore it can be classified as a CEMP-s star. CD-50∘776 is the second brightest CEMP-s star known to date, with (the brightest one is HD 196944 with ). The present work is based on the analysis of high-resolution spectra of CD-50∘776 to determine its metallicity and abundance pattern.
2 Observations
The high-resolution spectra analyzed in this work were obtained with the Feros (Fiberfed Extended Range Optical Spectrograph) spectrograph (Kaufer et al. 1999), that was initially coupled to the 1.52 m telescope and later to the 2.2 m telescope of ESO, at La Silla (Chile). Two observations were done for CD-50∘776. One, on October 26, 1999 and another one on September 25, 2016. The exposures were 3600 and 2400 secs, respectively. Feros consists of a CCD detector of pixels having each pixel a size of . Feros has spectral coverage between 3 900Å and 9 200Å distributed over 39 orders with a resolution of 48 000. The spectral reduction was made following a standard procedure, which includes bias subtraction, flat-fielding, spectral order extraction and wavelength calibration. All this procedure has been done using the MIDAS reduction pipeline.
3 Analysis & results
The atomic absorption lines used for the determination of atmospheric parameters are basically the same as which were used in the study of other chemically peculiar stars (Pereira & Drake 2009). Table 1 shows the Fe i and Fe ii lines used to determine these parameters. The values for the Fe i and Fe ii lines were taken from Lambert et al. (1996).
3.1 Determination of the atmospheric parameters
Our analysis was done using the spectral analysis code MOOG (Sneden 1973) and the model atmospheres of Kurucz (1993). The latest version of MOOG includes routines for the calculation of the Rayleigh-scattering contribution to the continuous opacity, as described in Sobeck et al. (2011). The temperature was obtained after searching for a zero slope of the relation between the iron abundances based on Fe i lines and the excitation potential while the microturbulent velocity was obtained after searching for a zero slope of the relation between the iron abundances based on the same Fe i lines and the reduced equivalent width (). This procedure also provides the metallicity of the star. The surface gravity of the star was obtained by means of the ionization equilibrium, which means that we should find a solution until the abundance of Fe i and Fe ii become equal.
The final atmospheric parameters derived for CD-50∘776 are given in Table 2. Table 2 also shows the values derived from previous spectroscopic observations of CD-50∘776 conducted by Ryan & Deliyannis (1998) and Beers et al. (2014). The three atmospheric parameters given in Beers et al. (2014), labelled as 2a, 2b and 2c, differ according to the techniques used by these authors to obtain them. We note that our atmospheric parameters are in a good agreement either in temperature or surface gravity, depending on the specific technique used by Beers et al. (2014). A model with the highest temperature implies a change of dex in the carbon abundance compared to our results. The model with does not allow a good fit in the region of the C2 molecule, at 5165Å.
The errors reported in our effective temperature () and microturbulent velocity () were set from the uncertainty in the slope of the Fe i abundance versus. excitation potential and versus. , respectively. For the gravity, the error was estimated until the mean abundances of Fe i and Fe ii differ by 1 of the standard deviation of the [Fe i/H] mean value.
| Element | (Å) | (eV) | (mÅ) | |
| Fe i | 4187.050 | 2.450 | 0.55 | 88 |
| 4233.610 | 2.480 | 0.60 | 77 | |
| 4494.570 | 2.200 | 1.14 | 74 | |
| 4531.160 | 1.490 | 2.15 | 73 | |
| 4871.330 | 2.860 | 0.36 | 85 | |
| 5110.413 | 0.000 | 3.76 | 82 | |
| 5171.596 | 1.485 | 1.76 | 87 | |
| 5194.942 | 1.557 | 2.09 | 73 | |
| 5198.711 | 2.223 | 2.14 | 34 | |
| 5202.336 | 2.176 | 1.84 | 57 | |
| 5242.491 | 3.634 | 0.97 | 19 | |
| 5250.209 | 0.121 | 4.92 | 19 | |
| 5281.790 | 3.038 | 0.83 | 49 | |
| 5302.307 | 3.283 | 0.74 | 43 | |
| 5307.361 | 1.608 | 2.97 | 27 | |
| 5339.929 | 3.266 | 0.68 | 48 | |
| 5341.024 | 1.608 | 1.95 | 79 | |
| 5364.871 | 4.445 | 0.23 | 30 | |
| 5367.467 | 4.415 | 0.44 | 37 | |
| 5369.962 | 4.371 | 0.54 | 42 | |
| 5389.479 | 4.415 | 0.25 | 11 | |
| 5393.168 | 3.241 | 0.72 | 44 | |
| 5400.502 | 4.371 | 0.10 | 21 | |
| 5410.910 | 4.473 | 0.40 | 29 | |
| 5445.042 | 4.386 | 0.04 | 28 | |
| 5497.516 | 1.011 | 2.84 | 72 | |
| 5569.618 | 3.417 | 0.49 | 52 | |
| 5572.842 | 3.396 | 0.28 | 60 | |
| 5576.089 | 3.430 | 0.85 | 36 | |
| 5638.262 | 4.220 | 0.72 | 12 | |
| 6065.482 | 2.608 | 1.53 | 46 | |
| 6136.615 | 2.453 | 1.40 | 61 | |
| 6137.692 | 2.588 | 1.40 | 54 | |
| 6191.558 | 2.433 | 1.40 | 57 | |
| 6200.313 | 2.605 | 2.44 | 11 | |
| 6230.723 | 2.559 | 1.28 | 63 | |
| 6252.555 | 2.403 | 1.72 | 57 | |
| 6265.130 | 2.180 | 2.55 | 23 | |
| 6322.686 | 2.588 | 2.43 | 14 | |
| 6393.601 | 2.433 | 1.43 | 57 | |
| 6411.649 | 3.653 | 0.66 | 32 | |
| 6421.351 | 2.279 | 2.01 | 42 | |
| 6430.846 | 2.176 | 2.01 | 49 | |
| 6592.914 | 2.723 | 1.47 | 40 | |
| 6593.871 | 2.437 | 2.42 | 19 | |
| Fe ii | 4515.339 | 2.840 | 2.45 | 37 |
| 4583.837 | 2.810 | 1.80 | 71 | |
| 5197.559 | 3.230 | 2.25 | 35 | |
| 5234.619 | 3.221 | 2.24 | 41 | |
| 5284.098 | 2.891 | 3.01 | 18 | |
| 5425.247 | 3.199 | 3.21 | 10 | |
| 5534.834 | 3.245 | 2.77 | 16 | |
| 6247.545 | 3.891 | 2.34 | 11 | |
| 6432.682 | 2.891 | 3.58 | 7 |
| Parameter | Value | Ref. |
| (K) | 4 900 60 | 1 |
| 5 305 | 2a | |
| 5 000 | 2b | |
| 5 176 | 2c | |
| 5 000 | 3 | |
| (dex) | 2.10.2 | 1 |
| 2.22 | 2a | |
| 3.0 | 2b | |
| 2.22 | 2c | |
| [Fe/H] (dex) | 2.31 0.08 | 1 |
| 2.39 | 2a | |
| 2.23 | 2b | |
| 2.52 | 2c | |
| 2.23 | 3 | |
| (km s-1) | 1.5 0.3 | 1 |
References for Table 2.
1: This work;
2: Beers et al. (2014);
3: Ryan & Deliyannis (1998);
3.2 Abundance analysis
The abundance pattern of CD-50∘776 was determined using either equivalent width measurements of selected atomic lines and using the spectral synthesis technique. We used the solar abundances of Grevesse & Sauval (1998) as a reference. For iron it was used the solar abundance of (Fe) = 7.52. Table 3 shows the atomic lines used to derive the abundances of the elements, with their respective equivalent width measurements. The derived abundances are given in Table 4. For the elements whose abundances were derived using spectral synthesis technique they are labelled as syn.
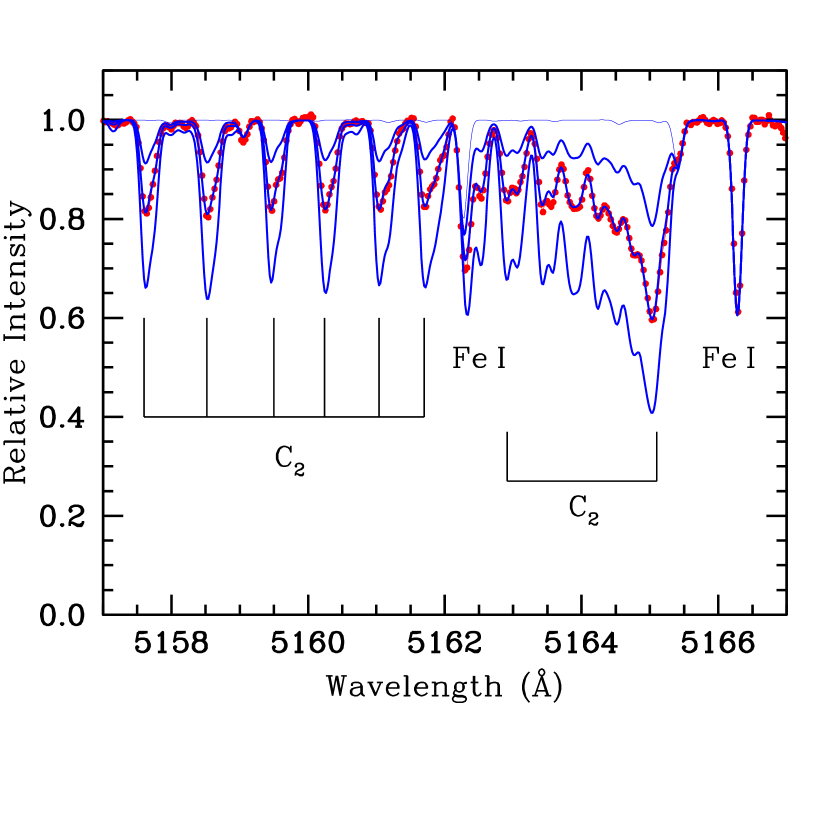
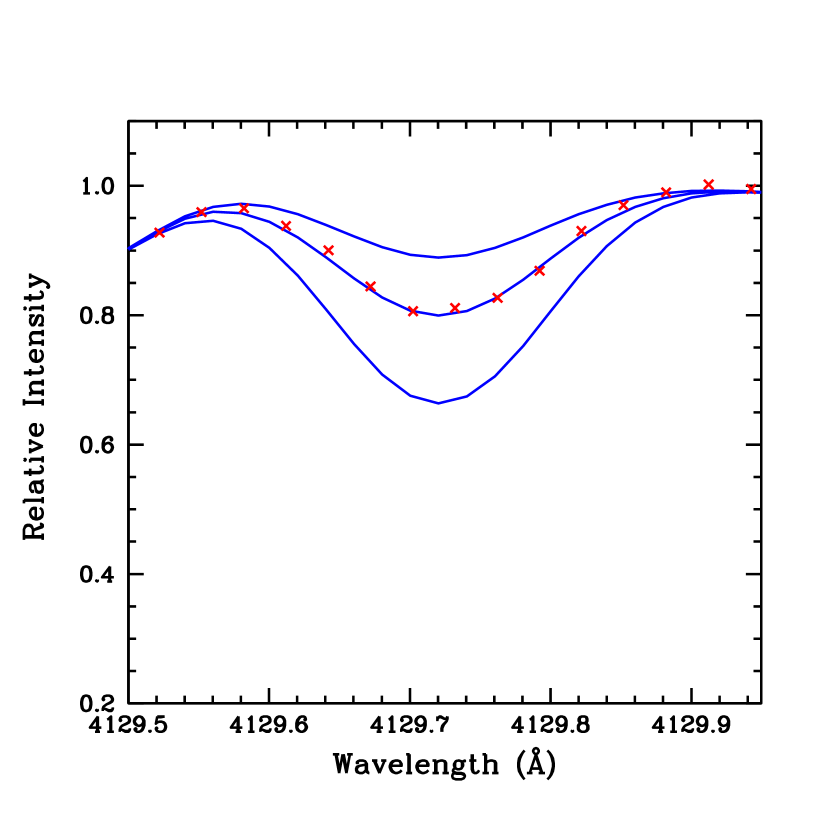
The abundances of the light elements, carbon and nitrogen, were determined by applying a spectrum synthesis technique in the local thermodynamic equilibrium (LTE). For carbon, we used the CH lines of the system at Å, the C2 (0,0) band head of the Swan system at 5165 Å, and the C2 (0,1) band head of the Swan system at 5635 Å.
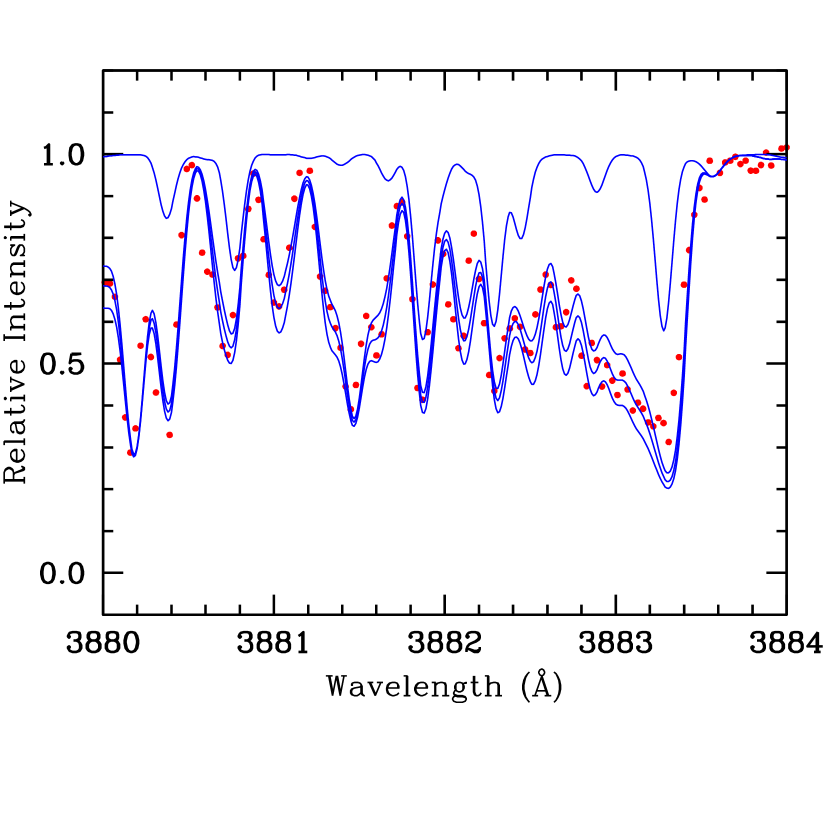
For nitrogen we used the violet system band head at 3883 Å with line list provided by VALD. The (2, 0) band of the CN red system in the 7994–8020 Å often used by us to determine the nitrogen abundance, is not visible in this star. We did not detect the oxygen forbidden line at 6300.0 Å Therefore we assume that [O/Fe] = , which is a typical value for a star of this metallicity (Masseron et al. 2006). We also check our derived nitrogen abundance using a different linelist for the CN band at 3883 Å given by Jonsell et al. (2006) and Sneden et al. (2014), and the results were basically the same as using the linelist given by VALD.
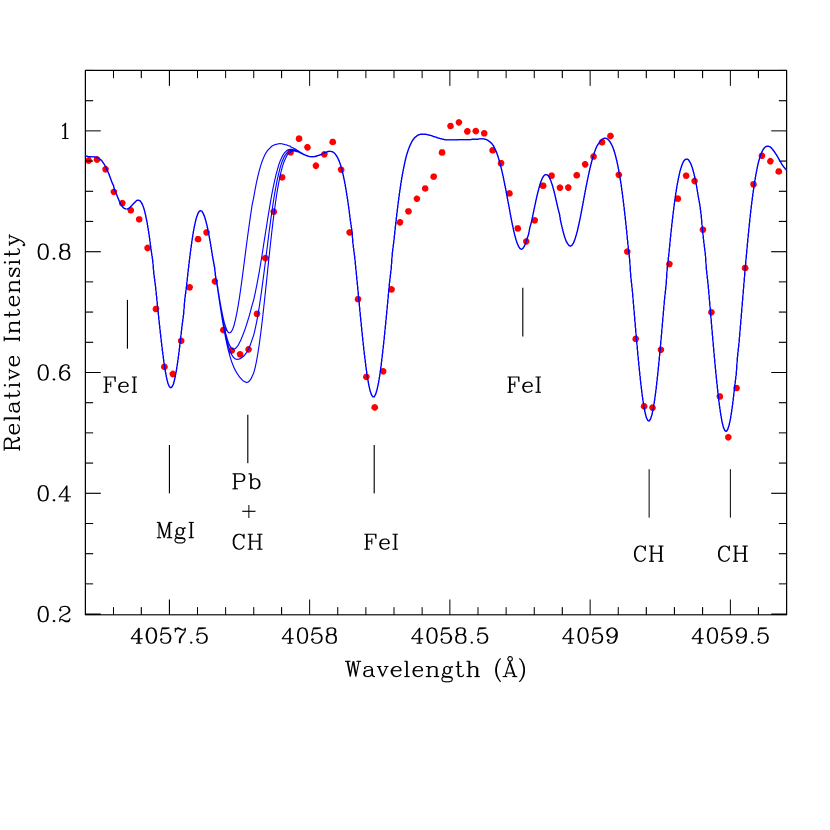
The abundances of barium, europium, cobalt, lead and praseodymium were also determined by means of spectral synthesis technique. The determination of barium abundance was obtained using the Ba ii lines at , , , and Å. Hyperfine and isotope splitting were taken from McWilliam (1998). The europium abundance was found using the line of Eu ii at Å and the hyperfine splitting from Mucciarelli et al. (2008). The cobalt abundance was derived using the Co i line at Å, where the hyperfine splitting was taken from McWilliam et al. (1995). The lead abundance was derived from the Pb i line at Å. The line data, which include isotopic shifts and hyperfine splitting, were taken from van Eck et al. (2003). The abundance of praseodymium was obtained through spectral synthesis technique using the lines at 5259.73Å and 5322.77Å. The hyperfine splitting was taken from Sneden et al. (2009).
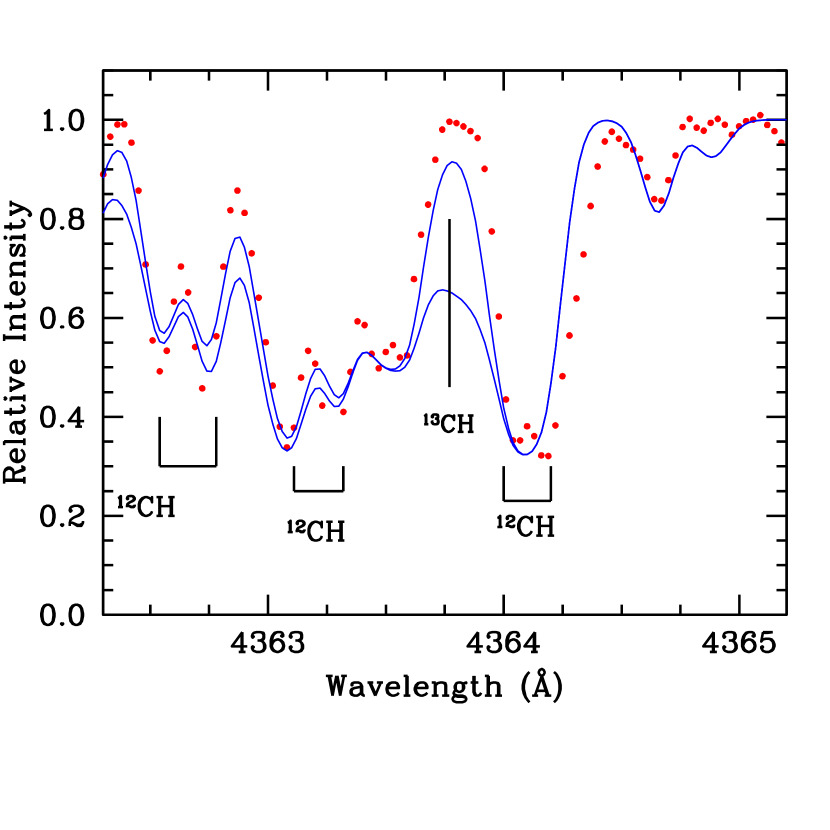
Figures 1, 2, 3, 4 and 5 show the observed and synthetic spectra for the spectral regions where the abundances of carbon, the 12C/13C isotopic ratio, nitrogen, lead and europium were obtained.
| (Å) | Species | (eV) | Ref. | (mÅ) | |
| 5688.22 | Na i | 2.10 | 0.40 | PS | 10 |
| 4057.51 | Mg i | 4.35 | 0.89 | N96 | 56 |
| 4571.10 | 0.00 | 5.61 | N96 | 62 | |
| 4702.99 | 4.35 | 0.38 | N96 | 94 | |
| 5528.42 | 4.34 | 0.36 | R99 | 86 | |
| 5711.10 | 4.34 | 1.75 | R99 | 22 | |
| 5581.80 | Ca i | 2.52 | 0.67 | C2003 | 26 |
| 5601.29 | 2.52 | 0.52 | C2003 | 38 | |
| 5857.46 | 2.93 | 0.11 | C2003 | 40 | |
| 6102.73 | 1.88 | 0.79 | D2002 | 51 | |
| 6122.23 | 1.89 | 0.32 | D2002 | 78 | |
| 6162.18 | 1.90 | 0.09 | D2002 | 90 | |
| 6166.44 | 2.52 | 1.14 | R03 | 10 | |
| 6169.04 | 2.52 | 0.80 | R03 | 21 | |
| 6169.56 | 2.53 | 0.48 | DS91 | 30 | |
| 6439.08 | 2.52 | 0.47 | D2002 | 76 | |
| 6493.79 | 2.52 | 0.11 | DS91 | 49 | |
| 6499.65 | 2.52 | 0.81 | C2003 | 13 | |
| 6717.69 | 2.71 | 0.52 | C2003 | 23 | |
| 4512.74 | Ti i | 0.84 | 0.48 | MFK | 26 |
| 4518.03 | 0.83 | 0.32 | MFK | 30 | |
| 4533.25 | 0.85 | 0.48 | MFK | 60 | |
| 4548.77 | 0.83 | 0.35 | MFK | 23 | |
| 4555.49 | 0.85 | 0.49 | MFK | 16 | |
| 4981.72 | 0.84 | 0.50 | MFK | 61 | |
| 4999.51 | 0.83 | 0.25 | MFK | 58 | |
| 5016.17 | 0.85 | 0.57 | MFK | 16 | |
| 5022.87 | 0.83 | 0.43 | MFK | 22 | |
| 5173.75 | 0.00 | 1.12 | MFK | 30 | |
| 5210.39 | 0.05 | 0.88 | MFK | 43 | |
| 4254.35 | Cr i | 0.00 | 0.09 | S2007 | 112 |
| 4496.84 | 0.94 | 1.14 | S2007 | 25 | |
| 5206.04 | 0.94 | 0.02 | S2007 | 84 | |
| 5247.57 | 0.96 | 1.60 | S2007 | 15 | |
| 5296.70 | 0.98 | 1.37 | S2007 | 25 | |
| 5298.28 | 0.98 | 1.14 | S2007 | 29 | |
| 5345.81 | 1.00 | 0.95 | S2007 | 41 | |
| 5348.33 | 1.00 | 1.22 | S2007 | 28 | |
| 5409.80 | 1.03 | 0.67 | S2007 | 51 | |
| 4904.41 | Ni i | 3.54 | 0.24 | W2014 | 19 |
| 4648.65 | 3.42 | 0.09 | W2014 | 20 | |
| 4756.52 | 3.48 | 0.27 | W2014 | 17 | |
| 5035.36 | 3.64 | 0.29 | W2014 | 25 | |
| 5476.90 | 1.83 | 0.78 | W2014 | 74 | |
| 5892.88 | 1.99 | 1.92 | W2014 | 15 | |
| 6108.11 | 1.68 | 2.69 | W2014 | 10 | |
| 6482.80 | 1.94 | 2.63 | MFK | 11 | |
| 6643.64 | 1.68 | 2.03 | W2014 | 19 | |
| 6767.77 | 1.83 | 2.17 | W2014 | 18 | |
| 7788.93 | 1.95 | 1.99 | W2014 | 13 | |
| 4810.53 | Zn i | 4.06 | 0.17 | BG80 | 26 |
| 4215.52 | Sr ii | 0.00 | 0.17 | N96 | 142 |
| 4883.68 | Y ii | 1.08 | 0.07 | H82 | 44 |
| 5087.43 | 1.08 | 0.17 | H82 | 31 | |
| 5200.41 | 0.99 | 0.57 | H82 | 16 | |
| 5205.72 | 1.03 | 0.34 | S96 | 21 |
| (Å) | Species | (eV) | Ref. | (mÅ) | |
| 4050.32 | Zr ii | 0.71 | 1.06 | L2006 | 19 |
| 4208.98 | 0.71 | 0.51 | L2006 | 51 | |
| 4554.80 | 0.80 | 1.18 | L2006 | 12 | |
| 4086.71 | La ii | 0.00 | 0.16 | L01 | 49 |
| 6390.48 | 0.32 | 1.41 | L01 | 7 | |
| 4486.91 | Ce ii | 0.29 | 0.18 | L09 | 29 |
| 4539.74 | 0.33 | 0.08 | L09 | 27 | |
| 4562.37 | 0.48 | 0.21 | L09 | 37 | |
| 4628.16 | 0.52 | 0.14 | L09 | 33 | |
| 5187.46 | 1.21 | 0.17 | L09 | 6 | |
| 5274.24 | 1.04 | 0.13 | L09 | 12 | |
| 5330.58 | 0.87 | 0.40 | L09 | 7 | |
| 4820.34 | Nd ii | 0.20 | 0.92 | DH | 17 |
| 4825.48 | 0.18 | 0.42 | DH | 24 | |
| 4914.38 | 0.38 | 0.70 | DH | 14 | |
| 5192.61 | 1.14 | 0.27 | DH | 12 | |
| 5212.36 | 0.20 | 0.96 | DH | 12 | |
| 5234.19 | 0.55 | 0.51 | DH | 10 | |
| 5249.58 | 0.98 | 0.20 | DH | 16 | |
| 5255.51 | 0.20 | 0.67 | DH | 16 | |
| 5293.16 | 0.82 | 0.10 | DH | 21 | |
| 5319.81 | 0.55 | 0.14 | DH | 21 | |
| 4318.94 | Sm ii | 0.28 | 0.25 | L06 | 14 |
| 4424.32 | 0.48 | 0.14 | L06 | 23 | |
| 4467.34 | 0.66 | 0.15 | L06 | 10 | |
| 4566.20 | 0.33 | 0.59 | L06 | 7 | |
| 4815.80 | 0.18 | 0.82 | L06 | 6 |
References for Table 3.
BG80: Biemont & Godefroid (1980); C2003: Chen et al. (2003);
D2002: Depagne et al. (2002); DS91: Drake & Smith (1991);
DH: Den Hartog et al. (2003); E93: Edvardsson et al. (1993)
GS: Gratton & Sneden (1988); H82: Hannaford et al. (1982);
L01: Lawler et al. (2001); L2006: Ljung et al. (2006);
L06: Lawler et al. (2006); L09: Lawler et al. (2009);
McW: McWilliam et al. (1995); MFK : Martin et al. (2002);
N96: Norris et al (1996); PS: Preston & Sneden (2001);
R99: Reddy et al. (1999); R03: Reddy et al. (2003);
S2007: Sobeck et al. (2007); S96: Smith et al. (1996);
W2014 : Wood et al. (2014); Z2009 : Zhang et al. (2009);
| Species | n | [X/H] | [X/Fe] | |
|---|---|---|---|---|
| C (C2) | syn(3) | 7.420.10 | 1.10 | 1.21 |
| N (CN) | syn(1) | 5.52 | 2.40 | 0.09 |
| Na i | 1 | 4.09 | 2.04 | 0.07 |
| Mg i | 5 | 5.740.15 | 1.84 | 0.47 |
| Ca i | 13 | 4.540.08 | 1.82 | 0.49 |
| Ti i | 11 | 2.910.09 | 2.11 | 0.20 |
| Cr i | 9 | 3.170.06 | 2.50 | 0.19 |
| Co i | syn(1) | 2.52 | 2.40 | 0.09 |
| Ni i | 11 | 3.990.14 | 2.26 | 0.05 |
| Zn i | 1 | 2.52 | 2.08 | 0.23 |
| Sr ii | 1 | 0.74 | 2.23 | 0.08 |
| Y ii | 4 | 0.040.10 | 2.20 | 0.11 |
| Zr ii | 3 | 0.760.08 | 1.84 | 0.47 |
| Ba ii | syn(3) | 0.830.10 | 1.30 | 1.01 |
| La ii | 2 | 0.28 | 1.45 | 0.86 |
| Ce ii | 7 | 0.190.08 | 1.39 | 0.92 |
| Pr ii | syn(2) | 0.82 | 1.53 | 0.78 |
| Nd ii | 10 | 0.040.11 | 1.46 | 0.85 |
| Sm ii | 5 | 0.610.10 | 1.62 | 0.69 |
| Eu ii | syn(1) | 1.49 | 2.00 | 0.31 |
| Pb i | syn(1) | 1.53 | 0.42 | 1.89 |
12C/13C 64
3.3 Abundance uncertainties
The uncertainties in the abundances of CD-50∘776 are given in Table 5. The uncertainties due to the errors of , , , and metallicity were estimated by changing these parameters one at a time by their standard errors given in Table 2. The final uncertainties of the abundances were calculated as the root squared sum of the individual uncertainties due to the errors in each atmospheric parameter and also in the equivalent widths under the assumption that these individual uncertainties are independent.
For the elements analyzed via spectrum synthesis we used the same technique, varying the atmospheric parameters and then computing independently the abundance changes introduced by them. Uncertainties in the carbon abundances also result in variations of the nitrogen abundances, since the CN molecular lines were used for the nitrogen abundance determination. For carbon and nitrogen, typical uncertainties are 0.10 and 0.20, respectively. In Table 5, we see that the neutral elements are more sensitive to the temperature variations, while singly-ionized elements are more sensitive to the variations. For the elements whose abundance is based on stronger lines, such as strontium, the error introduced by the microturbulence is important. Finally, we observe that the abundances of carbon and nitrogen are weakly sensitive to the variations of the microturbulent velocity.
| Species | [Fe/H] | ||||||
|---|---|---|---|---|---|---|---|
| K | 0.3 km s-1 | 0.1 | 3 mÅ | ||||
| C | 0.12 | 0.03 | 0.00 | 0.00 | — | 0.12 | — |
| N | 0.16 | 0.10 | 0.00 | 0.00 | — | 0.19 | — |
| Fe i | 0.08 | 0.00 | 0.07 | 0.01 | 0.08 | 0.11 | 0.08 |
| Fe ii | 0.00 | 0.08 | 0.03 | 0.00 | 0.10 | 0.13 | 0.10 |
| Na i | 0.03 | 0.00 | 0.01 | 0.00 | 0.13 | 0.13 | — |
| Mg i | 0.06 | 0.01 | 0.06 | 0.01 | 0.06 | 0.10 | 0.15 |
| Ca i | 0.05 | 0.01 | 0.05 | 0.01 | 0.07 | 0.10 | 0.08 |
| Ti i | 0.08 | 0.02 | 0.04 | 0.01 | 0.08 | 0.12 | 0.09 |
| Cr i | 0.09 | 0.01 | 0.07 | 0.01 | 0.07 | 0.13 | 0.05 |
| Co i | 0.10 | 0.05 | 0.10 | 0.00 | — | 0.15 | — |
| Ni i | 0.07 | 0.00 | 0.01 | 0.00 | 0.10 | 0.12 | 0.21 |
| Zn i | 0.06 | 0.04 | 0.03 | 0.00 | 0.08 | 0.11 | — |
| Sr ii | 0.06 | 0.01 | 0.23 | 0.00 | 0.04 | 0.25 | — |
| Y ii | 0.02 | 0.06 | 0.04 | 0.01 | 0.07 | 0.10 | 0.10 |
| Zr ii | 0.03 | 0.07 | 0.05 | 0.01 | 0.08 | 0.12 | 0.20 |
| Ba ii | 0.01 | 0.09 | 0.01 | 0.01 | — | 0.09 | — |
| La ii | 0.03 | 0.06 | 0.06 | 0.01 | 0.12 | 0.15 | — |
| Ce ii | 0.03 | 0.06 | 0.03 | 0.01 | 0.10 | 0.12 | 0.08 |
| Pr ii | 0.10 | 0.10 | 0.05 | 0.01 | — | 0.15 | — |
| Nd ii | 0.04 | 0.06 | 0.02 | 0.01 | 0.09 | 0.12 | 0.11 |
| Sm ii | 0.03 | 0.07 | 0.01 | 0.01 | 0.14 | 0.16 | 0.10 |
| Eu ii | 0.01 | 0.09 | 0.20 | 0.01 | — | 0.22 | — |
| Pb i | 0.10 | 0.03 | 0.05 | 0.00 | — | 0.12 | — |
4 Discussion
4.1 The luminosity of CD-50∘776
Once we estimated the temperature and gravity of CD-50∘776, we are able to determine the luminosity considering the relation
| (1) |
where we considered eff⊙ = 5 777 K and ⊙ = 4.44.
Inserting the values of K, , and assuming a mass for CEMP stars (Aoki et al. 2007), we obtain for the luminosity of CD-50∘776 a value of log = . Spectroscopic luminosities of low-metallicity giants derived from ionization balance may give higher values than those derived from stellar parallaxes or evolutionary models (Mashonkina et al. 2011; Ruchti et al. 2013). According to the recent work of Ruchti et al. (2013), the non-local thermodynamic equilibrium (NLTE) correction to the spectroscopic gravity is about dex, and for the temperature the correction is around K. Introducing these corrections in equation (1), we obtain a luminosity of log . In Figure 6 we show the derived temperature and gravity of CD-50∘776 in the log - plane, together with the 12 and 14 Gyr Yale-Yonsei isochrones for a metallicity of [Fe/H] = 2.2 (Kim et al. 2002).
As mentioned in Section 3.1, Beers et al. (2014) also determined the temperature, surface gravity and metallicity of CD-50∘776 using three different techniques. However, their results using high-resolution spectroscopy provided a surface gravity higher than the value obtained by us.

4.2 CD-50∘776 as a new CEMP star
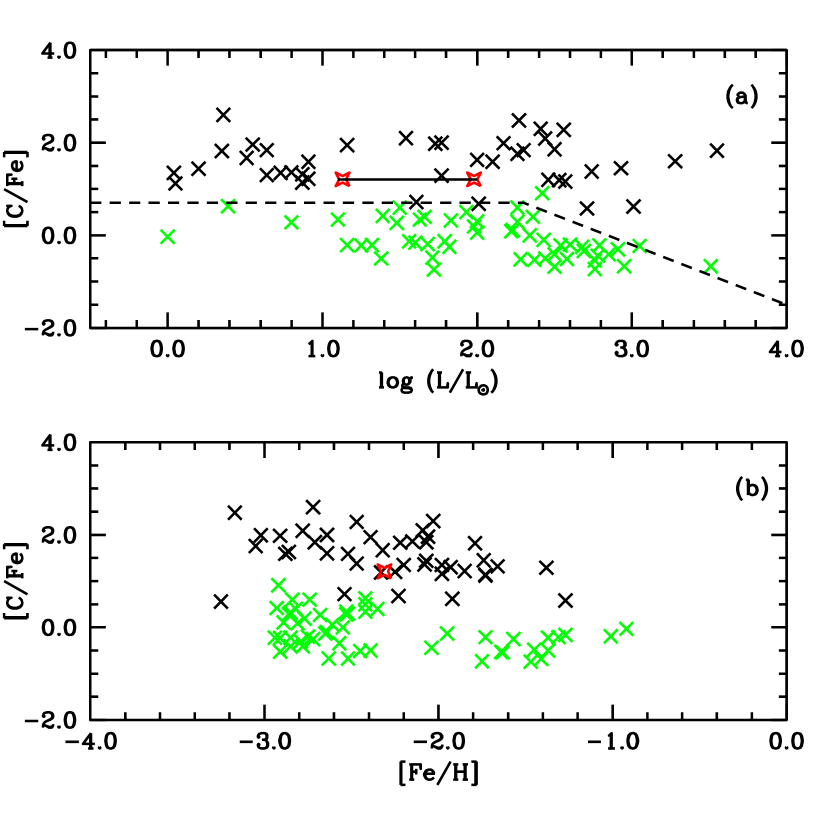
In Figure 7 we reproduce Figure 4 of Aoki et al. (2007), where the authors presented a new constraint for a star to be classified as a CEMP star. In Figure 7a, the position of CD-50776 is clearly above the lower limit for a star to be considered as a CEMP star. Figure 7b plots the [C/Fe] ratio versus. metallicity for the CEMP stars and again CD-50776 occupies in this diagram the same position as other CEMP stars. Therefore, based on these two diagrams, we can classify CD-50776 as a new CEMP star. In addition, the position of CD-50776 in figures 2 and 6 of Yoon et al. (2016) also supports our conclusion that CD-50776 is a CEMP star. We will show in Section 4.4.3 that, based on the abundance analysis, CD-50776 is actually a new CEMP-s star.
4.3 Radial Velocity
Table 6 shows the all known measurements of the radial velocity of CD-50776 available in the literature and determined in this work. It is clear that the radial velocity of CD-50776 presents variations due to orbital motion. Systematic radial velocity monitoring is necessary to confirm the possible binary nature of this new CEMP-s star.
| Reference | Radial Velocity | Modified Julian Date |
|---|---|---|
| This work (September 25, 2016) | 30.50.7 | 57478.17 |
| This work (October 26, 1999) | 25.20.8 | 57657.08 |
| Schuster et al. (2006) | 26.07.0 | |
| Beers et al. (2000) | 1810 |
4.4 Abundances
4.4.1 Nitrogen and isotopic ratio
As shown in Table 4, the nitrogen abundance is low and the 12C/13C isotopic ratio is high. Combining these results with the high carbon abundance led us to conclude that the CN cycle was not efficient enough in the donor star of the binary system of CD-50776, and that significant carbon produced by the triple alpha process was transferred in the AGB stage. The sum (CN) = 7.42 illustrates the fact that carbon is the actual responsible for the total sum of (CN).
If we assume that the nitrogen observed in the CEMP-s stars has the same origin as carbon, that is, it originates in the companion star during the AGB phase (Masseron et al. 2010), then the low nitrogen abundance observed in CD-50776 may constrain, in principle, the mass of the donor star. In particular, for CD-50776, it is likely that the mass of the AGB star should not have been greater than 3.0 M⊙. Models of AGB stars for a metallicity of Z = 0.0001 (Herwig 2004), which is the metallicity of CD-50776, show that the yields of carbon and nitrogen provide a ratio [C/N] of about 2.3 for a star of 2.0 M⊙ at the end of the AGB phase. Threfore, nitrogen is not enhanced in such models. These models also predict a high 12C/13C isotopic ratio (figures 7 and 8 of Herwig 2004). For a star of 3.0 M⊙, the ratio of [C/N] is 2.1 according to the yields given in Herwig (2004), allowing to conclude that low metallicity stars with masses between 2.0 and 3.0 M⊙ should not be nitrogen enriched (Johnson et al. 2007). This would explain the low abundance of nitrogen observed in CD-50776, and implies that this star follows the evolution expected according to the models of Herwig (2004). However, for other CEMP-s stars, the high nitrogen abundance poses challenges to the evolutionary models. Masseron et al. (2010) considered that extra mixing mechanisms should be taken into account in order to explain the high abundance of nitrogen in CEMP-s stars. This is because a high nitrogen abundance is predicted by hot bottom burning, which occurs in stars with masses greater than 4.0 M⊙ (Sackmann & Boothroyd 1992). Notwithstanding, since CEMP-s stars are members of the halo population, it is unlikely that their companions had masses larger than 4.0 M⊙. This led Masseron et al. (2010) to conclude that the nitrogen abundance in CEMP-s stars should not be used to constrain the mass of the donor star.
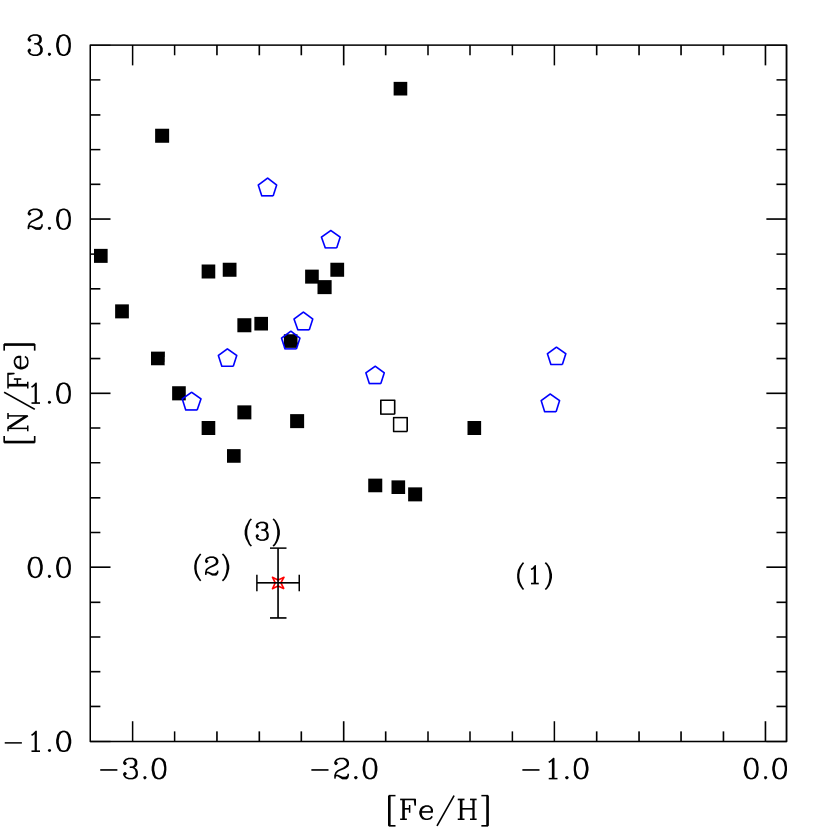
Figure 8 shows the [N/Fe] ratio versus. metallicity for CD-50776 (red star) compared to CEMP-s giants and dwarfs (squares), CH stars (polygons), one metal-poor barium star (HD 123396, (1)), one CEMP-no star (CS 22877-001, (2)) and one carbon star (HD187216, (3)).
4.4.2 Sodium to Nickel
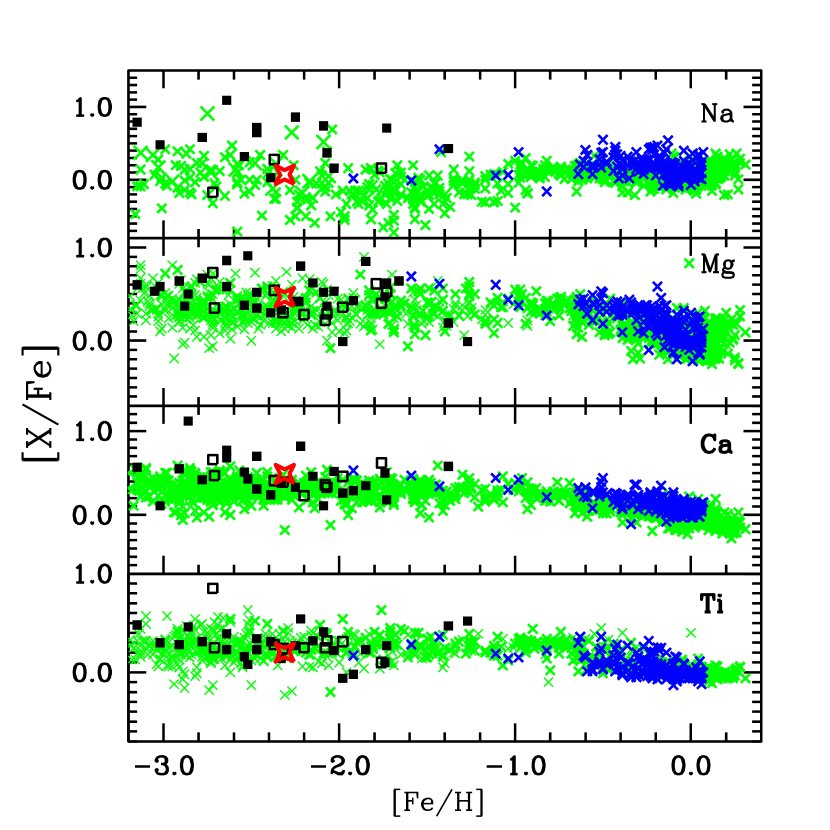
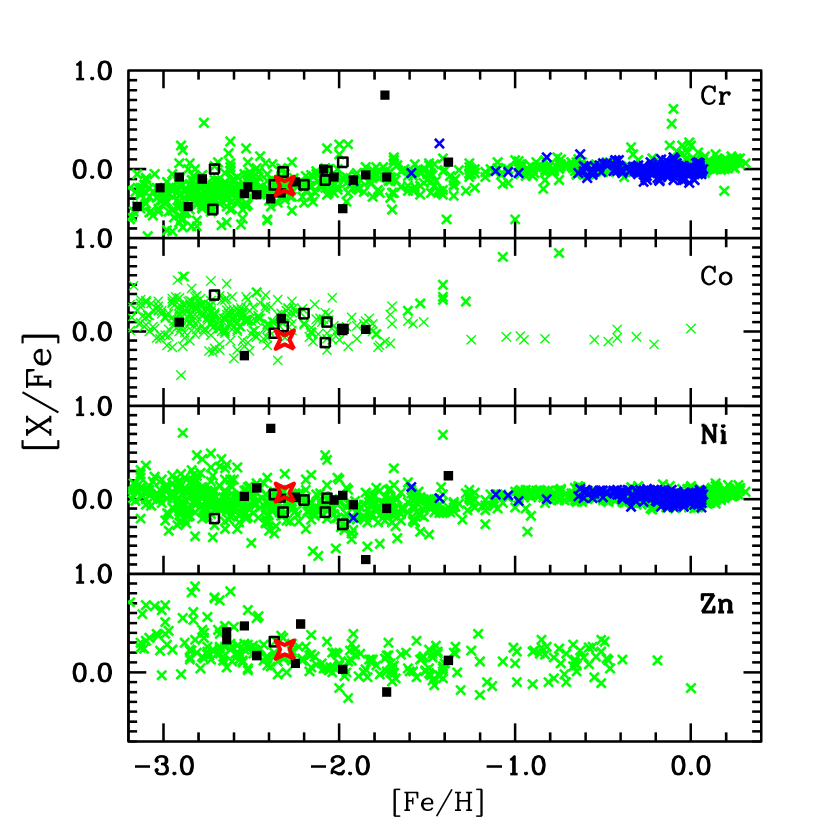
Since CD-50776 is a new CEMP-s star (Section 4.4.3), we also compare its abundances to other CEMP-s stars. Figures 9 and 10 show the abundance ratios [X/Fe] versus. metallicity for Na, -elements and iron-peak elements (Cr, Co, Ni and Zn) of CD-50776 compared to several previous abundance studies of stars of the thin and thick disks and the halo populations. CEMP-s giant stars and dwarfs are represented by filled and open squares, respectively. We also plot in these Figures the abundance ratios of barium stars and of some CH stars (except carbon, cobalt, zinc and barium), based on the recent analysis by de Castro et al. (2016).
Sodium abundance in CEMP-s stars exhibits the same trend as for the other metal-poor field stars. Some CEMP-s stars display higher [Na/Fe] ratios than the stars with similar metallicity, however this can be caused by NLTE effects, which seem to be stronger in metal-poor stars (see Aoki et al. 2007 for a discussion of sodium abundance in CEMP stars). Our derived value of for the [Na/Fe] ratio indicates that NLTE effects seem to be negligible in this star.
In Figure 9, we verify that the abundances of -elements (Mg, Ca and Ti) are those of other authors in the field stars of the same metallicity as CD-50776. The iron-group element nickel is expected to follow the iron abundance (Figure 10), as it actually does, with a [Ni/Fe] ratio equal to . Down to [Fe/H] , the [Ni/Fe] ratio has a scatter around the mean [Ni/Fe] = 0.0. Chromium in CD-50776 has a negative [Cr/Fe] ratio (), following the same ratio observed in stars with equal metallicity, as well as in some CEMP-s stars. The other iron-peak elements, cobalt and zinc, do not deviate from the trend observed in the field giants of the same metallicity. Concerning the other CEMP-s stars, most of them also follow the same trend as the metal-poor field giants for the -elements and the iron-peak elements. However, some of them present high [X/Fe] ratios for the Mg, Ca or Ti. Aoki et al. (2007) considered that some of these high [X/Fe] ratios, like calcium for example, “are possibly overestimated due to contamination by molecular features” since these stars have low temperatures. Another possibility is that the high [X/Fe] ratios would come from “faint supernovae” explosions (see Aoki et al. 2007 and the references therein). In addition some CEMP-s stars have abnormal low or high [X/Fe] ratios of the iron-peak elements, specially Cr and Ni. This is probably because the abundances of these elements in these stars were derived from one single line of each element (Cohen et al. 2006, Aoki et al. 2007).
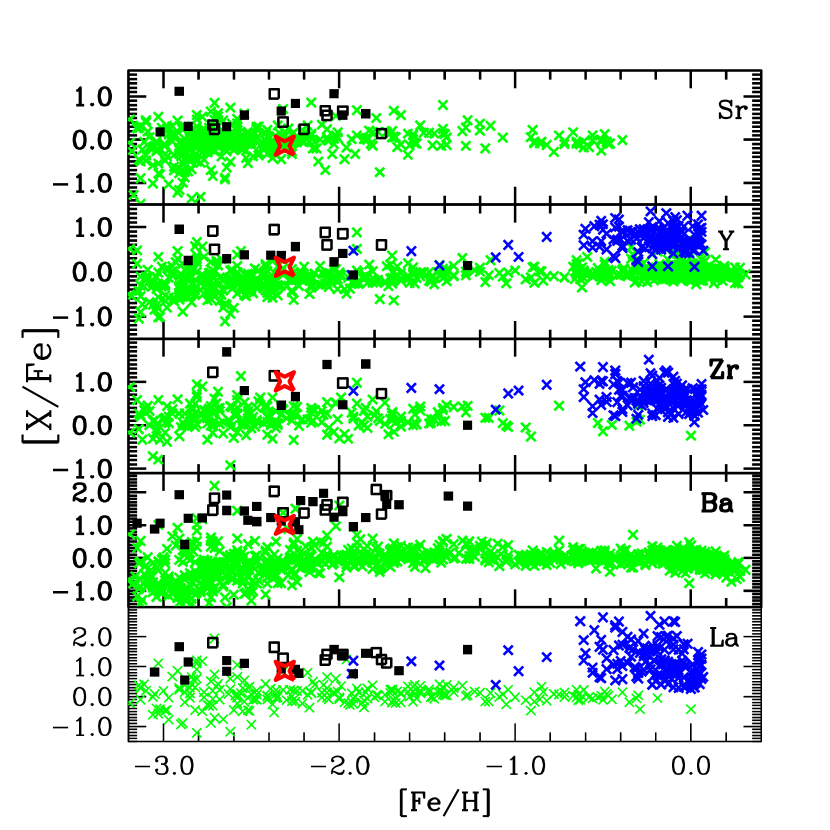
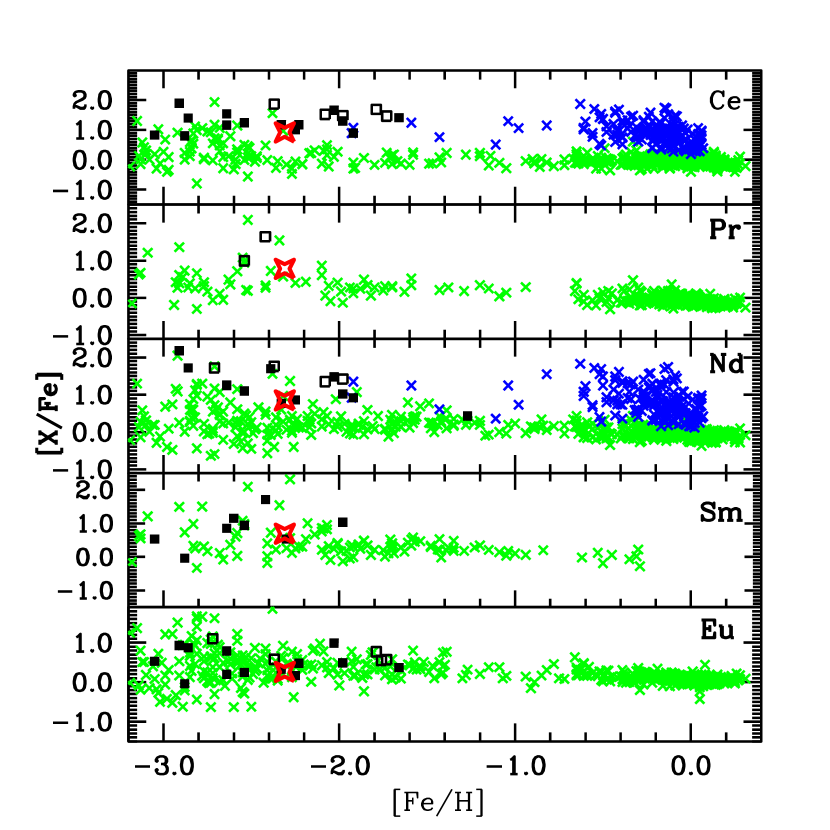
4.4.3 The heavy-elements: CD-50776 as a new CEMP-s star
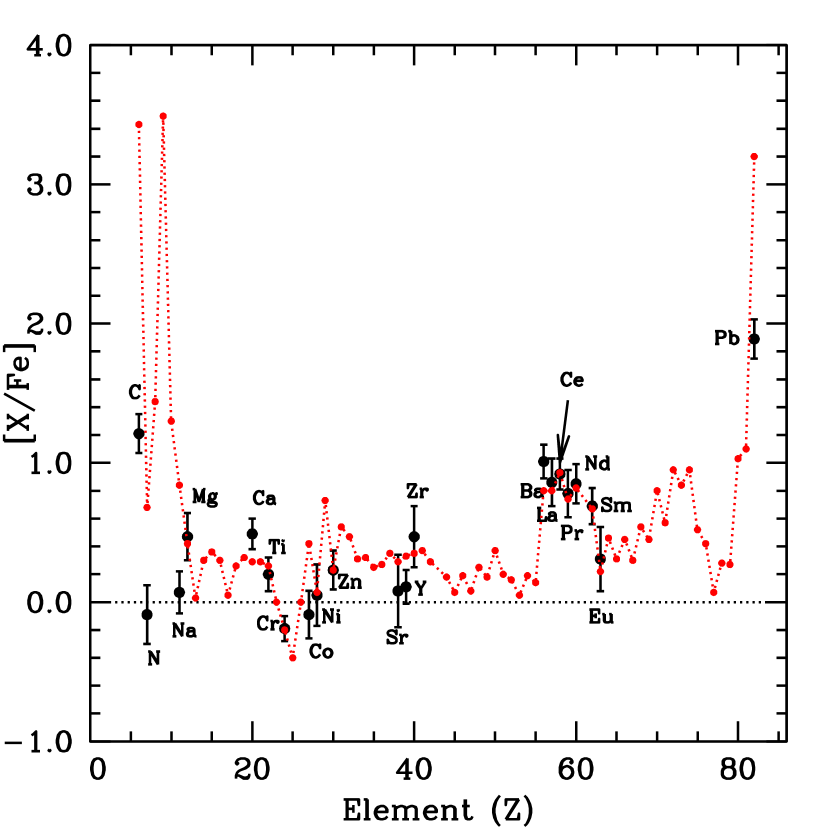
In Figures 11 and 12, we show the [X/Fe] ratios for the elements created by the r- and s-process: Sr, Y, Zr, Ba, La, Ce, Pr, Nd, Sm and Eu, in CD-50776 compared to other CEMP-s stars, field giants and barium stars, including barium stars and CH stars for several metallicities. Models of galactic chemical evolution do not predict the observed overabundances of the s-process elements observed in these plots (Travaglio et al. 1999, 2004). Since CD-50776 also follows the criteria given in Masseron et al. (2010) for a star to be considered as a CEMP-s star, that is [Ba/Fe] and [Ba/Eu] (our results are and , respectively, see Table 4), we can finally classify CD-50776 as a new CEMP-s star. The mean abundance ratio of the s-process elements ([Sr/Fe], [Y/Fe], [Zr/Fe], [Ba/Fe], [La/Fe], [Ce/Fe], [Nd/Fe] and [Pb/Fe]) for CD-50776 is high: . If the radial velocity variation reported in Table 6 can be attributed to orbital motion, then the atmosphere of CD-50776 could have been contaminated by an extrinsic past event like in the mass-transfer hypothesis, which is the standard scenario to explain the excess of carbon and the overabundances of the s-process elements in these chemically peculiar stars (Hansen et al. 2016).
Figures 11 and 12 also show that the abundance ratios [X/Fe] of the light elements of the s-process are lower than those of the heavy elements of the s-process. This is expected based on the s-process element production according to metallicity, since the first-peak elements (such as Sr, Y and Zr) are bypassed in favor of the second and third-peak elements (Busso, Gallino & Wasserburg 1999). Other CEMP-s stars show the same behavior (Aoki et al. 2007). For the elements of the r-process, the abundance ratios of [Pr/Fe], [Sm/Fe] and [Eu/Fe] in CD-50776 is similar to other CEMP-s stars previous analyzed. In addition, the low [Eu/Fe] ratio indicates that CD-50776 is a CEMP-s star.
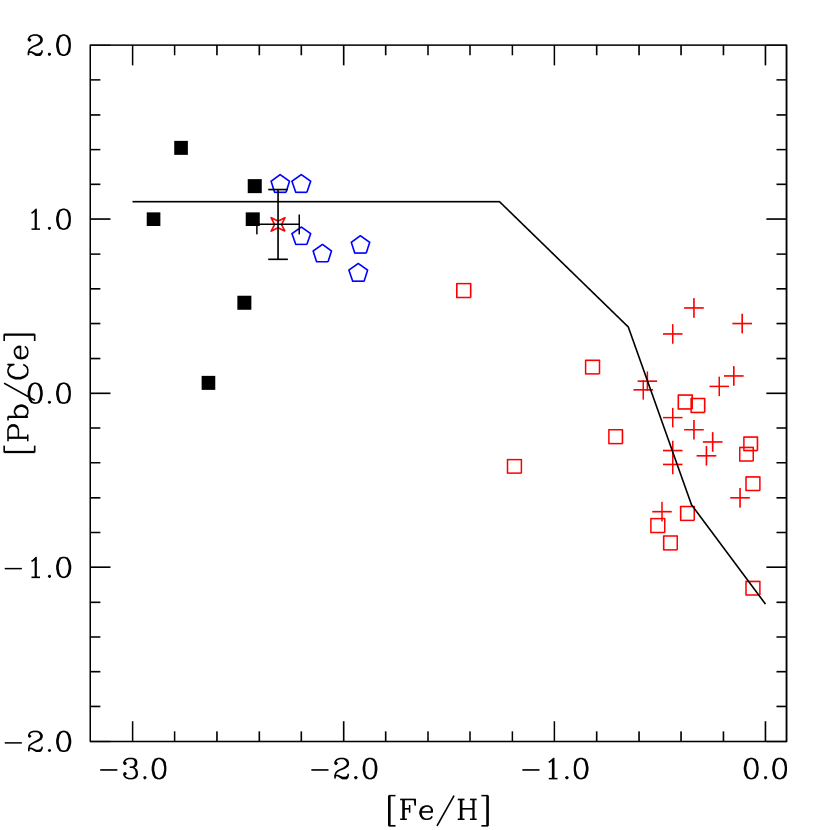
We note that CD-50776 is also a “lead star”. Figure 13 shows the [Pb/Ce] ratio as a function of metallicity for CD-50776 compared to the CH stars (blue polygons) the CEMP-s binary stars (red circles), the barium giants (red open squares) and the subgiant CH stars (red crosses). The position of CD-50776 in this diagram, close to the CH stars and other CEMP-s stars, indicates its lead star nature.
5 Conclusions
Based on high-resolution optical spectroscopic data, we present the first detailed analysis of the chemical abundances of the CEMP star CD-50776, including the light elements, Na, the -elements, the iron-peak elements, and the s-process elements. We showed that CD-50776 is characterized by an enhancement of carbon, s-process elements, and lead. This pattern, together with its low metalicity ([Fe/H] ), indicates that it is CEMP-s star. CD-50776 is also a “lead star”, since its lead-to-cerium ratio follows the theoretical predictions for a star of this metallicity.
One way to verify that CD-50776 is indeed a CEMP-s star is to use the nucleosynthesis models for AGB stars calculated by Bisterzo et al. (2010). Using the tables given in this paper, we can compare the predicted surface abundance ratios, [X/Fe], with the observed abundances. The nucleosynthesis models forecast the theoretical [X/Fe] ratios for AGB stars with initial masses of 1.3M⊙, 1.4M⊙, 1.5M⊙ and 2.0M⊙, varying the number of thermal pulses and the quantity of 13C pocket for a metallicity [Fe/H] = 2.6, close to the metallicity of CD-50776.
Figure 14 illustrates this comparison, and shows that the best nucleosynthesis model that fits the observations is that of a star with an initial AGB mass of 1.3M⊙ for the ST/2 case. Inspecting another fits for the CEMP-s stars investigated in Bistezro et al. (2012), we verify that the abundance pattern of CD-50776 is similar to the pattern of the CEMP-s stars CS 22964-161, CS 22880-074, CS 22942-019, CS 30301-015, HD 196944, and BS 17436-058, where the abundance of lead was also determined. These stars were classified by Bistezro et al. (2012) as CEMP-sI, which means that the ratio [hs/Fe] (defined by Bistezro et al. (2012) as the mean [X/Fe] ratio given by ([La/Fe][Nd/Fe][Sm/Fe])/3.) is less than 1.5. In fact, CD-50776 has [hs/Fe] = 0.8.
However, CD-50776 presents another chemical peculiarity rarely observed in the CEMP-s stars, that is, a low abundance of nitrogen. As far as we know, this peculiarity has also been observed in the extragalactic CEMP-s star Scl-1013644 (Salgado et al. 2016). It is worth noting that the nucleosynthesis models of Bisterzo et al. (2010) predict a high abundance of carbon and nitrogen for CD-50776, which is not supported by our observations.
As mentioned in Bisterzo et al. (2011), the ratios of [C/Fe], [N/Fe] and the 12C/13C isotopic ratios are overestimated in AGB models where the occurrence of mixing produced by the ’Cool Bottom Processing’ (CBP) has been accounted to explain the abundances of carbon and nitrogen in CEMP-s stars. However, the efficiency of this process is difficult to estimate due to the influence of other physical phenomena such as rotation, thermohaline mixing, and magnetic fields.
On the other hand, as discussed in Section 4.1.1, the low abundance of nitrogen could be explained assuming an initial mass of 2.0M⊙ of the donor star without the occurrence of CBP. Thus, it seems that the mixing process and their efficiency in both the AGB star and the star that received the ejected material should be better modeled to fit the observations. Finally, we recall that further spectroscopic observations will be important to obtain radial velocity measurements and to investigate the binary nature of this star.
6 Acknowledgements
N.A.D. acknowledges FAPERJ, Rio de Janeiro, Brazil, for Visiting Researcher grant E-26/200.128/2015 and the Saint Petersburg State University for research grant 6.38.335.2015. We also thank the referee, Chris Sneden, for the valuable remarks that improved the paper.
References
- [1] Allen, D.M. & Barbuy, B. 2006, A&A, 454, 895
- [2] Alves-Brito, A., Meléndez, J., Asplund, M., Ramírez, I., Yong, D.C., 2010, A&A, 513, 35
- [3] Aoki, W., Norris, J.E., Ryan, S.G., Beers, T.C. & Ando, H., 2002, ApJ, 567, 1166
- [4] Aoki, W., Honda, S. Beers, T.C., Kajino, T. Ando, H., et al. 2005, ApJ, 632, 611
- [5] Aoki, W., Beers, T.C., Christlieb, N., Norris, J.E., Ryan, S.G. & Tsangarides, S., 2007, ApJ, 655, 492
- [6] Barbuy, B., Cayrel, R., Spite, M., Beers, T.C. Spite, F. et al, 1997, A&A, 317, L63
- [7] Barklem, P.S., Christlieb, N., Beers, T.C., Hill, V., Bessell, M.S. et al. 2005, A&A, 439, 129
- [8] Beers, T. C., Preston, G. W. & Shectman, S.A., 1985, AJ, 90, 2089
- [9] Beers, T.C., Chiba, M., Yoshii, Y., Platais, I., Hanson, R.B., 2000, AJ, 119, 2866
- [10] Beers, T.C., Preston, G.W. & Shectman, S.A., 1992, AJ, 103, 1987
- [11] Beers, T.C. & Christlieb, N., 2005, ARA&A, 43, 531
- [12] Beers, T.C., Norris, J.E., Placco, V.M., Lee, Y.S., Rossi, S., Carollo, D. & Masseron, T., 2014, ApJ, 794, 58
- [13] Beers, T.C., Placco, V.M., Carollo, D., Rossi, S., Lee, Y.S. et al., 2017, ApJ, 835, 81
- [14] Biemont, E. & Godefroid, M., 1980, A&A, 84, 361
- [15] Bidelman, W. P., 1981, AJ, 86, 553
- [16] Bidelman, W.P. & MacConnell, D.J., 1973, AJ, 78, 687
- [17] Bisterzo, S., Gallino, R., Straniero, O., Cristallo, S. & Käppeler, F., 2010, MNRAS, 404, 1529
- [18] Bisterzo, S., Gallino, R., Straniero, O., Cristallo, S. & Käppeler, F., 2011, MNRAS, 418, 248
- [19] Bisterzo, S., Gallino, R., Straniero, O., Cristallo, S. & Käppeler, F., 2012, MNRAS, 422, 849
- [20] Bond, H., 1970, ApJS, 22, 117
- [21] Bond, H., 1980, ApJS, 44, 517
- [22] Bonifacio, P., Molaro, P., Beers, T.C. & Vladilo, G., 1998, A&A, 332, 672
- [23] Burris, D.L., Pilachowski, C.A., Armandroff, T.E., Sneden, C. & Cowan, J.J. 2000, ApJ, 544, 302
- [24] Busso, M., Gallino, R. & Wasserburg, G.J., 1999, ARA&A, 37, 239
- [25] Cayrel, R., Depagne, E., Spite, M., Hill, V.; Spite, F., 2004, A&A, 416, 1117
- [26] Chen, Y.Q., Zhao, G., Nissen, P.E., Bai, G.S. & Qiu, H.M., 2003, ApJ, 591, 925
- [27] Christlieb, N., Green, P.J., Wisotzki, L. & Reimers, D., 2001, A&A,, 375, 266
- [28] Cohen, J.G., McWilliam, A., Shectman, S., Thompson, I., Christlieb, N. et al. 2006, ApJ, 132, 137
- [29] de Castro, D.B., Pereira, C.B., Roig, F., Jilinski, E., Drake, N.A. et al. 2016, MNRAS, 459, 4299
- [30] Depagne, E., Hill, V., Spite, M., Spite, F., Plez, B., et al. 2002, A&A, 390, 187
- [31] Den Hartog, E.A., Lawler, J.E., Sneden, C. & Cowan, J.J., 2003, ApJS, 148, 543
- [32] Drake, J.J. & Smith, G., 1991, MNRAS, 250, 89
- [33] Drake, N.A. & Pereira, C.B., 2011, A&A, 531, 133
- [34] Edvardsson, B., Andersen, J., Gustafsson, B., Lambert, D.L., Nissen, P. E., et al, 1993, A&A, 275, 101
- [35] For, Bi-Qing & Sneden, C., 2010, AJ, 140, 1694
- [36] François, P., Depagne, E., Hill, V., Spite, M., Spite, F., et al, 2017, A&A,, 476, 935
- [37] Frebel, A., & Norris, J. E. 2013, in Planets, Stars, and Stellar Systems, Vol. 5, ed. T. Oswalt & G. Gilmore (Dordrecht: Springer), p.5
- [38] Fulbright, J.P., 2000, AJ, 120, 1841
- [39] Goriely, S. & Mowlavi, N., 2000, A&A, 362, 599
- [40] Goswami, A., A i, W., Beers, T.C., Christlieb, N., Norris, J.E. et al. 2006, MNRAS, 372, 343
- [41] Gratton, R.G. & Sneden, C., 1988, A&A, 204, 193
- [42] Gratton, R.G. & Sneden, C., 1991, A&A,, 241, 501
- [43] Gratton, R.G. & Sneden, C., 1994, A&A< 287, 927
- [44] Gratton, R.G., Sneden, C., Carretta, E. & Bragaglia, A., 2000, A&A,, 354, 169
- [45] Grevesse, N. & Sauval, A.J., 1998, Spa. Sci. Rev., 85, 161
- [46] Hannaford, P., Lowe, R.M., Grevesse, N., Biemont, E. & Whaling, W., 1982, ApJ, 261, 736
- [47] Hansen, C.J., Nordström, B., Hansen, T.T., Kennedy, C.R., Placco, V.M., 2016, A&A, 588, 3
- [48] Herwig, F., 2004, ApJS, 155, 651
- [49] Hill, V., Barbuy, B., Spite, M., Spite, F., Cayrel, R. et al, 2000, A&A, 353, 557
- [50] Hill, V., Plez, B., Cayrel, R., Beers, T.C., Nordström, B., 2002, A&A, 387, 560
- [51] Honda, S., Aokii, W., Kajino, T., Ando, H., Beers, T.C. et al. , 2004, ApJ, 607, 474
- [52] Ishigaki, M.N., Aokii, W. & Chiba, M., 2013, ApJ, 771, 671
- [53] Johnson, J.A., 2002, ApJS, 139, 219
- [54] Johnson, J.A., Herwig, F., Beers, T.C. & Christlieb, N., 2007, ApJ, 658, 1203
- [55] Jonsell, K., Barklem, P.S., Gustafsson, B., Christlieb, N., Hill, V., 2006, A&A, 451, 651
- [56] Kaufer, A., Stahl, O. Tubbesing, S., et al. 1999, The Messenger, 95, 8.
- [57] Kim, Yong-Cheol, Demarque, P., Yi, S.K. & Alexander, D.R., 2002, ApJS, 143, 499
- [58] Komiya, Y., Suda, T., Minaguchi, H., Shigeyama, T., Aokii, W., et al. 2007, ApJ, 658, 267
- [59] Kurucz, R.L. 1993, CD-ROM 13, Atlas9 Stellar Atmosphere Programs and 2 km/s Grid (Cambridge: Smithsonian Astrophys. Obs)
- [60] Lambert, D.L., Smith, V.V. & Heath, J., 1993, PASP, 105, 568
- [61] Lambert, D.L., Heath, J.E., Lemke, M. & Drake, J., 1996, ApJS, 103, 183
- [62] Lawler, J.E., Bonvallet, G. & Sneden, C., 2001, ApJ, 556, 452
- [63] Lawler, J.E., Den Hartog, E.A., Sneden, C. & Cowan, J.J., 2006, ApJS, 162, 227.
- [64] Lawler, J.E., Sneden, C., Cowan, J.J., Ivans, I.I. & Den Hartog, E.A., 2009, ApJS, 182, 51
- [65] Ljung, G., Nilsson, H., Asplund, M. & Johansson, S., 2006, A&A, 456, 1181
- [66] Lucatello, S., Gratton, R., Cohen, J.G., Beers, T.C., Christlieb, N. et al., 2003, AJ, 125, 875
- [67] Lucatello, S., Beers, T.C., Christlieb, N., Barklem, P.S.; Rossi, S., 2006, ApJ, 652, L37
- [68] Luck, R.E. & Heiter, U., 2007, AJ, 133, 2464
- [69] Martin, W. C., Fuhr, J. R., Kelleher, D. E., et al. 2002, NIST Atomic Spectra Database (Version 2.0; Gaithersburg, MD: NIST)
- [70] Mashonkina, L., Gehren, T., Shi, J.-R., Korn, A.J. & Grupp, F., 2011, A&A, 528, 87
- [71] Masseron, T., van Eck, S., Famaey, B., Goriely, S., Plez, B. et al. 2006, A&A, 455, 1059
- [72] Masseron, T., Johnson, J.A., Plez, B., van Eck, S., Primas, F. et al. 2010, A&A 509, 93
- [73] McWilliam, A., Preston, G.W., Sneden, C. & Shectman, S., 1995, AJ, 109, 2736
- [74] McWilliam, A. 1998, AJ115, 1640
- [75] Mishenina, T.V. & Kovtyukh, V.V., 2001, A&A, 370, 951
- [76] Mishenina, T.V., Kovtyukh, V.V., Soubiran, C., Travaglio, C. & Busso, M., 2002, A&A, 396, 189
- [77] Mishenina, T.V., Bienaymé, O., Gorbaneva, T.I., Charbonnel, C., et al. 2006, A&A, 456, 1109
- [78] Mishenina, T.V., Gorbaneva, T.I., Bienaymé, O., Soubiran, C., Kovtyukh, V.V. et al. 2007, ARep, 51, 382
- [79] Mucciarelli, A., Caffau, E., Freytag, B., Ludwig, H.-G. & Bonifacio, P., 2008, A&A, 484, 841
- [80] Norris, J., Bessell, M.S. & Pickles, A.J., 1985, ApJS, 58, 463
- [81] Norris, J.E., Ryan, S. G. & Beers, T.C., 1996, ApJS, 107,391
- [82] Norris, J.E., Ryan, S.G. & Beers, T.C., 1997, ApJ, 488, 250
- [83] Norris, J.E., Ryan, S.G. & Beers, T.C., 1997, ApJ, 489, L169
- [84] Norris, J.E., Ryan, S.G. & Beers, T.C., 2001, ApJ, 561, 1034
- [85] Pereira, C.B. & Drake, N.A., 2009, A&A, 496, 791
- [86] Pereira, C.B., Jilinski, E., Drake, N.A., de Castro, D.B., Ortega, V.G. et al. 2012, A&A, 543, 59
- [87] Pereira, C. B., Jilinski, E.G., Drake, N.A., Ortega, V.G. & Roig, F., 2013, A&A, 559, 12
- [88] Pilachowski, C.A., Sneden, C. & Kraft, R.P., 1996, AJ, 111, 1689
- [89] Preston, G.W. & Sneden, C., 2001, ApJ, 122, 1545
- [90] Reddy, B. E., Bakker, E. J. & Hrivnak, B.J. 1999, ApJ, 524, 831
- [91] Reddy, B.E., Tomkin, J., Lambert, D.L. & Allende Prieto, C., 2003, MNRAS, 340, 304
- [92] Roederer, I.U., Preston, G.W., Thompson, I.B., Shectman, S.A. & Sneden, C., 2014, AJ, 147, 136
- [93] Rossi, S., Beers, T.C., Sneden, C., Sevastyanenko, T., Rhee, J. & Marsteller, B., 2005, AJ, 130, 2804
- [94] Ruchti, G.R., Bergemann, M., Serenelli, A., Casagrande, L. & Lind, K., 2013, MNRAS, 429, 126
- [95] Ryan, S.G. & Deliyannis, C.P., 1998, ApJ, 500, 398
- [96] Sackmann, I.-J. & Boothroyd, A.I., 1992, ApJ, 392, L71
- [97] Salgado, C.; Da Costa, G.S., Yong, D. & Norris, J.E., 2016, MNRAS, 463, 598
- [98] Schuster, W.J., Moitinho, A., Márquez, A., Parrao, L., Covarrubias, E., 2006, A&A, 445, 939
- [99] Sivarani, T., Bonifacio, P., Molaro, P., Cayrel, R., Spite, M., 2004, A&A, 413, 1073
- [100] Smith, V.V., Cunha, K., Jorissen, A. & Boffin, H.M.J. 1996, A&A, 315, 179
- [101] Sneden, C., 1973, Ph.D. Thesis, Univ. of Texas
- [102] Sneden, C., Preston, G.W., McWilliam, A. & Searle, L., 1994, ApJ, 431, L27
- [103] Sneden, C., McWilliam, A., Preston, G.W., Cowan, J.J., Burris, D.L. & Armosky, B.J., 1996, ApJ, 467, 819
- [104] Sneden, C., Cowan, J.J., Lawler, J.E., Ivans, I.I., Burles, S., 2003a, ApJ, 591, 936
- [105] Sneden, C., Preston, G.W. & Cowan, J.J., 2003b, ApJ, 592, 504
- [106] Sneden, C., Lawler, J.E., Cowan, J.J., Ivans, I.I. & Den Hartog, E.A., 2009, ApJS, 182, 80
- [107] Sneden, C., Lucatello, S., Ram, R.S., Brooke, J.S.A. & Bernath, P., 2014, ApJS, 214, 26
- [108] Sobeck, J.S., Kraft, R.P., Sneden, C,, Preston, G.W., Cowan, J.J. et al., 2011, AJ, 141, 175
- [109] Travaglio, C., Galli, D., Gallino, R., Busso, M. & Ferrini, F., 1999, ApJ, 510, 325
- [110] Travaglio, C., Gallino, R., Arnone, E., Cowan, J., Jordan, F., 2004, ApJ, 601, 964
- [111] Van Eck, S. & Jorissen, A., 1999, A&A, 345, 127
- [112] van Eck, S., Goriely, S., Jorissen, A. & Plez, B., 2003, A&A, 404, 291
- [113] Wood, M.P., Lawler, J.E., Sneden, C. & Cowan, J.J., 2014, ApJS, 211, 20
- [114] Yoon, J., Beers, T.C., Placco, V. M., Rasmussen, K.C., Carollo, D. 2016, ApJ, 833, 20
- [115] Zhang, L., Ishigaki, M., Aoki, W., Zhao, G. & ; Chiba, M., 2009, ApJ, 706, 1095