11email: delphine.porquet@astro.unistra.fr 22institutetext: Astrophysics Group, School of Physical & Geographical Sciences, Keele University, Keele ST5 5BG, UK 33institutetext: CSST, University of Maryland Baltimore County, 1000 Hilltop Circle, Baltimore, MD 21250, USA 44institutetext: Dipartimento di Matematica e Fisica, Università degli Studi Roma Tre, via della Vasca Navale 84, 00146, Roma, Italy 55institutetext: INAF-Osservatorio Astrofisico di Arcetri, Largo Enrico Fermi 5, 50125, Firenze, Italy 66institutetext: INAF-Osservatorio Astronomico di Brera, via Bianchi 46, 23807, Merate (LC), Italy 77institutetext: Center for Relativistic Astrophysics, School of Physics, Georgia Institute of Technology, 837 State Street, Atlanta, GA 30332-0430, USA 88institutetext: Space Sciences Laboratory, University of California, Berkeley, CA 94720, USA 99institutetext: DTU Space, National Space Institute, Technical University of Denmark, Elektrovej 327, DK-2800 Lyngby, Denmark 1010institutetext: Dr Karl Remeis-Observatory and Erlangen Centre for Astroparticle Physics, Sternwartstr. 7, D-96049 Bamberg, Germany 1111institutetext: Department of Physics, Virginia Tech, Blacksburg, VA 24061, USA 1212institutetext: Cahill Center for Astronomy and Astrophysics, California Institute of Technology, Pasadena, CA 91125, USA 1313institutetext: Harvard-Smithsonian Center for Astrophysics, 60 Garden Street, Cambridge, MA 02138, USA 1414institutetext: Columbia Astrophysics Laboratory, Columbia University, New York, New York 10027, USA 1515institutetext: Jet Propulsion Laboratory, California Institute of Technology, Pasadena, CA 91109, USA 1616institutetext: INAF-IASF Bologna, Via Gobetti 101, I-40129 Bologna, Italy 1717institutetext: NASA Goddard Space Flight Center, Code 662, Greenbelt, MD 20771, USA
A deep X-ray view of the bare AGN Ark120.
Abstract
Aims. [Abstract Truncated] We perform an X-ray spectral analysis of the brightest and cleanest bare AGN known so far, Ark 120, in order to determine the process(es) at work in the vicinity of the SMBH.
Methods. We present spectral analysis of data from an extensive campaign observing Ark 120 in X-rays with XMM-Newton (4120 ks, 2014 March 18–24), and NuSTAR (65.5 ks, 2014 March 22).
Results. During this very deep X-ray campaign, the source was caught in a high flux state similar to the earlier 2003 XMM-Newton observation, and about twice as bright as the lower-flux observation in 2013. The spectral analysis confirms the “softer when brighter” behaviour of Ark 120. The four XMM-Newton/pn spectra are characterized by the presence of a prominent soft X-ray excess and a significant Fe K complex. The continuum is very similar above about 3 keV, while significant variability is present for the soft X-ray excess. We find that relativistic reflection from a constant-density, flat accretion disk cannot simultaneously produce the soft excess, broad Fe K complex, and hard X-ray excess. Instead, Comptonization reproduces the broadband (0.3–79 keV) continuum well, together with a contribution from a mildly relativistic disk reflection spectrum.
Conclusions. During this 2014 observational campaign, the soft X-ray spectrum of Ark 120 below 0.5 keV was found to be dominated by Comptonization of seed photons from the disk by a warm (0.5 keV), optically-thick corona (9). Above this energy, the X-ray spectrum becomes dominated by Comptonization from electrons in a hot optically thin corona, while the broad Fe K line and the mild Compton hump result from reflection off the disk at several tens of gravitational radii.
Key Words.:
X-rays: individuals: Ark 120 – Galaxies: active – (Galaxies:) quasars: general – Radiation mechanism: general – Accretion, accretion disks –1 Introduction
In the standard picture, the emission of an active galactic nucleus (AGN) stems from an accretion disk around a supermassive black hole (SMBH) with mass spanning from a few millions to billions of solar masses. X-ray spectra offer a unique potential to probe matter very close to the black hole and to measure the black hole spin. The X-ray spectra of AGN usually exhibit one or more of the following components: a soft excess below 2 keV, a power-law continuum up to about 10 keV, a Fe K line complex near 6.4 keV, and a Compton scattering hump near 20–30 keV.
Recent studies using XMM-Newton have shown that the soft X-ray excess component is commonly seen in AGN, and that for most AGN (the exception possibly being low-mass Narrow Line Seyfert 1 galaxies; Done et al. 2012) this soft excess is not the hard tail of the big blue bump observed in the UV coming from blackbody emission of the accretion disk (e.g., Gierliński & Done 2004; Porquet et al. 2004; Piconcelli et al. 2005). Different explanations have been proposed: e.g., photo-ionized emission blurred by relativistic motion in the accretion disk (e.g., Crummy et al. 2006); Comptonization of soft (extreme UV) seed photons by the electrons of a corona above the disk (e.g., Czerny & Elvis 1987); and an artifact of strong, relativistically smeared, partially ionized absorption (Gierliński & Done 2004). These models can give a good representation of the soft excess, though the current simulations of line-driven AGN accretion disk winds cannot reproduce the smooth, soft X-ray excess (Schurch et al. 2009). Therefore, the origin of the soft excess is still an open issue.
Besides, the study of the Fe K complex emission can be used to provide fundamental diagnostics of the physical and dynamical conditions of the AGN central engine from the inner part of the accretion disk to the far-away molecular torus. Relativistic (or broad) Fe K lines have been studied in numerous AGN (e.g., Nandra et al. 2007; Brenneman & Reynolds 2009; Patrick et al. 2012); especially MCG-06-30-15 (e.g., Tanaka et al. 1995; Fabian et al. 2002; Marinucci et al. 2014), and other particular AGN thanks notably to XMM-Newton and/or NuSTAR data (NGC 1365: Risaliti et al. 2013 and Walton et al. 2014; Mrk 335: Parker et al. 2014; and SWIFT J2127.4+5654: Marinucci et al. 2014). Yet, the physical interpretation of the observed broad Fe K lines has been disputed due to the common presence of a warm absorber (Porquet et al. 2004; Piconcelli et al. 2005; Blustin et al. 2005), which has been proposed to explain in part the broadness of the lines (Turner & Miller 2009). Indeed, the presence of this hot gas on the line-of-sight could severely complexify the X-ray data analysis, in particular by distorting the underlying continuum of the Fe K line. However, arguments against this interpretation have been invoked by Reynolds et al. (2009).
Likewise, several origins for the hard X-ray spectrum above 10 keV
for type 1 Seyferts have been proposed, such
as relativistic reflection, complex absorption, and Comptonization, or
a combination thereof
(e.g., Nardini et al. 2011; Noda et al. 2011; Patrick et al. 2011, 2012; Risaliti et al. 2013; Walton et al. 2014; Ursini et al. 2015; Mehdipour et al. 2015).
Therefore, AGN showing no (or very weak) presence of any X-ray
warm absorber – so-called “bare AGN” – are the best
targets to directly investigate the process(es) at work in the vicinity
of SMBHs.
Ark 120 (z=0.033, =1.500.19108 M⊙111Black hole mass determined via reverberation mapping (Peterson et al. 2004).) is the brightest and cleanest bare AGN known so far, i.e. displaying neither intrinsic reddening in its IR continuum nor evidence for absorption in UV and X-rays (e.g., Ward et al. 1987; Crenshaw et al. 1999; Reynolds 1997). The first XMM-Newton observation performed in August 2003 (80 ks pn net exposure time) confirmed that its spectrum is warm absorption-free, with the smallest upper limit to the column density found among AGN (31019 cm-2; Vaughan et al. 2004). Ark 120 therefore represents the best target to have the “purest” view of the properties of the accretion disk and of the black hole spin in AGN. This object displays a prominent soft excess observed down to 0.3 keV and a significant Fe K line complex (Vaughan et al. 2004). The width of the broad component of the Fe K line (FWHM30 000 km s-1) was much larger than that of the broad optical lines from the broad line region (BLR), with FWHM(Hβ)=5 850480 km s-1 (Wandel et al. 1999). Ark 120 was also observed with Suzaku in April 2007 (100 ks) confirming the presence of a large soft excess and of a significant broad Fe K line (Nardini et al. 2011; Patrick et al. 2011). Recently, Matt et al. (2014) reported the first spectral analysis of a simultaneous XMM-Newton and NuSTAR observation performed in February 2013. They found that the smooth soft excess was more likely explained by Comptonization. In contrast with the 2003 XMM-Newton observation (Vaughan et al. 2004) and the 2007 Suzaku observation (Nardini et al. 2011), while a significant soft excess was present too, no obvious signature for relativistic reflection was found in the 2013 observation. It is worth mentioning that in 2013 the flux of Ark 120 was lower by about a factor of two than during the 2003 observation. Both this lower flux and the lack of any relativistic signature in this 2013 observation (“low-flux state”) may be explained by the presence of an extended optically-thick corona which hides most of the relativitic reflection from the accretion disk, while in 2003 (“high-flux state” ) and in 2007 (“intermediate-flux state”) this corona was likely less thick and/or less extended (Matt et al. 2014).
An extensive X-ray observational campaign was performed from 2014 March 18 to March 24 to study Ark 120 in order to directly probe the accretion disk properties and the SMBH spin in this moderate Eddington ratio AGN (Ṁ0.05 ṀEdd; Vaughan et al. 2004). This campaign combined a deep XMM-Newton observation (480 ks split into four consecutive 120 ks observations from 2014 March 18 to March 24; PI: D. Porquet) with a simultaneous 120 ks Chandra/HETG observation222This was the first Chandra observation of Ark 120. The observation was split in three consecutive sequences as described in Reeves et al. (2016) and Nardini et al. (2016). (PI: D. Porquet). Furthermore, a NuSTAR observation (65 ks; PI: NuSTAR AGN team) was performed during the third XMM-Newton observation, i.e., on 2014 March 22.
In Reeves et al. (2016) (hereafter Paper I), we reported on the analysis of the soft X-ray spectrum using the 480 ks XMM-Newton/RGS and 120 ks Chandra/HETG spectra. We confirmed that there were no detectable absorption lines due to the warm absorber in the deep RGS spectra, and that Ark 120 is the cleanest bare nucleus AGN known so far. Only absorption lines from the interstellar medium of our Galaxy were found. Interestingly, several soft X-ray emission lines from the He-like and H-like ions of N, O, Ne and Mg were revealed for the first time thanks to this very high signal-to-noise (S/N) RGS spectrum. As a consequence, Ark 120 is not intrinsically bare since substantial X-ray emitting gas is present out of the direct line of sight towards this AGN. This result is very important in the framework of the unified scheme of AGN, which invokes the existence of wide scale obscuring and emitting gas (Antonucci 1993).
In Nardini et al. (2016) (hereafter Paper II) we took advantage of the unprecedented depth of the new data sets to study the properties of the composite emission complex due to iron fluorescence at 6–7 keV. The most prominent feature peaks around 6.4 keV, and can be plainly identified with the K transition from neutral iron. The profile of the narrow Fe K core is resolved in the Chandra/HETG spectrum with a FWHM of 4 700 km s-1, consistent with a BLR origin (as was also found for the soft X-ray emission lines; Paper I). Excess components are systematically detected redwards (6.0–6.3 keV) and bluewards (6.5–7.0 keV) of the narrow Fe K core. The energy and equivalent width of the red wing rule out an interpretation in the form of the Compton shoulder of the 6.4-keV K feature. Moreover, its variability over timescales of about one year (February 2013 to March 2014) hints at the presence of an emission component from the accretion disk. Excess emission maps and time-resolved spectra based on the four consecutive orbits of XMM-Newton monitoring show that both the red and blue features are highly variable on short timescales (30–50 ks) but appear to be disconnected. Such a timescale suggests an origin for these two components at a few tens of gravitational radii from the central supermassive black hole, potentially from discrete hot spots on the disk surface.
In Lobban et al. (2017) (submitted; hereafter Paper III), we presented the spectral/timing properties of Ark 120 using all available XMM-Newton data (including this XMM-Newton Large Programme), a recent 6-month Swift monitoring campaign (Gliozzi et al. 2017), and data from RXTE obtained between 1998 and 2006. The spectral decomposition was investigated through fractional rms, covariance and difference spectra, where we found that the mid- to long-timescale (day-year) variability is dominated by a relatively smooth, steep component, which peaks in the soft X-ray band. Additionally, we found evidence for a variable component of Fe K emission on the red side of the near-neutral Fe K core on long timescales, consistent with Paper II. We also measured the power spectrum and searched for frequency-dependent Fourier lags, obtaining the first detection of a high-frequency soft X-ray lag in this source. Finally, we found well-correlated optical/UV/X-ray variations with the Swift UVOT and searched for multi-wavelength time delays, finding evidence for the optical emission lagging behind the X-rays with a time delay of days.
In this Paper IV, we report on the X-ray spectral analysis of the four 120 ks XMM-Newton/pn time-averaged spectra performed in March 2014, which represent the deepest and longest elapsed time X-ray observation for a bare AGN. We also report on a NuSTAR observation that was simultaneous with the third 2014 XMM-Newton observation (see Table 1 for details). In section 2, we describe the observations, the data reduction, and the spectral analysis method. The spectral analysis of the four 2014 XMM-Newton/pn spectra is presented in section 3, and the broad-band X-ray spectrum (XMM-Newton and NuSTAR) of the 2014 March 22 observation in section 4. In section 5 our main results are summarized, before the discussion and conclusions in section 6.
2 Observations, data reduction and analysis
2.1 XMM-Newton and NuSTAR data reduction
| Mission | Obs. ID | Obs. Start (UTC) | Exp.a | (s-1) |
|---|---|---|---|---|
| XMM-Newton | 0721600201 | 2014 March 18 – 08:52:49 | 81.6 | 27.140.02 |
| XMM-Newton | 0721600301 | 2014 March 20 – 08:58:47 | 83.9 | 22.650.02 |
| XMM-Newton | 0721600401 | 2014 March 22 – 08:25:17 | 82.4 | 25.230.02 |
| NuSTAR | 60001044004 | 2014 March 22 – 09:31:07 | 65.5 | 1.0890.004 (FPMA) |
| 65.3 | 1.0720.004 (FPMB) | |||
| XMM-Newton | 0721600501 | 2014 March 24 – 08:17:19 | 81.9 | 22.780.02 |
During this observational campaign Ark 120 was observed by XMM-Newton over four consecutive orbits between 2014 March 18 and March 24 (Table 1). As reported in Paper II, the event files were reprocessed with the Science Analysis System (SAS) v14.0, applying the latest calibrations available in 2015 February. Due to the high source brightness, the EPIC instruments were operated in Small Window mode. However, this observation mode was not sufficient to prevent pile-up in the MOS cameras, and therefore only the EPIC/pn (Strüder et al. 2001) data are taken into account (selecting the event patterns 0-4, i.e., single and double pixels). The four pn spectra were extracted from a circular region centered on Ark 120, with a radius of 30 to avoid the edge of the chip. The background spectra were extracted from a rectangular region in the lower part of the small window that contains no (or negligible) source photon. The latest part of each orbit was not used due to high background flaring level. After the correction for dead time and background flaring, the total net exposure was about 330 ks. Redistribution matrices and ancillary response files for the four pn spectra were generated with the SAS tasks rmfgen and arfgen. As shown in Paper III, there is a significant flux variability during each of the four XMM-Newton observations and between them. However, the spectral variability within any single orbit is slow and moderate, so we are able to use time-averaged spectra for each of the four observations. As detailed in Paper II, a gain shift has to be applied to take into account the known inaccuracy of the EPIC/pn energy scale likely due to inaccuracies in the long-term charge transfer (CTI) calibration333See http://xmm2.esac.esa.int/docs/documents/CAL-SRN-0300-1-0.pdf and Marinucci et al. (2014).. The corresponding values for the xspec gain function are reported in Paper II. The 0.3–10 keV pn spectra were binned to give 50 counts per bin.
NuSTAR (Harrison et al. 2013) observed Ark 120 with its two co-aligned X-ray telescopes with corresponding Focal Plane Modules A (FPMA) and B (FPMB) starting on 2014 March 22 for a total of 131 ks of elapsed time. The Level 1 data products were processed with the NuSTAR Data Analysis Software (NuSTARDAS) package (v. 1.6.0). Cleaned event files (level 2 data products) were produced and calibrated using standard filtering criteria with the nupipeline task and the calibration files available in the NuSTAR calibration database (CALDB: 20170222). Extraction radii for both the source and the background spectra were arcmin. After this process, the net exposure time for the observation was about 65 ks, with most of the time lost to Earth occultations. The pair of 3.5–79 keV NuSTAR spectra were binned in order to over-sample the instrumental resolution by at least a factor of 2.5 and to have a S/N ratio greater than 5 in each spectral channel.
The summary log of the Ark 120 X-ray observations used in this work from the 2014 observational campaign are reported in Table 1.
2.2 Spectral analysis method
The xspec v12.9.0g software package (Arnaud 1996) was used for the spectral analysis. The Galactic column density is assumed to be =9.781020 cm-2 as inferred from the weighted average value of the LAB Survey of Galactic H i (Kalberla et al. 2005). Since there can be some additional contribution associated with molecular hydrogen (Willingale et al. 2013), we allow the value of Galactic to vary slightly (except for the fits above 3 keV, where the value is fixed to 9.781020 cm-2). However, we do not allow for any intrinsic absorption in the rest frame of Ark 120, since, as found in Paper I from the deep RGS spectrum, none is observed. We used the X-ray absorption model tbnew (v2.3.2) from Wilms et al. (2000), assuming throughout their interstellar medium (ISM) elemental abundances and the cross-sections from Verner et al. (1996).
As reported in Paper II, the narrow neutral core of the Fe K emission complex is consistent with being associated with the BLR, and so is some contribution to the H-like line of iron. Consequently, throughout this work we take into account the contribution from the BLR to the Fe K complex using three Gaussian lines: the Fe K ( fixed at 6.40 keV) plus its associated Fe K line ( fixed at 7.05 keV), and the H-like iron line ( fixed at 6.97 keV). The normalization of Fe K is set to 0.135 times that of Fe K (Palmeri et al. 2003). The widths of these three lines are fixed to the value inferred in Paper II for the Fe K narrow core, i.e., 43 eV, as determined from the simultaneous Chandra/HETG spectrum (Paper II). These three BLR emission lines are called hereafter “3 zgaussians(BLR)”.
Throughout this work, when considering relativistic reflection modelling, we use the relxill package (v0.4c444This package version is more recent than the one used in Paper II (v0.4a), however the fit differences are negligible.; released in May 2016). These reflection models calculate the proper emission angle of the radiation at each point on the accretion disk, and then take the corresponding reflection spectrum into account. This angle-dependent model connects self-consistently the xillver (Garcia & Kallman 2010; García et al. 2011, 2013, 2014) reflection models with the relativistic blurring code relline (Dauser et al. 2010, 2013, 2014, 2016). In this version 0.4c the cosmological redshift is properly taken into account in the cut-off energy as well. The models used in this work assume a constant density profile of the accretion disk with =1015 cm-3 (except when mentioned otherwise, see 4.1.2), and an exponentially broken power-law as the intrinsic continuum shape. Two main geometries are possible: the coronal one (relxill) and the lamppost one (relxilllp). Detailed descriptions of these models and their corresponding parameters are reported in Appendix A.
We use minimization throughout, quoting 90 percent errors for one interesting parameter (=2.71) unless otherwise stated. Default values of H0=70 km s-1 Mpc-1, =0.27, and are assumed. All figures are displayed in the AGN rest-frame.
3 Spectral analysis of the four 2014 XMM-Newton pn observations
| Parameters | relxill | relxill | relxilllp |
|---|---|---|---|
| 1.1 | 3(f) | ||
| () | 1 (f) | 17.8 | 1 (f) |
| () | 93 | ||
| nc | 0.0 (f)(a) | nc | |
| (degrees) | 38.0 | 31.1 | 35.1 |
| log (erg cm s-1) | 2.40.1 | 2.40.1 | 2.60.1 |
| 0.6 | 0.6 | 0.7 | |
| 2014 March 18 | |||
| 1.92 | 1.920.02 | 1.900.01 | |
| 0.5 | 0.50.1 | ||
| (10-4) | 2.30.1 | 2.30.1 | 2.40.1 |
| 2014 March 20 | |||
| 1.88 | 1.88 | 1.850.01 | |
| 0.50.1 | 0.50.1 | ||
| (10-4) | 2.20.1 | 2.20.1 | 2.30.1 |
| 2014 March 22 | |||
| 1.88 | 1.88 | 1.860.03 | |
| 0.50.1 | 0.50.1 | ||
| (10-4) | 2.50.1 | 2.50.1 | 2.60.1 |
| 2014 March 24 | |||
| 1.85 | 1.85 | 1.840.01 | |
| 0.40.1 | 0.40.1 | ||
| (10-4) | 2.50.1 | 2.50.1 | 2.50.1 |
| /d.o.f. | 4461.7/4568 | 4459.4/4569 | 4493.1/4572 |
| 0.98 | 0.98 | 0.98 | |
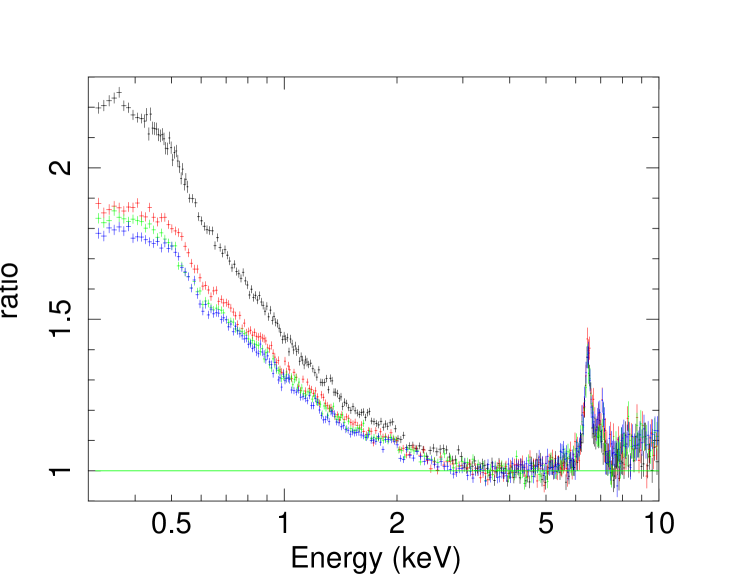
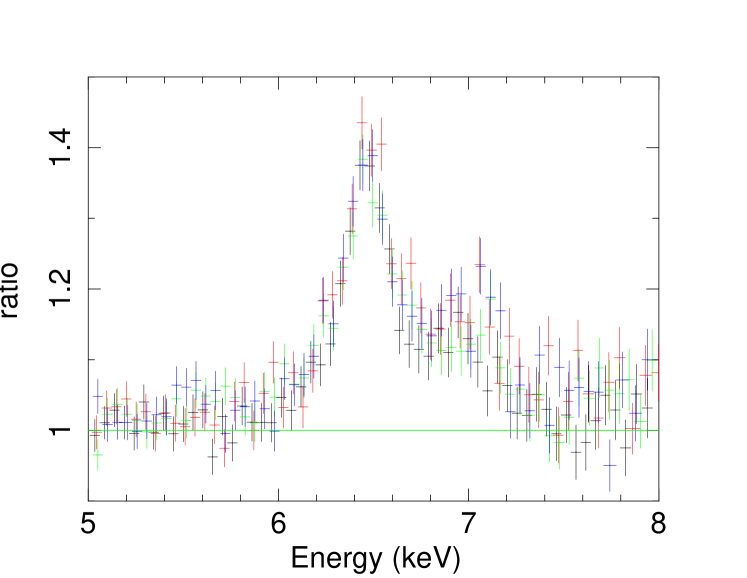
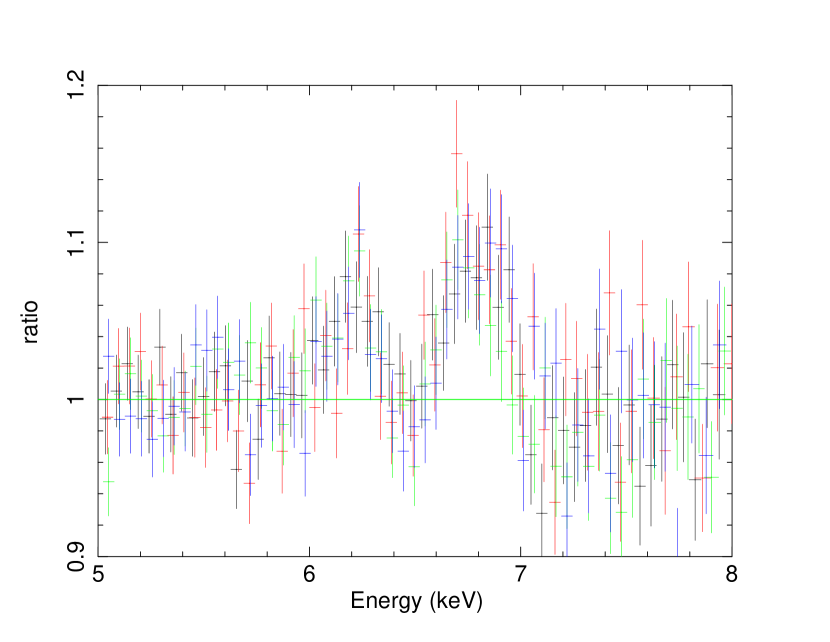
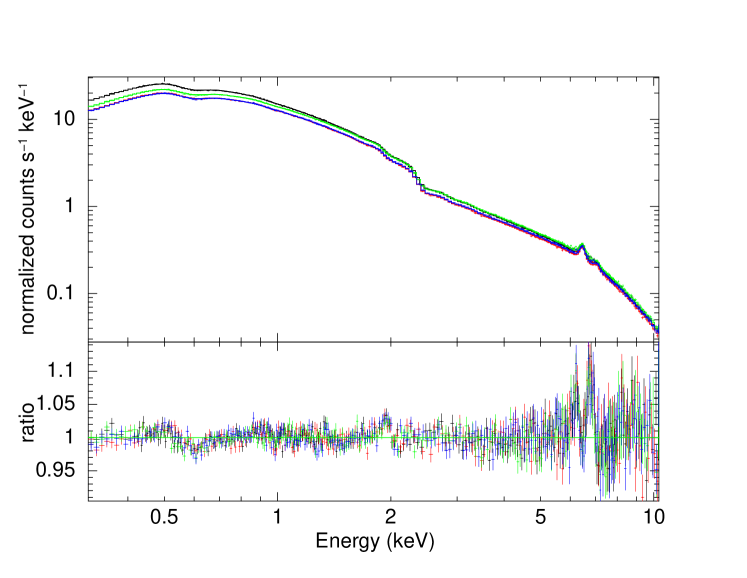
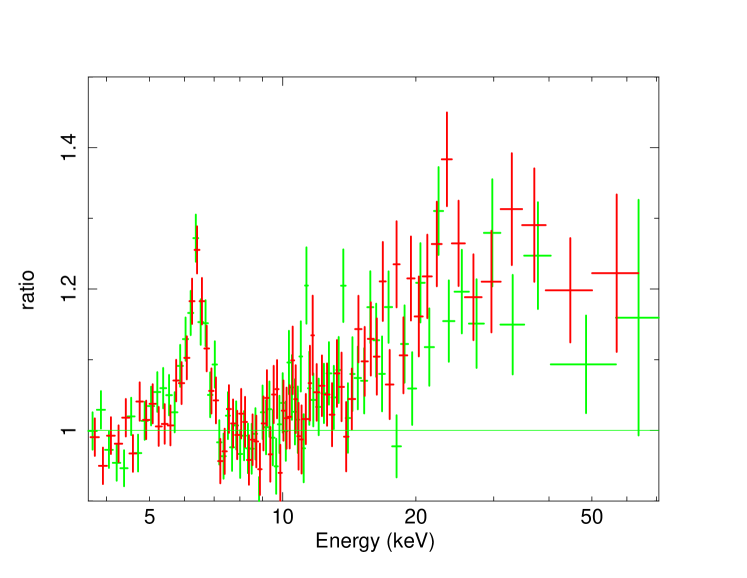
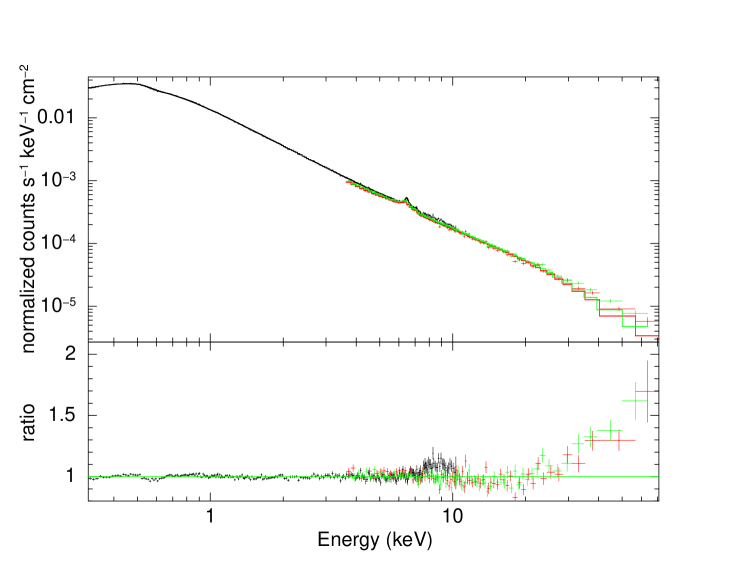
In order to characterize the main X-ray components of the spectra, we fit the four XMM-Newton/pn spectra between 3–5 keV using a simple absorbed power-law model. The absorption column density has been fixed to the Galactic one, i.e. 9.781020 cm-2. The power-law index is tied between the four spectra, while the normalization is allowed to vary between the observations (/d.o.f.=1656.8/1591). We find a photon index of 1.870.02, which is typical of those found for radio-quiet quasars (e.g., Porquet et al. 2004; Piconcelli et al. 2005). The unabsorbed flux values between 3 and 5 keV are about 1.8-2.010-11 erg cm-2 s-1 and are similar to that found for the 2003 XMM-Newton observation, and about twice as bright as the 2013 observation. Then, we extrapolate over the whole 0.3–10 keV energy range. As illustrated in Fig. 1 (top panel), the four observations show a significant soft X-ray excess below 2 keV that is variable between the observations (see also Paper III) with the first observation (2014 March 18) exhibiting the largest soft X-ray excess. The prominent Fe K line profile is consistently seen in each of the observations (Fig. 1, bottom panel), though as shown in Paper II the red and blue sides of the Fe K complex are variable on time-scale of about 10-15 hours, i.e faster than the total duration of each observation.
 |
 |
3.1 Spectral analysis above 3 keV
In this section, we aim to characterize the disk component(s) above 3 keV, i.e., without any bias from the soft excess contribution. This has been already investigated in Paper II, but here more general relativistic reflection configurations are probed (e.g, non-solar iron abundance, free inclination angle).
We use the baseline reflection model defined as tbnew[relxill+3zgaussians(BLR)]. The photon index (), the reflection fraction (), and the normalization () of the underlying continuum of the relativistic reflection component are allowed to vary between each observation. The high-energy cut-off () is fixed to 1000 keV since it cannot be constrained from the pn energy range.
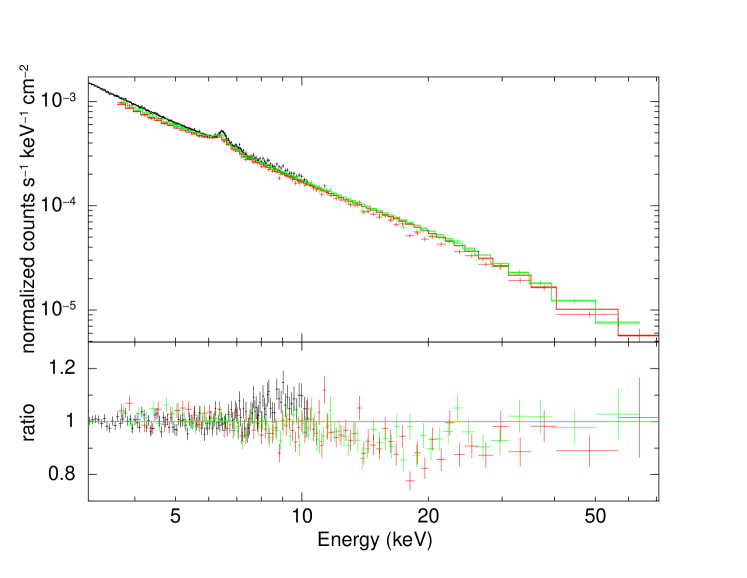
We first consider a coronal geometry assuming a single power-law disk emissivity index (), tied between the four observations, and fixing the inner radius of the reflection component () at the innermost stable circular orbit (ISCO) which is self consistently determined from the spin value in the relxill models. We find a good fit (d.o.f.=4461.7/4568) and infer a very flat emissivity index of 1.1 (see Table 2). The photon indices (1.85–1.92) are typical of what is found in type-1 AGN (e.g., Porquet et al. 2004; Piconcelli et al. 2005). The extrapolation of the fit down to 0.3 keV shows that the soft excess is not accounted for by this model, which leaves a large positive residual below 2 keV (Fig. 2). If, instead, we fix the disk emissivity index to the standard value of 3, the spin value to 0, and allow (expressed in RISCO units) to vary, we also find a good fit in the 3–10 keV energy range and derive = 17.8 (see Table 2). If we fix the spin value to the maximal ones, we find 56 and =11.9 , for a=0.998 and a=0.998, respectively. This suggests that whatever the spin value is, the reflection component does not arise in the very inner part of the accretion disk, in agreement with the results discussed in Paper II. The extrapolation of the fit down to 0.3 keV shows that the soft excess is not accounted for, with a similarly large positive residual. The reflection fraction is found to be rather low, with =0.4–0.5 in both cases.
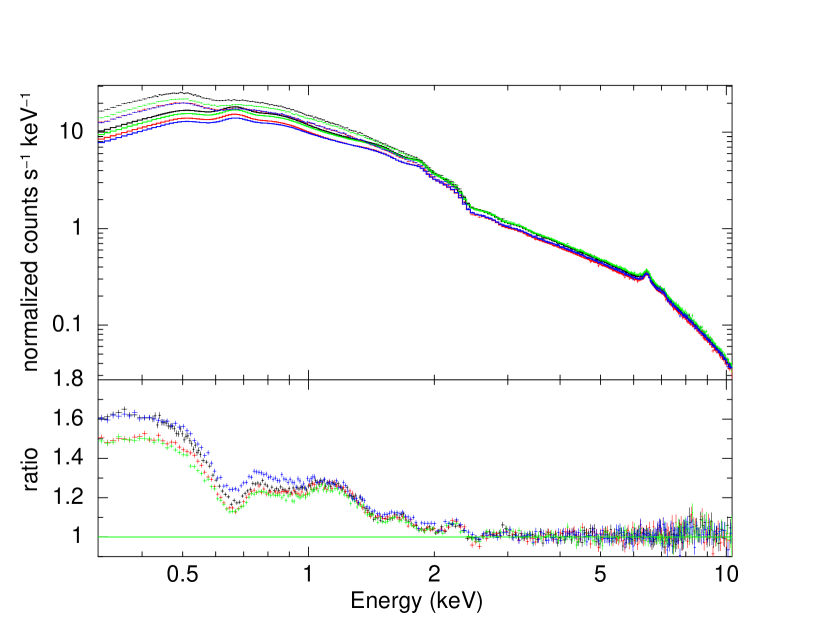 |
Then we adopt a lamppost geometry555The “lamppost” model represents a X-ray source geometry in AGN, where the primary source of radiation is modelled by a point source on the rotational axis of the black hole. using the relxilllp model. The reflection fraction is calculated directly from the lamppost geometry with the parameter fixReflFrac fixed to 1. We find that the height of the X-ray source above the accretion disk is rather high (=93 , see Table 2). This suggests that the disk illumination is not centrally concentrated. As for the coronal geometry, a strong positive residual is found below 3 keV when the best fit is extrapolated down to 0.3 keV.
To summarize, good fits are found using a combination of a primary power law and a relativistic reflection component when considering the 3–10 keV energy range, but they indicate that reflection does not arise in the very inner part of the accretion disk (flat disk emissivity index, large or ), and has a moderate reflection fraction of about 0.4–0.5 (coronal geometry). These results are similar to those found in Paper II. Moreover, in all cases the soft excess is not accounted for, meaning that the soft excess may originate from another physical process.
3.2 Investigation of relativistic reflection modelling over the 0.3–10 keV energy range
We now consider the full 0.3–10 keV energy range to investigate whether reflection models can after all reproduce both the soft excess and the hard X-ray emission up to 10 keV.
We use model , but here we allow for a broken
power-law disk emissivity index (, , and ).
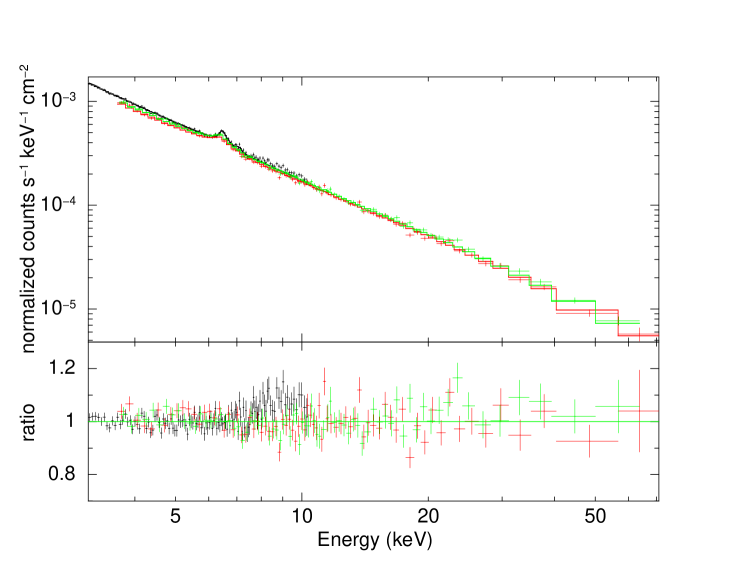
We find a good fit statistic (/d.o.f.=7246.6/6728,
= 1.08) over the 0.3–10 keV energy range
(Fig. 3, top panel),
though there are positive residuals in the Fe K complex energy range
( = 1.16 when considering only the 6–7 keV energy range).
Since the fit is driven by the smooth soft X-ray emission, very high values for
the spin and the disk emissivity indices, with a low inclination angle, are
required to reproduce it (see Table 3).
Large values (7–10) for the reflection fraction are
required as well. This would correspond to a scenario of a compact corona
very close to the black hole, leading to strong gravitational
light bending (Fabian et al. 2012, but see Dovciak & Done 2015).
Moreover the primary photon index needed to reproduce the soft X-ray
excess is much steeper (2.4) than that associated to the Fe K
features when fitting above 3 keV (1.9).
These extreme parameters are incompatible with those found to reproduce the
3–10 keV spectra (see Table 2).
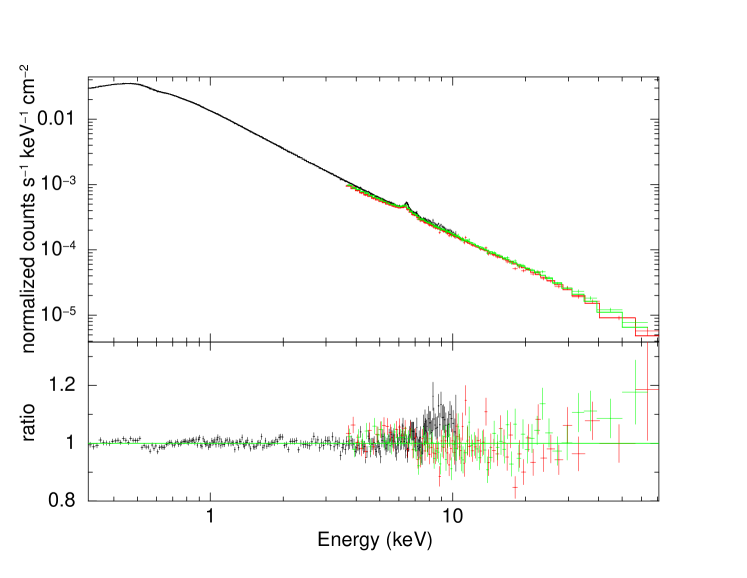
Moreover, as shown in Figure 3 (top panel), there are still positive residuals with moderately broad line profiles from about 6–6.3keV (red wing) and 6.6–6.9 keV (blue wing) in all the four spectra (AGN rest-frame), which cannot be reproduced by the extreme and very fine-tuned parameter values required to reproduce the smooth soft excess. The two emission features correspond to the red and blue Fe K features reported in Paper II, where the energy–time map showed that they both arise from the accretion disk. We therefore add two relativistic line components (relline, Dauser et al. 2013) that enable us to model these features for a small inclination angle666We notice that we find similar results considering a single relativistic line, but in such case a larger inclination angle of about 30 degrees is required (see Paper II, and Table 2). as found for the soft excess (see Table 2). The inclination angle and the spin values are linked to those of the broadband blurred reflection component, but we allow the disk emissivity index to vary ( is fixed to the ISCO). We find a statistical improvement of the fit compared to the baseline model (238 for five additional parameters). We infer line energies of 6.470.01 keV and 6.76 keV, and a disk emissivity index of 1.6, much flatter than the ones found for the baseline reflection model , i.e., 7.50.5 and 4.50.4 for the 2014 March 18 observation (similar values are found for the three other sequences). If, instead, we force the disk emissivity index to be the same of the blurred component and allow the inner radius to vary, we also find a good fit (240 for five additional parameters) with =25.7 and line energies777(p) means that the value is pegged at the maximum or minimum ones allowed by the model. of 6.45 keV and 6.97 keV. Hence, in both cases, a flat disk emissivity index (1.6) or a large inner radius (25 ) are in conflict with the values required to account for the soft excess. This implies that this reflection model cannot self-consistently produce both the soft excess and the mildly relativistic Fe K line(s). We also notice that, in order to reproduce these Fe K features by means of another broadband reflection component (relxill), not only (or ) and the disk inclination must be untied, but also the value, which must be much harder, i.e. below about 1.9.
 |
 |
So it is worth investigating whether these accretion disk features (soft excess and Fe K residuals) can originate from a more complex disk emissivity shape such as a twice broken power-law, which allows for an intermediate region with a flat emissivity index as could be found for a co-rotating continuum point source or an extended corona (see Figure 7 in Wilkins & Fabian 2012). However, even with this reflection model we cannot simultaneously reproduce these emission features. A disk ionization gradient (log ) does not work either. The inferred parameters for these fits are reported in Table 8. Then, we test a lamppost geometry, but a less good fit is found compared to the extended corona model (relxill), and significant residuals near 6.35 keV and 6.7 keV are still present and cannot be removed by allowing for an ionization gradient (assuming an accretion disk or a powerlaw density profile (density )). See Table 8 for the inferred fit parameters.
In conclusion, these high S/N spectra of Ark 120 show that relativistic reflection models from a constant-density, geometrically flat accretion disk, while leading to reasonable value over 0.3–10 keV, are physically unsatisfactory, since they cannot simultaneously account for both the soft excess and the Fe K lines. Note that such residual Fe K features could have been missed or readily neglected in lower S/N spectra, thus leading to an interpretation of a relativistic reflection-dominated spectrum, with rather extreme and tuned parameters in terms of spin and emissivity.
| Parameters | relxill | relxilllp |
|---|---|---|
| (1021 cm-2) | 1.090.02 | 1.000.01 |
| 0.965 | 0.968 | |
| (degrees) | 6.7 | 5.9 |
| log (erg cm s-1) | 0.1 | 0.1 |
| 0.5 | 0.5 | |
| 2014 March 18 | ||
| 2.480.02 | 2.370.01 | |
| 10.8 | ||
| 2.010-4 | 1.510-2 | |
| 7.4 | ||
| 4.80.5 | ||
| () | 3.8 | |
| () | 1.80.1 | |
| 2014 March 20 | ||
| 2.370.02 | 2.290.01 | |
| 7.50.7 | ||
| 1.710-4 | 1.010-2 | |
| 6.8 | ||
| 3.4 | ||
| () | 5.2 | |
| () | 1.90.1 | |
| 2014 March 22 | ||
| 2.380.02 | 2.270.01 | |
| 8.3 | ||
| 1.910-4 | 1.010-2 | |
| 7.6 | ||
| 5.00.5 | ||
| () | 3.4 | |
| () | 1.90.1 | |
| 2014 March 24 | ||
| 2.370.02 | 2.270.01 | |
| 8.2 | ||
| 1.710-4 | 1.010-2 | |
| 8.1 | ||
| 4.3 | ||
| () | 3.6 | |
| () | 1.8 | |
| /d.o.f. | 7246.6/6728 | 7507.4/6740 |
| 1.08 | 1.11 | |
3.3 Comptonization process as the origin of the soft excess
| Parameters | model | + 1 relline |
|---|---|---|
| (1021 cm-2) | 1.060.01 | 1.070.01 |
| 3(f) | ||
| () | 45.3 | |
| nc | ||
| (degrees) | 30(f) | |
| (keV) | 6.52 | |
| norm (10-5) | 2.70.3 | |
| 2014 March 18 | ||
| (keV) | 0.84 | 0.87 |
| 6.6 | 6.3 | |
| 2.7 | 2.7 | |
| 1.78 | 1.790.03 | |
| (10-2) | 1.10.1 | 1.10.1 |
| 2014 March 20 | ||
| 0.650.09 | 0.69 | |
| 8.0 | 7.7 | |
| 2.10.3 | 2.00.3 | |
| 1.740.03 | 1.750.04 | |
| (10-3) | 9.1 | 9.2 |
| 2014 March 22 | ||
| 0.790.14 | 0.83 | |
| 7.1 | 6.8 | |
| 1.9 | 1.9 | |
| 1.74 | 1.75 | |
| (10-2) | 1.00.1 | 1.00.1 |
| 2014 March 24 | ||
| 0.63 | 0.68 | |
| 8.10.7 | 7.8 | |
| 2.10.3 | 2.0 | |
| 1.740.03 | 1.740.04 | |
| (10-3) | 9.5 | 9.40.7 |
| /d.o.f. | 7384.1/6735 | 7165.2/6732 |
| 1.10 | 1.06 | |
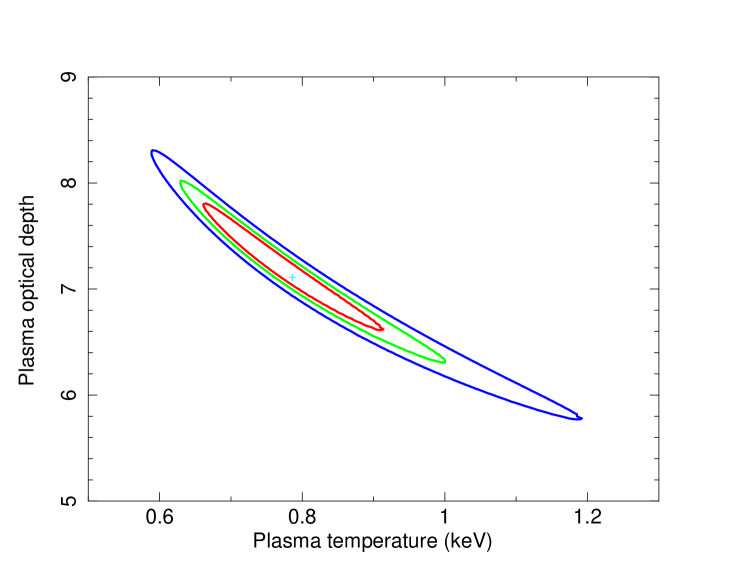
In this section, we assume that the soft X-ray excess originates from the Comptonization of seed photons from the accretion disk by warm electrons from the corona (here using comptt), as found by Matt et al. (2014) for the February 2013 observation. For this, we use the baseline model defined as tbnew[comptt+zpo+3zgaussians(BLR)]. The comptt model (Titarchuk 1994) is characterized by the input soft photon temperature (expressed in keV), the plasma temperature ( expressed in keV), the plasma optical depth () and the geometry assumed (disk, sphere, analytical approximation). We assume a disk geometry, and an input soft photon temperature888We would like to notice that the mean value of the input soft photon temperature (around 15 eV) has a negligible impact on the plasma temperature and optical depth values. of 15 eV according to the black hole mass and the mean accretion rate of Ark 120. The power-law component (zpo) is used to readily reproduce Comptonization by the hot electrons of the corona. We obtain an overall good fit with /d.o.f.=7384.1/6735 (=1.10) (see Table 4, column 2), except for the positive residuals at the Fe K complex energy range (see below and Fig. 4 top panel), as already found in the previous reflection-based models. We derive for the Comptonized plasma low temperature values of about 0.6–0.8 keV, and high optical depth values of about 7–8 for the four observations (see the mean values and their associated errors bars for each observation in Table 4). For illustration purpose, we display in Fig. 5 the 2D contour plot of the plasma temperature ( in keV) versus the plasma optical depth for the third XMM-Newton observation. The temperature value of the four observations seems to follow the soft excess strength, but the values between the four observations are consistent with each other within their errors bars. The primary photon indices of about 1.74–1.79 are much harder than those required to produce the soft excess from relativistic reflection modelling (2.4).
 |
 |
 |
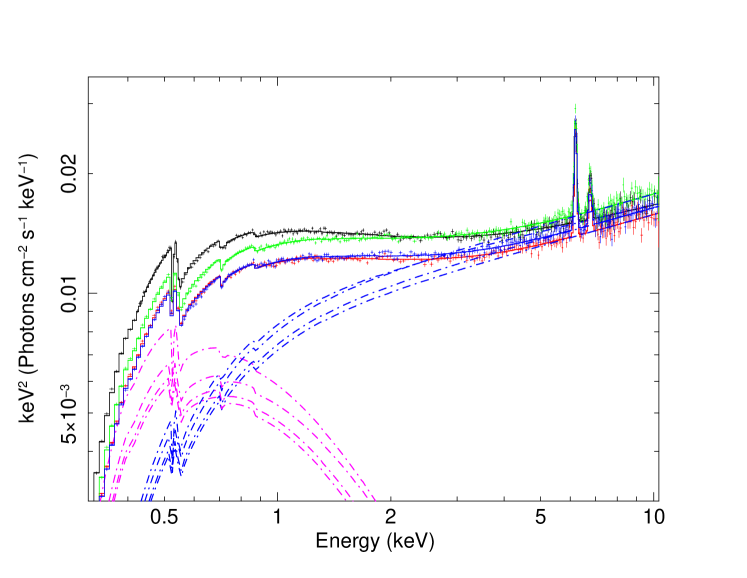
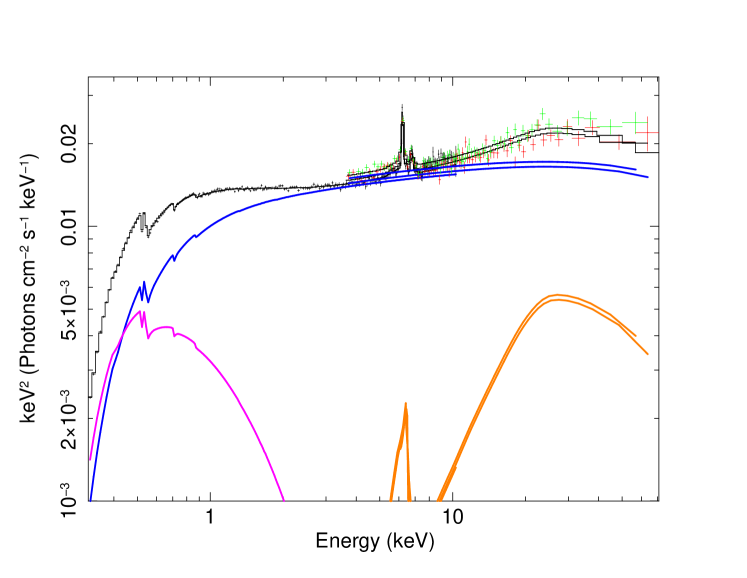
Not surprisingly with such a power-law continuum shape above 3 keV, the same red and blue components of Fe K residuals are still present. Indeed, they are known to be associated with the accretion disk (Paper II). Thanks to the high S/N of the present spectra and the ability to detect unambiguously these red and blue emission features, we are thus able to establish that even in this scenario, where the soft excess originates from Comptonization, a relativistic reflection component is still required. We therefore add a relativistic line profile (relline), fixing its emissivity index to the standard value of 3 and the inclination angle to 30 degrees (see Paper II). If is allowed to vary, then the fit is significantly improved (see Table 4, column 3), and =45.3 is inferred. The relative contribution of the different model components is displayed in Fig. 4 (unfolded spectrum for illustration purposes only; bottom panel), and shows that Comptonization of seed disk photons by warm electrons of the corona is the dominant process below about 0.8 keV.
In summary, the spectral analysis shows that Comptonization by a low temperature (0.6–0.8 keV) optically-thick (7–8) corona can reproduce well the soft excess below 1 keV. Above this energy, the power law component dominates the continuum, which may represent Comptonization by the hot electrons in a thin corona (e.g., Haardt & Maraschi 1993; Zdziarski et al. 1995). We note that a contribution from disc reflection originating at tens of is still required to account for a broad component of the FeK line, which was not the case for the low flux 2013 observation of Ark 120 (Matt et al. 2014).
4 Broad-band X-ray view of Ark 120 observed on 2014 March 22
 |
In this section, we investigate the simultaneous broadband XMM-Newton/pn and NuSTAR observations of Ark 120 performed on 2014 March 22.
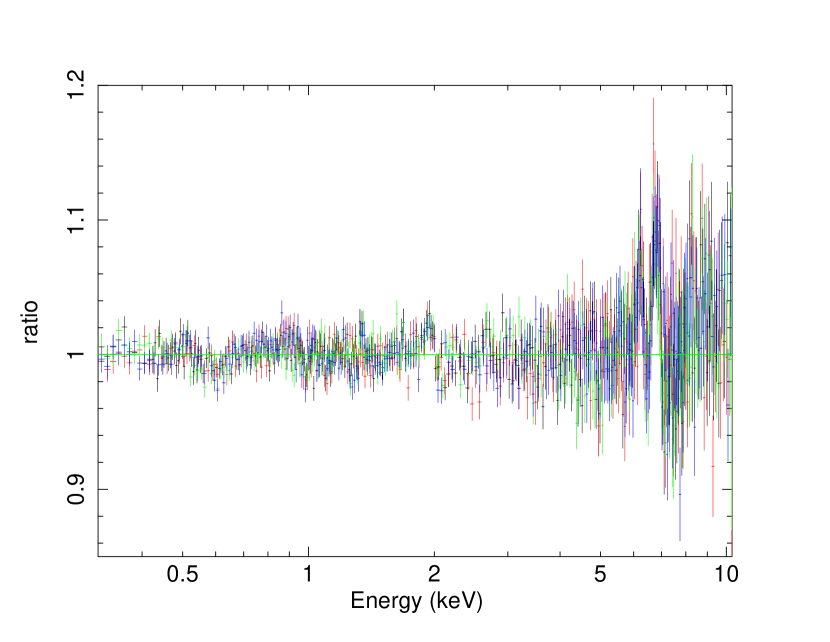
First, we investigate the two NuSTAR spectra (FPMA and FPMB) by fitting them using a simple absorbed power-law model in the 3–10 keV energy range excluding the 5.5–7.5 keV energy range. We fix the absorption column density to 9.781020 cm-2, and tie the power-law parameters between both NuSTAR spectra. We allow for possible cross-calibration uncertainties between these two NuSTAR spectra. The resulting data/model ratio extrapolated up to 79 keV is reported in Fig. 6, where a significant hard X-ray excess is present in addition to the prominent Fe K complex.
4.1 Investigation of the relativistic reflection scenario
4.1.1 Spectral analysis above 3 keV
| Parameters | relxill | |
|---|---|---|
| 3–10 keV | 3–79 keV | |
| 2.0 | 2.2 | |
| nc | 0.6 | |
| (degrees) | 25.6 | 21.9 |
| 1.91 | 1.86 | |
| log (erg cm s-1) | 2.8 | 2.7 |
| 0.8 | 3.3 | |
| (keV) | 1000 (f) | 364 |
| 0.6 | 0.30.1 | |
| norm (10-4) | 2.1 | 2.40.3 |
| C | 1.0300.009 | 1.0290.009 |
| C | 1.0700.010 | 1.0720.009 |
| /d.o.f. | 1207.6/1232 | 1497.7/1518 |
| 0.98 | 0.99 | |
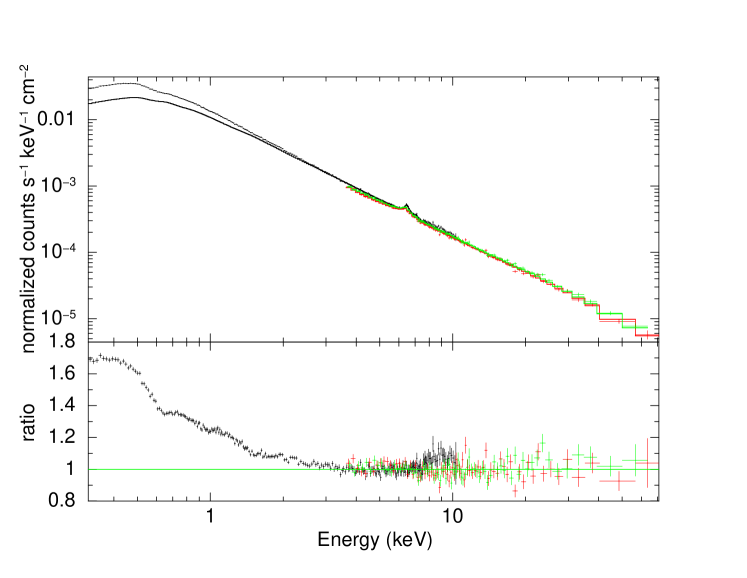
We start the simultaneous fit of the XMM-Newton/pn and of the two NuSTAR spectra in the 3–10 keV band using model . We allow for cross-calibration uncertainties between the two NuSTAR spectra and the XMM-Newton/pn spectrum by including in the fit a cross-normalization constant corresponding to C and C for NuSTAR FPMA and FPMB spectra, respectively (see values in Table 5), related to the XMM-Newton/pn spectrum. The absorption column density has been fixed to the Galactic one, i.e. 9.781020 cm-2. The fit parameters are similar (see Table 5, column 2) to those found when fitting simultaneously the four XMM-Newton/pn spectra over this energy range (see Table 2), showing a good match between XMM-Newton/pn and NuSTAR data. Only the inferred disk emissivity index is larger and the inclination angle is lower due to the lower spectral resolution of the NuSTAR camera which broadens the apparent Fe K profile. We then extrapolate this fit up to 79 keV, and find that the data/model ratio is rather good, although the model slightly overpredicts the emission in the 10–40 keV energy range (see Fig. 7, top panel). The /d.o.f. is 1698.1/1519 (=1.12) without any refitting. Now, we refit over the entire 3–79 keV energy range and find a very good fit (Fig. 7, bottom panel) with parameter values that are very similar to those found for the 3–10 keV energy range, except for the iron abundance which has increased from 0.8 to 3.3 in order to better adjust the 10–40 keV emission (see Table 5). We find an upper limit of 0.6 for the spin value (at 90% confidence level), but we note that after the calculation of a 2D contour plot of the spin versus the inclination angle, the spin is actually unconstrained at the 90% confidence level. A power-law photon index of about 1.86 represents well the underlying continuum over the 3–79 keV energy range. This value is softer than that found for the 2013 observation (1.73), when the source was in a low-flux state (Matt et al. 2014). Adding the possible contribution from a molecular torus999For this, we use the unblurred reflection xillver model fixing log to zero. The inclination of the blurred and unblurred reflection components, as well as their cut-off energies, are tied together, and solar iron abundance for the unblurred reflection component is assumed. does not improve the fit at all.
As illustrated in Fig. 8 (top panel), the
extrapolation of the XMM-Newton/pn spectrum down
to 0.3 keV shows that this model is not able to account for the
soft X-ray excess, as might be expected given that the best fit
is characterized by similar parameters as when considering the
3–10 keV band alone.
 |
 |
 |
 |
4.1.2 Spectral analysis over the 0.3–79 keV energy range
First, we note that, if we try to reproduce the hard X-ray excess with a contribution from the torus using xillver,101010Same results are found if, instead of xillver, we use mytorus (Murphy & Yaqoob 2009) or pexmon (Nandra et al. 2007). then the normalization of the Fe K line emitted by the BLR is consistent with 0. This, is at odds with analysis of the Chandra/HETG spectra, where the narrow profile is resolved with a width compatible with the BLR (Paper II). We can therefore conclude, from both the 3–79 keV and 0.3–79 keV analysis, that any contribution from the torus is not significant, and is not considered from now on. However, we checked that the following results do not depend on the modeling of the narrow Fe K core either from the BLR (as established) in paper II or by the common modeling of a molecular torus.
| 0.3–79 keV | ||
| Parameters | relxill | relxilllp |
| (1021 cm-2) | 0.930.01 | 0.930.02 |
| 8.3 | ||
| 3.00.2 | ||
| () | 2.60.2 | |
| () | 2.20.1 | |
| 0.989 | 0.993 | |
| (degrees) | 34.2 | 35.0 |
| 2.220.01 | 2.210.01 | |
| log (erg cm s-1) | 0.1 | 0.1 |
| 1.20.3 | 1.20.2 | |
| (keV) | 956 | 801 |
| 4.1 | ||
| norm | 1.90.110-4 | 3.810-3 |
| C | 1.0310.008 | 1.0260.009 |
| C | 1.0750.009 | 1.0700.009 |
| /d.o.f. | 2483.2/2058 | 2585.3/2061 |
| 1.21 | 1.25 | |
Using model (and allowing for a single broken power-law emissivity index), we are able to find a satisfactory fit only up to 30 keV, with the parameters reported in Table 6 (/d.o.f.=2483.2/2058, =1.21). Indeed, as shown in Figure 8 (bottom panel), above this energy there is a significant hard X-ray excess. Of course, as for the four XMM-Newton/pn spectra, there are still residuals present at Fe K, but these appear less apparent on the model/ratio plot due to the very significant positive residual observed above about 30 keV. As also found for the 0.3–10 keV spectral analysis, a large reflection fraction and a very steep disk emissivity shape (8 or 2 ) are required, as well as a very high (and strongly fine-tuned) value for the spin. Moreover, the inferred photon index is significantly steeper (2.2) than that found considering only data above 3 keV (i.e., 1.9) explaining the presence of the hard X-ray excess residual seen above about 30 keV. We also notice that this hard X-ray excess residual cannot be accounted for by any other alternative relxill models (i.e., the ones tested in 3.2). The lamppost geometrical configuration leads to the worst fit of the data (see Table 6) We check whether such unsatisfactory fits are due to the specific model components and assumptions, still using the baseline model by alternatively:
-
•
Allowing the primary photon index of the NuSTAR spectra to be different from that of the XMM-Newton/pn spectrum in order to compensate for any possible calibration issues.
- •
-
•
Allowing the incident continuum of the relativistic component to be different from the direct, observed one (see appendix C.1 for details)
-
•
Assuming a larger accretion disk density of 1019 cm-3 (see appendix C.2 for details)
Yet, none of these reflected dominated scenarios allows us to account
simultaneously for the 3 main components (soft excess, broad
Fe K lines and Compton hump),
or to obtain physically meaningful fit results.
Furthermore, limiting the analysis to one or another energy range
would lead to erroneous results on the physical condition of the
disk/corona system (see a comparison of Table 5
and Table 6).
To summarize, during this 2014 observational campaign of Ark 120, we can safely rule out relativistic reflection as the origin of both the soft and hard X-ray excesses, and the red/blue relativistic Fe K features.
4.2 Model combining Comptonization and relativistic reflection
Here we investigate if a combination of soft and hard Comptonization and mildly relativistic reflection can explain the whole 0.3–79 keV continuum shape, as found for the four XMM-Newton/pn spectra. To do this, we use model defined as tbnew[comptt+cut-off PL+relxill+3zgaussians(BLR)].
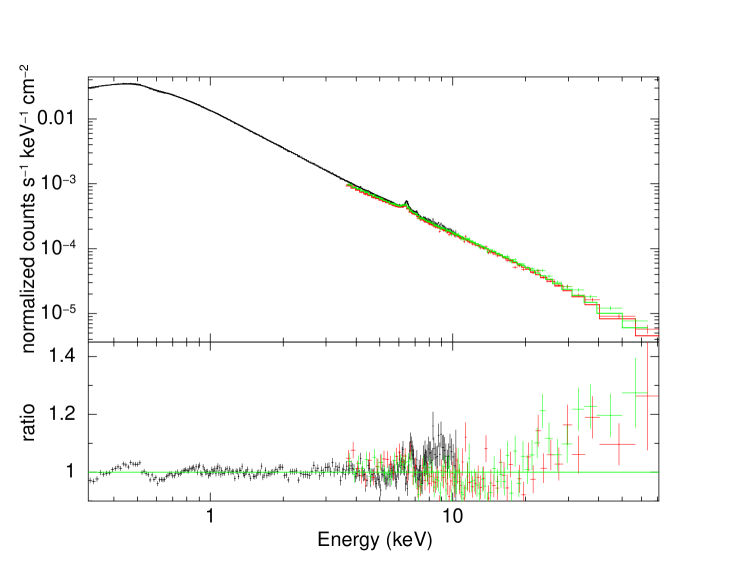
The cut-off power-law component is used here in order to merely parametrize Comptonization from hot electrons of the thin corona. This continuum shape is also the one used as underlying hard X-ray continuum for the relativistic reflection component. Since the mildly relativistic Fe K component(s) do not appear to be formed in the very inner part of the accretion disk, as found previously in this work (see also Paper II), we allow to vary and fix the emissivity index to 3. We find a good fit (/d.o.f.=2197.6/2058, =1.07), as illustrated in Fig. 9 (top panel). The inferred fit parameters are reported in Table 12. We notice that the excess found above about 8 keV in the residuals for the pn spectrum is likely due to calibration issue between pn spectrum using the small window mode and the NuSTAR spectra, and is particularly prominent for high S/N pn spectrum111111We note that this pn excess above 8 keV (when fitting simultaneous NuSTAR spectra) is present even with the latest SAS version (16.0.0) and calibrations available in April 2017.. However, removing pn data above 8 keV leads to compatible fit parameters within their error bars (except for =1.91, the discrepancy, however, is marginal), with /d.o.f.=1972.9/1876 (=1.05).
We confirm that the Comptonizing plasma responsible for the soft excess has a low temperature (0.5 keV) and a high optical depth (9). Another interesting result is that during this 2014 observation, the source spectrum above 3 keV shows a softer power-law index (1.87) compared to the 2013 one (1.73; Matt et al. 2014), in agreement with the recent study based on the Swift monitoring of Ark 120, which suggests that the source has a “steeper when brighter” behaviour (Gliozzi et al. 2017, see also Paper III). The value of of 25.5 is much larger than the innermost stable orbit even for a maximal retrograde spin of the black hole, i.e a=0.998. This is another hint that the observed Fe K lines are not formed in the very inner part of the accretion disk.
The relative contribution of the different model components is displayed in Fig. 9 (unfolded spectrum for illustration purposes only; bottom panel), and shows that the Comptonization process (including both warm and hot electrons of the corona) is the dominant one over the broadband X-ray range.
 |
 |
| Parameters | model |
|---|---|
| (1021 cm-2) | 1.040.03 |
| (keV) | 0.48 |
| 9.00.7 | |
| 2.9 | |
| 1.870.02 | |
| (keV) | 183 |
| 1.20.110-2 | |
| nc | |
| (degrees) | 30(f) |
| 1(f) | |
| () | 25.5 |
| log (erg cm s-1) | 0.1 |
| 0.3 | |
| 1.910-4 | |
| C | 1.0280.009 |
| C | 1.0710.009 |
| L(a) (0.3–2 keV) | 1.41044 |
| L(a) (2–10 keV) | 1.01044 |
| L(a) (10–79 keV) | 1.61044 |
| /d.o.f. | 2197.6/2058 |
| 1.07 |
5 Summary
This paper is the fourth of a series of articles reporting on the
study of an extensive X-ray (and also optical and UV) observational
campaign of a bare AGN, targeting Ark 120.
Here, we first performed the simultaneous spectral analysis of the
four 120 ks XMM-Newton/pn spectra obtained in March 2014, and then we analysed the
broadband X-ray spectrum – combining pn and
NuSTAR spectra – obtained on 2014 March 22.
The main results are summarized below:
(i) The four XMM-Newton observations of Ark 120 in 2014 reveal both a strong
and variable soft excess and complex Fe K emission. Above 3 keV,
both the continuum (with 1.9) and the iron-line complex are similar
with limited variability between the XMM-Newton sequences.
(ii) Above 3 keV, the four 2014 pn spectra can be well fitted with a
disk reflection (relxill) model with moderate reflection fraction
(0.4–0.5), which requires a flat emissivity
profile or a large height of the X-ray source above the disk. Both of
these interpretations suggest that the disk reflection emission originates
much further away than the ISCO, at typical radii of tens of .
(iii) The extrapolation of the above reflection models leaves strong residuals
due to the soft excess below 3 keV. To account for this, the
reflection models tend to extreme, finely tuned values requiring a high
degree of blurring and nearly maximal black hole spin, plus a steep (2.4)
continuum. However, such models produce a very smooth broadband spectrum, and do
not account for the red/blue wings of the Fe K line, which
require a flat emissivity index (or large ) and a harder
continuum (1.9).
(iv) Likewise, when a reflection dominated model is applied to the
2014 NuSTAR data above 10 keV, simultaneous with the third XMM-Newton observation,
it cannot fit the spectrum in the highest energy range, leaving a large excess of
residual emission above 30 keV. Hence,
reflection-only models from a constant-density, geometrically flat accretion disk
cannot simultaneously account for the soft excess, iron line and hard
excess in the broadband 0.3–79 keV spectrum.
(v) Instead, the X-ray broadband spectrum can be readily accounted for by a Comptonization model, whereby the soft and hard continuum components arise from a two temperature (warm, hot) disk corona. The warm part of the corona (0.5 keV) produces the low energy part of the soft X-ray excess and is optically thick (9). A disk reflection component is still required, but it is less strong and originates at tens of gravitational radii from the ISCO of the black hole.
6 Discussion and conclusion
During this extensive X-ray observational campaign of the bare AGN Ark 120,
carried out in March 2014, the source was caught in a high flux state similar to the
2003 XMM-Newton observation (Vaughan et al. 2004), and about as
bright as the 2013 low-flux observation (Matt et al. 2014).
Based on the long-term Swift monitoring of Ark 120 (Gliozzi et al. 2017, Paper III),
this large XMM-Newton program and the 2013 observation cover the
typical high- to low-flux range observed in this source.
Our spectral analysis
confirms the “softer when brighter” behaviour of Ark 120
(Gliozzi et al. 2017), as commonly found in AGN
(e.g., Markowitz et al. 2003; Porquet et al. 2004; Sobolewska & Papadakis 2009; Soldi et al. 2014; Connolly et al. 2016; Ursini et al. 2016)
and black-hole binaries systems
(e.g., Remillard & McClintock 2006; Done et al. 2007; Wu & Gu 2008; Dong et al. 2014) with accretion rates
above 0.01.
From the analysis of the four XMM-Newton/pn spectra (2014 March 18–24) and the March 22 XMM-Newton and NuSTAR observations, we find that relativistic reflection models from a constant-density, geometrically flat accretion disk cannot self-consistently reproduce the soft excess, the mildly relativistic red and blue Fe K features, and the hard X-ray excess. We note that this shortcoming with relativistic reflection models is found in all four 120 ks XMM-Newton/pn spectra separately, thanks to the high-S/N spectra that can be obtained for a bright source like Ark 120. In order to form the large, smooth soft X-ray excess, extreme and tuned parameters are found for the “pure” relativistic reflection scenario: a maximally rotating black hole (0.998), a very centrally peaked disk emissivity, a soft primary photon index (2.4), and a very large reflection fraction (10), as reported in Table 8. By contrast, the red/blue Fe K features require just a moderate reflection fraction (0.3), a flat emissivity index (1.6) or large (a few tens of ), and a harder power-law index (1.9). The former case (reflection-dominated soft X-ray excess) would correspond to a compact corona located very close to the black hole, while the latter case (disk origin of the Fe K features) would correspond to an extended corona or a lamppost geometry with a large height of the X-ray source above the disk. Both conditions cannot be therefore explained
Instead, the whole 0.3–79 keV spectrum can be readily explained by a
combination of Comptonization (dominating process) of the
thermal optical-UV seed photons from the accretion disk by a warm
(0.5 keV) optically thick plasma (9) below
about 0.5 keV, by a hot optically thin corona above 0.5 keV,
and mildly relativistic reflection at a few 10 .
As shown in Różańska et al. (2015), such a high optical
depth of the warm corona could mean that either a strong magnetic
field or vertical outflows to stabilize the system are required.
The in-depth investigation of
the physical properties of the warm and hot corona will be performed in a
forthcoming paper (Tortosa et al. in preparation).
Interestingly, such a soft X-ray excess origin (i.e., enabling to rule out a
relativistic reflection scenario too) is similar to that found, for example, in
some non-bare AGN
like Mrk 509 (Mehdipour et al. 2011; Petrucci et al. 2013; Boissay et al. 2014) and
NGC 5548 (Mehdipour et al. 2015), from deep X-ray (and multi-wavelength)
observational campaigns. Such an origin has also been found for the lower-mass SMBH
AGN NGC 4593, from high-energy monitoring with XMM-Newton and NuSTAR (Ursini et al. 2016).
Contrary to the 2013 observation, a relativistic reflection component is still required to
explain part of the Fe K complex.
This could be the signature that the optically
thick corona is hiding partly or totally the inner accretion disk, as
proposed by Matt et al. (2014) to explain the X-ray characteristics of the
2013 observation, which is a factor of 2 lower in hard X-ray flux and
does not appear to show a broad Fe K line component.
In March 2014, the optically thick part of the corona may
have been less extended and/or have displayed a lower covering factor,
allowing us to detect a larger part of the relativistic reflection emission.
For example, as demonstrated by Wilkins & Gallo (2015), for a covering factor below about
85%, the blurred reflection features become more detectable. Moreover, a
Comptonizing corona that covers the inner regions of the accretion disk can
have substantial impact on the observed reflection spectrum
(Petrucci et al. 2001; Wilkins & Gallo 2015; Steiner et al. 2017).
Furthermore, if the corona covers a sufficient fraction of the inner
accretion disk so as to Comptonize the reflected emission, a low
reflection fraction can be measured, as found during these March 2014
observations (0.3). This could support the presence
of an extended corona in this object.
The case of a receding, full covering corona between February
2013 and March 2014 will be investigated through the fitting of the
spectral energy distribution from optical/UV to hard-X-rays in a
forthcoming paper (Porquet et al., in preparation). The alternative scenario
of a patchy corona will be tested in a future work too (Wilkins et
al. in preparation).
In conclusion, the great advantage of a source like Ark 120 is that
its “bare” properties remove any
fit degeneracy with warm absorption contributions. Thanks to both
XMM-Newton (4120 ks) and
NuSTAR (65 ks), we are able to discriminate between Comptonization
and relativistic reflection for the soft X-ray excess origin, as
well as emission above about 2 keV.
As revealed in paper I thanks to
the very deep 2014 RGS spectrum, a substantial amount of X-ray
emitting warm gas is present out of the direct line of sight.
The presence of this warm gas (warm absorber) is seen in a very large
amount of type I AGN (e.g., Porquet et al. 2004; Piconcelli et al. 2005; Blustin et al. 2005) via
mainly absorption lines, but also via emission lines
(e.g., Bianchi & Matt 2002; Nucita et al. 2010; Wang et al. 2011; Ebrero et al. 2011; Reeves et al. 2013).
Such result demonstrates that Ark 120 is not a peculiar
source but merely a source where the line-of-sight does not intercept
the warm gas, and then broadly fits into the AGN unified scheme.
Therefore, since Ark 120 has typical AGN properties, such as mass and
accretion rate, it can be used as a prototype to perform an in-depth
study of the X-ray corona and of its physical and geometrical properties over time,
and of its possible impact on reflection spectra.
Acknowledgements.
The authors would like to deeply thank the anonymous referee for useful and constructive comments. Based on observations obtained with the XMM-Newton, and ESA science mission with instruments and contributions directly funded by ESA member states and the USA (NASA). This work made use of data from the NuSTAR mission, a project led by the California Institute of Technology, managed by the Jet Propulsion Laboratory, and funded by NASA. This research has made use of the NuSTAR Data Analysis Software (NuSTARDAS) jointly developed by the ASI Science Data Center and the California Institute of Technology. D.P. would like to acknowledge financial support from the French “Programme National Hautes Energies” (PNHE). Part of the work was supported by the European Union Seventh Framework Program under the grant agreement No. 312789 (DP, GM, AM, AF). JNR acknowledges financial support via Chandra grant number GO4-15092X and NASA grant NNX15AF12G. JNR and AL also acknowledge support of the STFC, via the consolidated grant ST/M001040/1. GM, AM, AT and FU acknowledge financial support from Italian Space Agency under grant ASI/INAF I/037/12/0-011/13. E.N. acknowledges funding from the European Union’s Horizon 2020 research and innovation programme under the Marie Sklodowska-Curie grant agreement No. 664931.References
- Antonucci (1993) Antonucci, R. 1993, ARA&A, 31, 473
- Arnaud (1996) Arnaud, K. A. 1996, in ASP Conf. Ser. 101: Astronomical Data Analysis Software and Systems V, ed. G. H. Jacoby & J. Barnes, 17
- Bianchi & Matt (2002) Bianchi, S. & Matt, G. 2002, A&A, 387, 76
- Blustin et al. (2005) Blustin, A. J., Page, M. J., Fuerst, S. V., Branduardi-Raymont, G., & Ashton, C. E. 2005, A&A, 431, 111
- Boissay et al. (2014) Boissay, R., Paltani, S., Ponti, G., et al. 2014, A&A, 567, A44
- Brenneman & Reynolds (2009) Brenneman, L. W. & Reynolds, C. S. 2009, ApJ, 702, 1367
- Connolly et al. (2016) Connolly, S. D., McHardy, I. M., Skipper, C. J., & Emmanoulopoulos, D. 2016, MNRAS, 459, 3963
- Crenshaw et al. (1999) Crenshaw, D. M., Kraemer, S. B., Boggess, A., et al. 1999, ApJ, 516, 750
- Crummy et al. (2006) Crummy, J., Fabian, A. C., Gallo, L., & Ross, R. R. 2006, MNRAS, 365, 1067
- Czerny & Elvis (1987) Czerny, B. & Elvis, M. 1987, ApJ, 321, 305
- Dauser et al. (2014) Dauser, T., García, J., Parker, M. L., Fabian, A. C., & Wilms, J. 2014, MNRAS, 444, L100
- Dauser et al. (2016) Dauser, T., García, J., Walton, D. J., et al. 2016, A&A, 590, A76
- Dauser et al. (2013) Dauser, T., Garcia, J., Wilms, J., et al. 2013, MNRAS, 430, 1694
- Dauser et al. (2010) Dauser, T., Wilms, J., Reynolds, C. S., & Brenneman, L. W. 2010, MNRAS, 409, 1534
- Done et al. (2012) Done, C., Davis, S. W., Jin, C., Blaes, O., & Ward, M. 2012, MNRAS, 2196
- Done et al. (2007) Done, C., Gierliński, M., & Kubota, A. 2007, A&A Rev., 15, 1
- Dong et al. (2014) Dong, A.-J., Wu, Q., & Cao, X.-F. 2014, ApJ, 787, L20
- Dovciak & Done (2015) Dovciak, M. & Done, C. 2015, in The Extremes of Black Hole Accretion, 26
- Dovčiak et al. (2004) Dovčiak, M., Karas, V., & Yaqoob, T. 2004, ApJS, 153, 205
- Ebrero et al. (2011) Ebrero, J., Kriss, G. A., Kaastra, J. S., et al. 2011, A&A, 534, A40
- Fabian et al. (2002) Fabian, A. C., Vaughan, S., Nandra, K., et al. 2002, MNRAS, 335, L1
- Fabian et al. (2012) Fabian, A. C., Zoghbi, A., Wilkins, D., et al. 2012, MNRAS, 419, 116
- Fürst et al. (2015) Fürst, F., Nowak, M. A., Tomsick, J. A., et al. 2015, ApJ, 808, 122
- García et al. (2014) García, J., Dauser, T., Lohfink, A., et al. 2014, ApJ, 782, 76
- García et al. (2013) García, J., Dauser, T., Reynolds, C. S., et al. 2013, ApJ, 768, 146
- Garcia & Kallman (2010) Garcia, J. & Kallman, T. R. 2010, ApJ, 718, 695
- García et al. (2011) García, J., Kallman, T. R., & Mushotzky, R. F. 2011, ApJ, 731, 131
- García et al. (2016) García, J. A., Fabian, A. C., Kallman, T. R., et al. 2016, MNRAS, 462, 751
- Gierliński & Done (2004) Gierliński, M. & Done, C. 2004, MNRAS, 349, L7
- Gliozzi et al. (2017) Gliozzi, M., Papadakis, I. E., Grupe, D., Brinkmann, W. P., & Räth, C. 2017, MNRAS, 464, 3955
- Grevesse & Sauval (1998) Grevesse, N. & Sauval, A. J. 1998, Space Sci. Rev., 85, 161
- Haardt & Maraschi (1993) Haardt, F. & Maraschi, L. 1993, ApJ, 413, 507
- Harrison et al. (2013) Harrison, F. A., Craig, W. W., Christensen, F. E., et al. 2013, ApJ, 770, 103
- Kalberla et al. (2005) Kalberla, P. M. W., Burton, W. B., Hartmann, D., et al. 2005, A&A, 440, 775
- Lobban et al. (2017) Lobban, A., Porquet, D., Reeves, J., et al. 2017, ArXiv e-prints:1707.05536
- Marinucci et al. (2014) Marinucci, A., Matt, G., Miniutti, G., et al. 2014, ApJ, 787, 83
- Markowitz et al. (2003) Markowitz, A., Edelson, R., & Vaughan, S. 2003, ApJ, 598, 935
- Matt et al. (2014) Matt, G., Marinucci, A., Guainazzi, M., et al. 2014, MNRAS, 439, 3016
- Mehdipour et al. (2011) Mehdipour, M., Branduardi-Raymont, G., Kaastra, J. S., et al. 2011, A&A, 534, A39
- Mehdipour et al. (2015) Mehdipour, M., Kaastra, J. S., Kriss, G. A., et al. 2015, A&A, 575, A22
- Murphy & Yaqoob (2009) Murphy, K. D. & Yaqoob, T. 2009, MNRAS, 397, 1549
- Nandra et al. (2007) Nandra, K., O’Neill, P. M., George, I. M., & Reeves, J. N. 2007, MNRAS, 382, 194
- Nardini et al. (2011) Nardini, E., Fabian, A. C., Reis, R. C., & Walton, D. J. 2011, MNRAS, 410, 1251
- Nardini et al. (2016) Nardini, E., Porquet, D., Reeves, J. N., et al. 2016, ApJ, 832, 45
- Noda et al. (2011) Noda, H., Makishima, K., Yamada, S., et al. 2011, PASJ, 63, S925
- Nucita et al. (2010) Nucita, A. A., Guainazzi, M., Longinotti, A. L., et al. 2010, A&A, 515, A47
- Palmeri et al. (2003) Palmeri, P., Mendoza, C., Kallman, T. R., Bautista, M. A., & Meléndez, M. 2003, A&A, 410, 359
- Parker et al. (2014) Parker, M. L., Wilkins, D. R., Fabian, A. C., et al. 2014, MNRAS, 443, 1723
- Patrick et al. (2012) Patrick, A. R., Reeves, J. N., Porquet, D., et al. 2012, MNRAS, 426, 2522
- Patrick et al. (2011) Patrick, A. R., Reeves, J. N., Porquet, D., et al. 2011, MNRAS, 411, 2353
- Peterson et al. (2004) Peterson, B. M., Ferrarese, L., Gilbert, K. M., et al. 2004, ApJ, 613, 682
- Petrucci et al. (2001) Petrucci, P. O., Merloni, A., Fabian, A., Haardt, F., & Gallo, E. 2001, MNRAS, 328, 501
- Petrucci et al. (2013) Petrucci, P.-O., Paltani, S., Malzac, J., et al. 2013, A&A, 549, A73
- Piconcelli et al. (2005) Piconcelli, E., Jimenez-Bailón, E., Guainazzi, M., et al. 2005, A&A, 432, 15
- Porquet et al. (2004) Porquet, D., Reeves, J. N., O’Brien, P., & Brinkmann, W. 2004, A&A, 422, 85
- Reeves et al. (2013) Reeves, J. N., Porquet, D., Braito, V., et al. 2013, ApJ, 776, 99
- Reeves et al. (2016) Reeves, J. N., Porquet, D., Braito, V., et al. 2016, ApJ, 828, 98
- Remillard & McClintock (2006) Remillard, R. A. & McClintock, J. E. 2006, ARA&A, 44, 49
- Reynolds (1997) Reynolds, C. S. 1997, MNRAS, 286, 513
- Reynolds et al. (2009) Reynolds, C. S., Fabian, A. C., Brenneman, L. W., et al. 2009, MNRAS, 397, L21
- Risaliti et al. (2013) Risaliti, G., Harrison, F. A., Madsen, K. K., et al. 2013, Nature, 494, 449
- Ross & Fabian (2005) Ross, R. R. & Fabian, A. C. 2005, MNRAS, 358, 211
- Różańska et al. (2015) Różańska, A., Malzac, J., Belmont, R., Czerny, B., & Petrucci, P.-O. 2015, A&A, 580, A77
- Schurch et al. (2009) Schurch, N. J., Done, C., & Proga, D. 2009, ApJ, 694, 1
- Shakura & Sunyaev (1973) Shakura, N. I. & Sunyaev, R. A. 1973, A&A, 24, 337
- Sobolewska & Papadakis (2009) Sobolewska, M. A. & Papadakis, I. E. 2009, MNRAS, 399, 1597
- Soldi et al. (2014) Soldi, S., Beckmann, V., Baumgartner, W. H., et al. 2014, A&A, 563, A57
- Steiner et al. (2017) Steiner, J. F., García, J. A., Eikmann, W., et al. 2017, ApJ, 836, 119
- Strüder et al. (2001) Strüder, L., Briel, U., Dennerl, K., et al. 2001, A&A, 365, L18
- Tanaka et al. (1995) Tanaka, Y., Nandra, K., Fabian, A. C., et al. 1995, Nature, 375, 659
- Titarchuk (1994) Titarchuk, L. 1994, ApJ, 434, 570
- Turner & Miller (2009) Turner, T. J. & Miller, L. 2009, A&A Rev., 17, 47
- Ursini et al. (2015) Ursini, F., Boissay, R., Petrucci, P.-O., et al. 2015, A&A, 577, A38
- Ursini et al. (2016) Ursini, F., Petrucci, P.-O., Matt, G., et al. 2016, MNRAS, 463, 382
- Vaughan et al. (2004) Vaughan, S., Fabian, A. C., Ballantyne, D. R., et al. 2004, MNRAS, 351, 193
- Verner et al. (1996) Verner, D. A., Ferland, G. J., Korista, K. T., & Yakovlev, D. G. 1996, ApJ, 465, 487
- Walton et al. (2014) Walton, D. J., Risaliti, G., Harrison, F. A., et al. 2014, ApJ, 788, 76
- Wandel et al. (1999) Wandel, A., Peterson, B. M., & Malkan, M. A. 1999, ApJ, 526, 579
- Wang et al. (2011) Wang, J., Fabbiano, G., Elvis, M., et al. 2011, ApJ, 742, 23
- Ward et al. (1987) Ward, M., Elvis, M., Fabbiano, G., et al. 1987, ApJ, 315, 74
- Wilkins & Fabian (2012) Wilkins, D. R. & Fabian, A. C. 2012, MNRAS, 424, 1284
- Wilkins & Gallo (2015) Wilkins, D. R. & Gallo, L. C. 2015, MNRAS, 448, 703
- Willingale et al. (2013) Willingale, R., Starling, R. L. C., Beardmore, A. P., Tanvir, N. R., & O’Brien, P. T. 2013, MNRAS, 431, 394
- Wilms et al. (2000) Wilms, J., Allen, A., & McCray, R. 2000, ApJ, 542, 914
- Wu & Gu (2008) Wu, Q. & Gu, M. 2008, ApJ, 682, 212
- Zdziarski et al. (1995) Zdziarski, A. A., Johnson, W. N., Done, C., Smith, D., & McNaron-Brown, K. 1995, ApJ, 438, L63
Appendix A Description of the relativistic reflection package relxill
A.1 Coronal geometry
The relxill models are characterized by the
following parameters:
the photon index of the illuminating radiation (identical for both the intrinsic
cut-off power law and the relativistic reflection spectrum): ;
the black hole spin: ;
the disk inclination angle: ;
the inner and outer radii of the disk: and ,
respectively;
the broken power-law disk emissivity index: (for ),
(for ) and the radius () where emissivity changes from to
;
the reflection fraction as defined in Dauser et al. (2016): ;
the ionization parameter (erg cm s-1, in log units) at the
surface of the disk
(i.e., the ratio of the X-ray flux to the gas density): log ;
the iron abundance relative to the solar value (here Grevesse & Sauval 1998):
;
the high-energy cut-off (identical for both the intrinsic
power law and the relativistic reflection spectrum): .
The relxillion model is similar to the relxill one but allows us to calculate the reflection from the disk with several zones of different ionization (log ). The number of the zones (which has to be high enough for a good physical representation, here taken at 15) and the ionization gradient versus the radius can be specified directly in the model.
A.2 Lamppost geometry
The relxilllp models are defined for the lamppost geometry. The parameters , , and are replaced by the height of the primary source , and the reflection fraction value is self-consistently determined by the the lamppost geometry (fixReflFrac=1).
The relxilllpion model takes into account an ionization gradient of the accretion disk as for the relxillion model, while the relxilllpalpha model calculates self-consistently the radial dependence of the ionization from the irradiation of the disk, using a certain mass accretion rate () and assuming the density profile of an accretion disk (Shakura & Sunyaev 1973).
Appendix B Reflection models for the four 2014 XMM-Newton/pn spectra
| Parameters | relxill | relxilltbp | relxillion | relxilllp | relxilllpalpha | relxilllpion |
|---|---|---|---|---|---|---|
| (1021 cm-2) | 1.090.02 | 1.060.01 | 1.180.02 | 1.000.01 | 1.150.01 | 1.130.01 |
| 0.965 | 0.9700.001 | 0.997 | 0.968 | 0.992 | 0.997 | |
| (degrees) | 6.7 | 6.3 | 30.60.9 | 5.9 | 5.6 | 5.9 |
| log (erg cm s-1) | 0.1 | 0.1 | 4.5 | 0.1 | 3.80.1 | |
| 7.9 | ||||||
| (%) | 18.20.3 | 18.2(f) | ||||
| 1.6 | ||||||
| 0.5 | 0.5 | 0.80.1 | 0.5 | 0.5 | 0.5 | |
| 2014 March 18 | ||||||
| 2.480.02 | 2.460.01 | 2.380.01 | 2.370.01 | 2.400.01 | 2.390.01 | |
| 10.8 | 10.20.1 | 15.2 | ||||
| 2.010-4 | 2.010-4 | 1.410-4 | 1.510-2 | 1.910-2 | 1.70.110-2 | |
| 7.4 | 6.50.1 | 7.60.4 | ||||
| 4.80.5 | 2.5 | 3.10.4 | ||||
| 4.0 | ||||||
| () | 3.8 | 6.30.1 | 3.9 | |||
| () | 8.3 | |||||
| () | 1.80.1 | 1.70.1 | 1.70.1 | |||
| 2014 March 20 | ||||||
| 2.370.02 | 2.360.01 | 2.300.01 | 2.290.01 | 2.330.01 | 2.310.01 | |
| 7.50.7 | 7.40.1 | 11.3 | ||||
| 1.710-4 | 1.710-4 | 1.310-4 | 1.010-2 | 1.310-2 | 1.210-2 | |
| 6.8 | 6.10.1 | 7.50.6 | ||||
| 3.4 | 1.1 | 2.90.3 | ||||
| 3.5 | ||||||
| () | 5.2 | 9.4 | 3.7 | |||
| () | 17.1 | |||||
| () | 1.90.1 | 1.70.1 | 1.70.1 | |||
| 2014 March 22 | ||||||
| 2.380.02 | 2.360.01 | 2.290.01 | 2.270.01 | 2.310.01 | 2.300.01 | |
| 8.3 | 8.10.1 | 12.8 | ||||
| 1.910-4 | 1.910-4 | 1.30.110-4 | 1.110-2 | 1.310-2 | 1.310-2 | |
| 7.6 | 6.70.1 | 7.50.5 | ||||
| 5.00.5 | 1.30.5 | 3.20.5 | ||||
| 7.7 | ||||||
| () | 3.4 | 6.1 | 3.8 | |||
| () | 9.4 | |||||
| () | 1.90.1 | 1.70.1 | 1.70.1 | |||
| 2014 March 24 | ||||||
| 2.370.02 | 2.360.01 | 2.290.01 | 2.270.01 | 2.310.1 | 2.300.01 | |
| 8.2 | 8.2 | 13.6 | ||||
| 1.710-4 | 1.710-4 | 1.210-2 | 1.010-2 | 1.310-2 | 1.210-2 | |
| 8.1 | 6.8 | 8.1 | ||||
| 4.3 | 3.1 | 3.30.3 | ||||
| 3.6 | ||||||
| () | 3.6 | 8.00.4 | 3.20.4 | |||
| () | 13.2 | |||||
| () | 1.80.1 | 1.70.1 | 1.70.1 | |||
| /d.o.f. | 7246.6/6728 | 7278.0/6720 | 7164.5/6727 | 7507.4/6740 | 7329.7/6740 | 7309.1/6739 |
| 1.08 | 1.08 | 1.07 | 1.11 | 1.09 | 1.08 | |
Table 8 reports the spectral fits of the four 2014 XMM-Newton/pn spectra using the relxill models (see .
Appendix C Reflection modelling for the X-ray broad-band spectra in 2014 March 22
C.1 Investigation of possible difference between the observed and incident photon indices
Following the results from Fürst et al. (2015) for the X-ray binary GX 339-4 (in low-luminosity, hard states), we then investigate if the inability of the relativistic reflection models to account for the broad-band spectrum could be explained by a moderate difference in the spectral powerlaw indices. For GX 339–4 a 0.3 were found131313However, we note that Steiner et al. (2017) proposed that this hardening of reflection spectrum can be explained by Compton scattering in the corona..
For the coronal geometry, we allow the blurred reflector to see a different continuum () with respect to the primary one. Since in the relxill model the intrinsic continuum is included in the model, not enabling us to have a different continuum shape for the direct and the reflected one, we modify the baseline model as tbnew(cutoffpl + relxill + 3 zgaussians), with the reflection fraction of the relxill model set to negative values to allow only the reflection component to be returned. cutoffpl is a power law with a high-energy exponential cut-off. The fit statistic improves significantly with 287 for only one additional parameter. However, this would mean an unlikely scenario with very different continua with 1.0. We then investigate a scenario with two relativistic reflection models with different continuum shapes. This improves significantly the fit statistic compared to the single reflection component, with 176 for three additional parameters. We find 0.4, but a hard X-ray excess residual is still present above 35 keV.
We perform the same tests as above assuming a lamppost geometry, but we are unable to find satisfactory fits, even considering a vertically extended primary continuum source on the rotation axis (relxilllpextxillver) or a moving continuum source (relxilllpvelo).
Of course in all above fits, the Fe K red and blue residuals are still present.
C.2 High-density reflection modelling
The reflection models used in this work are calculated for a density of 1015 cm-3, for which it is assumed that the ionization state of the gas is identical for a given value. But, as reported very recently by García et al. (2016), higher densities “are most relevant for low mass accreting black holes and when the coronal fraction is high”. Therefore, they computed the reflected spectra for densities larger than the commonly assumed density of 1015 cm-3, i.e., up to =1019 cm-3. They showed that, for such higher density models, a very significant increase in the continuum flux at energies below about 2 keV occurs due to a large increase of thermal emission at soft X-ray energies. In other words, a high-density accretion disk leads to a larger soft excess compared to lower-density disks (such as 1015 cm-3). Therefore, since such a high density may be appropriate for Ark 120, a full grid of reflection models for =1019 cm-3 with high-energy cut-off fixed at 1000 keV has been produced (J. Garcia, private communication). We apply this high-density model to the 2014 March 22 XMM-Newton/pn and NuSTAR spectra, for a coronal geometry. We find an unsatisfactory fit of the X-ray broad-band energy (/d.o.f.=2513.3/2058; =1.22). A weaker – though still significant – hard X-ray excess is found since a harder photon powerlaw index (=1.760.01) can produce a larger soft excess emission, while a soft photon index is required for lower disk density (=2.220.01, see Table 6). In addition, there are still significant model/data deviations below about 1 keV and in the Fe K energy range (see Fig. 10). In conclusion, even a high-density disk cannot reproduce the broad-band X-ray spectrum.
 |