Improving isotopic identification with INDRA Silicon-CsI(Tl) telescopes
Abstract
Profiting from previous works done with the INDRA multidetector [1] on the description of the light response of the CsI(Tl) crystals to different impinging nuclei [2, 3], we propose an improved identification-calibration procedure for Silicon-Cesium Iodide (Si-CsI) telescopes, namely an Advanced Mass Estimate (AME) method. AME is compared to the usual, simple visual analysis of the corresponding two-dimensional map of type, by using INDRA experimental data from nuclear reactions induced by heavy ions in the Fermi energy regime. We show that the capability of such telescopes to identify both the atomic and the mass numbers of light and heavy reaction products, can be quantitatively improved thanks to the proposed approach. This conclusion opens new possibilities to use INDRA for studying these reactions especially with radioactive beams. Indeed, the determination of the mass for charged reaction products becomes of paramount importance to shed light on the role of the isospin degree of freedom in the nuclear equation of state [4, 5] .
1 Introduction
One of the present motivations for investigating heavy-ion collisions at intermediate energies consists of improving our understanding of the equation of state for nuclear matter with the isospin degree of freedom. The advent of new accelerators, providing high intensity radioactive beams will cover a broad range of isospin () ratios. Jointly, new detection arrays like FAZIA [6, 7], which fully exploit pulse shape analysis from silicon detectors, are under construction to benefit from these future possibilities. Information on the isospin dependence of the nuclear EOS can then be obtained by properly choosing projectile-target colliding systems. To improve the present experimental capabilities in this framework, we present a new Advanced Mass Estimate (AME) approach, based upon the telescope technique for INDRA Silicon-CsI telescopes [1]. This approach will extend the isotopic identification to nuclear reaction products heavier than those commonly identified with standard two-dimensional correlations. Here, indicates the energy lost in the Silicon stage (Si) of the telescope and the scintillation light produced in the stage, made by a CsI(Tl) scintillator crystal read by a photomultiplier and corresponds to the residual energy deposited by energetic charged reaction products. The main difficulties for identifying the mass number over a broad range of elements are related to the non-linear energy response of each of the two stages and, in particular, of the scintillator. Actually, the light response of the scintillator strongly depends on the reaction product identity (charge and mass), which makes difficult even the determination of the deposited energy. At present time, the isotopic identification is visually achieved only for light nuclei from hydrogen up to (roughly) carbon isotopes for most of the INDRA Si-CsI telescopes. For some specific telescopes with smaller thickness - instead of -, an increased gain has been used in order to improve the energy resolution and hence the isotopic separation during the INDRA campaign performed at a few years ago. In doing so, the isotopic identification for these specific telescopes has been slightly augmented up to oxygen isotopes for the best cases.
To improve and optimize information coming from INDRA Si-CsI telescopes as far as the mass number is concerned, we started from the pionneering works of Pârlog et al. [2, 3] which provide an accurate physical description of the light response produced by the CsI(Tl) crystals. In these articles, two formulas have been derived concerning the relation between the light signal , the atomic number , the mass number and the incident energy of a reaction product detected by a CsI scintillator. The proposed method was then used and tested on data recorded with INDRA during the fifth campaign, with telescopes having as first stage or -thick Silicon detectors. These experimental data were obtained by bombarding targets with beams at MeV and MeV.
The paper is organized as follows. In section (II), we recall the main results of references [2, 3] concerning the role of quenching and knock-on electrons in scintillation light from the CsI(Tl) crystals and show the quality of the analytical description. Section (III) describes the Advanced Mass Estimate (AME) method and the comparisons with standard INDRA isotopic identification. In section (IV) determination and uncertainty on are discussed. In Section (V) we present a summary of this work.
2 Quenching and knock-on electrons (-rays) in scintillation light of CsI(Tl) crystals
Cesium iodide scintillators, CsI(Tl), doped with thallium at a level of molar concentration, are inorganic crystals where the scintillation light is produced by the activation (excitation) of the thallium atoms encountered by the carriers (electrons and holes) produced during the motion of the incoming charged product. The activation results in an emission of light by the excited thallium atoms in the green band at . The differential scintillation light output as a function of energy is often described by means of the Birks formula [8]:
| (1) |
being the scintillation efficiency and the quenching coefficient. The differential light decreases as the stopping power increases; this is the so-called quenching effect, more pronounced for the heavier ions leading to high carrier concentrations. Under the approximation , the integral over the variable of the above equation provides a simple formula for the total light response [9] as a function of the initial energy of the detected ion:
| (2) |
The gain coefficient includes both the scintillation efficiency and the electronic chain contribution to the signal amplification. The quenching coefficient is mainly related to the prompt direct recombination of part of the electrons and holes, which thus are not participating to the excitation of the activator atoms.
The expressions (1) and (2) were used, with reasonable results [8, 9, 10] in the case of light charged particles or Intermediate Mass Fragments (IMFs) of rather low energy per nucleon , i.e. as long as the contribution to the light response of the knock-on electrons or -rays, escaping the fiducial volume of very high carrier concentration close to the trajectory of the particle/ion, remains unsignificant. Actually, above a certain energy per nucleon threshold , the incident particle/ion starts to generate these rapid electrons, which are characterized by a small stopping power. Consequently, the fraction - firstly introduced by Meyer and Murray [11] -, of the energy deposited into a slice and carried off by the knock-on electrons is practically not affected by quenching. The -rays increase thus the light output and this should be necessarily taken into account at energies higher than a few MeV/nucleon, especially for heavier ions.
As it penetrates into a CsI crystal, an energetic charged particle/ion is gradually loosing its energy (from to ) mainly by ionization - the electronic stopping power -, leading to the scintillation, but also, in a smaller extent, by interacting with the host lattice nuclei - the nuclear stopping power -, lost for the radiative transitions. Both stopping powers can be quantitatively predicted, e.g. by using Ziegler tables [12] appealing to the work of Lindhard et al. [13]. Within the INDRA collaboration, we use stopping power tables for heavy ions in solids from Northcliffe and Schilling at low energies [14] and from Hubert and Bimbot at high energies [15], both matched at 2.5 MeV/nucleon. They provide quite accurate results in the low and intermediate energy range, i.e. from few hundreds of keV/nucleon up to MeV/nucleon, of interest here. More than a decade ago, Pârlog et al. [2, 3] put in evidence the role of the two types of energy loss to the quenching and also found the dependence of the fraction on the instantaneous velocity (or energy per nucleon ). They disentangled the contributions of the carriers produced in the main particle track and of the -rays to the scintillation too. The authors quantified these processes in a simple Recombination and Nuclear Quenching Model () connecting the exact value of the total emitted light to both the electronic and nuclear infinitesimal stopping powers along the incident particle track via numerical integration [2]. The model contains Eq. (1) as a particular case. Under well argued approximations, they derived a more friendly analytical formula relating to the quantities and [3]:
| (3) |
for an incident energy in the CsI(Tl) higher than the threshold at which the -rays start to be generated. Besides the coefficients , with the same physical signification as above in Eq. (2), two others appear: the energy per nucleon , (a few MeV/nucleon) and - the fraction (a few tenths of percents) of energy - they are carrying off, taken as a constant irrespective of current energy along the particle path above . At low energy (), and only the first term is present, then Eq. (3) is reduced to Eq. (2). These four parameters have then to be evaluated by using a number of suitable calibration points by a fit procedure.
The relation (3) is purely analytical and can then be easily implemented for calibration purpose. It is less accurate than the exact treatement provided in [2] especially at low energy. One drawback is also the step function used for , which jumps from 0 to at in order to allow the analytical integration over . This introduces a discontinuity in the function at this connection point, especially for very heavy fragments [3]. Nevertheless, it may be ad hoc improved by slightly improving the continuity of the fraction around . In this work, we consider that the use of the analytical expression will only marginally affect the results, taking into account the intrinsic quality of the Silicon wafers and of the CsI crystals of the INDRA telescopes, which does not secure the precision required to appreciate such discrepancies. Moreover, the total light emitted by the CsI(Tl) scintillators is not directly measured, but reconstructed, through the procedure described by Pârlog et al. [3], starting from two components of the scintillation light measured by integrating the signal in the fast and slow time gates [3]. Nevertheless, for a more rigorous and accurate treatment, the use of the exact formulation of [2] is preferable when possible, for example with high-quality detectors such as FAZIA Si-CsI telescopes. This will be the subject of a forthcoming paper.
As an example of the quality attained with our analytical description for the scintillation light in CsI(Tl) crystal, Fig. 1 displays the energy-light correlation using Eq. (3) superimposed on INDRA data concerning the system at MeV, for a specific Si-CsI telescope.
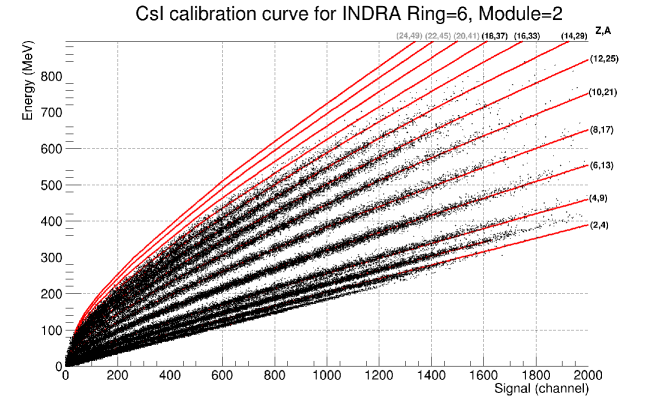
Each full/coloured line in Fig. 1 corresponds to a given nucleus with an atomic number and a mass number . We have chosen here to display isotopic lines with for even-Z nuclei. We will see in the following that this mass assumption is quite reasonable for IMFs when considering the neutron (n)-rich system . For a given energy - determined as shown in the next section -, the heavier the nucleus, the smaller the light value is; this is a direct consequence of the ratio nuclear/electronic stopping powers, and also of the quenching effect. Both quantities increase with the charge and the mass of the fragment and decrease when increases. Additionaly, above a certain velocity, -electrons are generated, very efficient for light production. These are the reasons why the curvature of the different isotopic curves shown in Fig. 1 evolves toward a linear behavior at higher light/energy, here . It is worthwhile to mention that the -rays contribution to the light is quite large, reaching for , as pointed out in Ref. [3] and must be definitely included in order to reproduce the experimental data. To obtain the results displayed in Fig. 1, we have used calibration points coming from secondary light beams stopped in CsI detectors from up to together with punched through events in the Silicon layer when possible. In a two dimensional plot, these points are close to the ordinate axis, i.e. to fragment energies slightly higher than that necessary to traverse the Silicon stage of the telescope and to reach the CsI(Tl) one with a quite small residual energy, sufficient however to be seen in the scintillator stage.
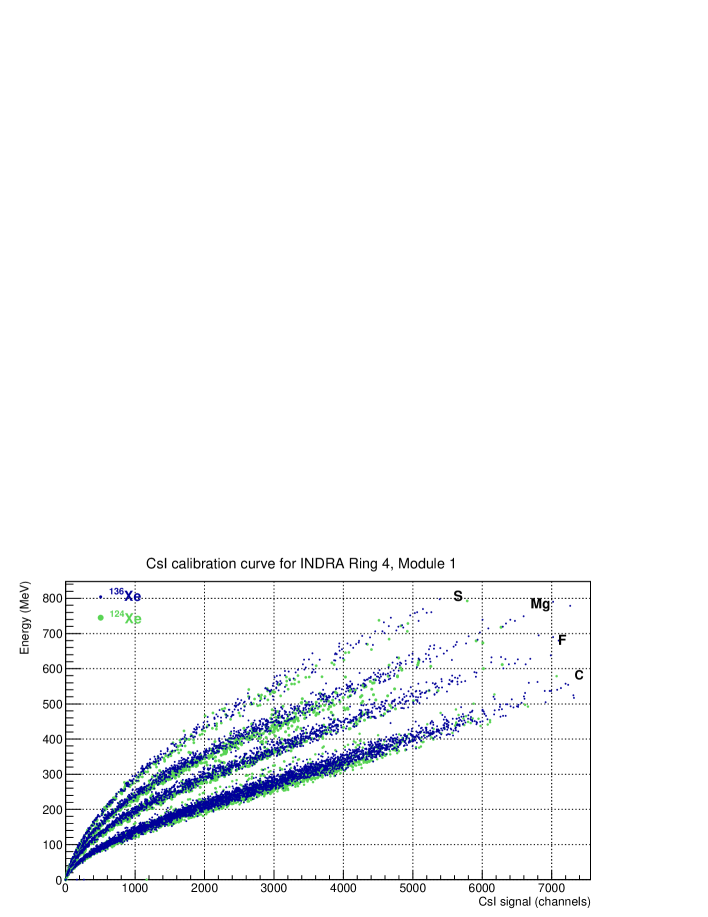
In order to better appreciate the performances concerning the isotopic identification in INDRA CsI telescopes, we display in Fig. 2 the correlation between the energy and the CsI light signal (same as for Fig. 1) for 4 selected elements (carbon, fluorine, magnesium and sulphur), and for systems with different neutron content: and at MeV. We can observe a significative difference between the two systems concerning the neutron richness of the produced fragments (higher masses for the (n)-rich system in blue) as one could expect from simple physical arguments. It is worthwhile to mention that this result requires indeed a very good stability for the CsI light response. This is done in INDRA by monitoring a laser pulse all along the data taking [3]. Thus, Fig. 2 suggests that the CsI light signal can help to discriminate the different isotopes, here at least up to (sulphur). In the following, we will use this additional valuable information to improve the usual identification method for heavier elements than typically done up to carbon or nitrogen.
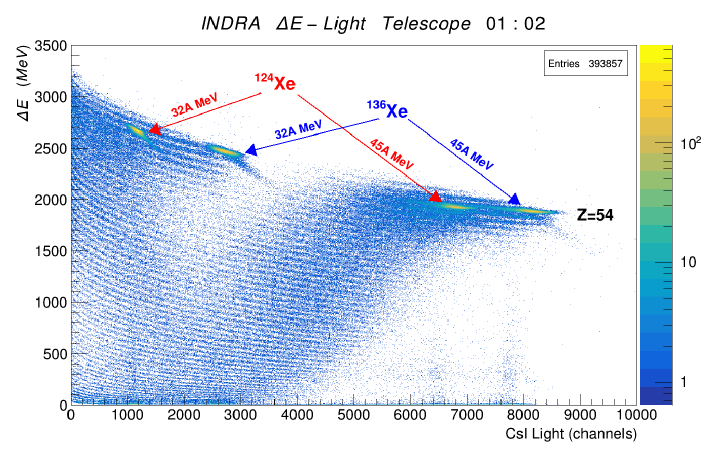
To illustrate the overall sensitivity of the Si-CsI(Tl) telescopes to the mass number, Fig. 3 displays the correlation bidimensional matrix of the module (including a -thick Si) for the ring (°°) of INDRA, and for and projectiles on at MeV and MeV bombarding energies. The bright/yellow spots, indicated by arrows on the borders of the geometrical loci for (two in the region of the MeV incident energy and other two in that of MeV one) correspond in both cases to the (n)-poor or (n)-rich projectiles, respectively. These findings indeed show the good sensitivity of the response of INDRA telescopes to the mass of the detected ejectile, thus calling for a deeper analysis of the experimental data as presented hereafter.
3 Advanced Mass Estimate (AME) in INDRA Si-CsI telescopes
In this section, we are going to present the new AME identification method in details. We use information given by the energy lost in the Silicon detector, , and the atomic number taken from the usual identification method in a Si-CsI map (see Fig. 3 for example). Doing so, we benefit from the previous identification works done for INDRA data : identification in Si-CsI matrices by semi-automatic [16] or handmade grids and the careful calibration of the Silicon detector, by means of particle source and secondary beams stopped in this layer [17]. For heavy ions (), the Pulse Height Defect (PHD) in this detector can be large [17] and has to be carefully evaluated. For INDRA, we use the elastic scattering of low-energy heavy ion beams (Ni and Ta at AMeV) which are stopped in Silicon detectors. Traditionally, we quantify the PHD as a function of the atomic number, the energy of the particle and the quality of the detector, according to Moulton formula [18].
For a given element characterized by its atomic number , the measured energy deposited in the first layer of the Si-CsI(Tl) telescope depends on the velocity, or the initial energy and the mass of the incident particle and, in principle, it can not provide by itself the two quantities without ambiguity. To perform consistently the isotopic identification in Si-CsI matrices, we then assume a starting value for the mass number concerning one detected nucleus with its atomic number and, by constraining the energy loss in the Silicon stage at the measured value, we compute both the total energy at the entrance of the Silicon stage and the residual energy deposited in the CsI(Tl) by using the above-mentioned range and energy loss tables [14, 15]. This procedure imposes also to accurately evaluate the thickness of the Silicon detector. The value of the scintillation light given by Eq. (3) for the residual energy value associated to this starting value of is then compared to the experimental light output from the CsI(Tl). In order to determine the best ’theoretical’ value , we iterate on mass number (and consequently on the value of ) until we find the best agreement between the theoretical and experimental values of the light, always compatible with the energy lost in the Silicon stage. It is worthwhile to mention that the mass number is an integer and, as such, is varied by increment of one mass unit. At the end of the iteration, we get an integer mass number, giving the best agreement for the experimentally determined quantities and as displayed in Fig. 3. This is the basis of the Advanced Mass Estimate (AME) method, which, by making use in a consistent way of the experimental quantities and , brings a more accurate information on both the mass and the residual energy (and consequently the total energy too).
As one may guess from Fig. 3, the calibration for the Silicon detector should be as accurate as possible to perform the best isotopic identification. The formula given by [18] used to calculate the PHD does not depend on the ion mass. This is certainly an advantage as it simplifies our approach, but it may become a drawback too. Even if the calibration of the Silicon stage can be considered to be rather accurate, we estimate that it represents at present time one of the known limitations for the extension of the identification method toward heavier nuclei (). Nevertheless, we will see in the following that it does not hamper very much the isotopic identification for such heavy products.
In the next sections, we will estimate the performances of this new identification procedure. As a first step, we will benchmark the new method for light nuclei where isotopic identification is already achieved () with traditional methods. In a second step, we will then get some quantitative values concerning the improvement for the isotopic identification of heavier nuclei, up to xenon isotopes in our case.
3.1 Benchmark with the standard method
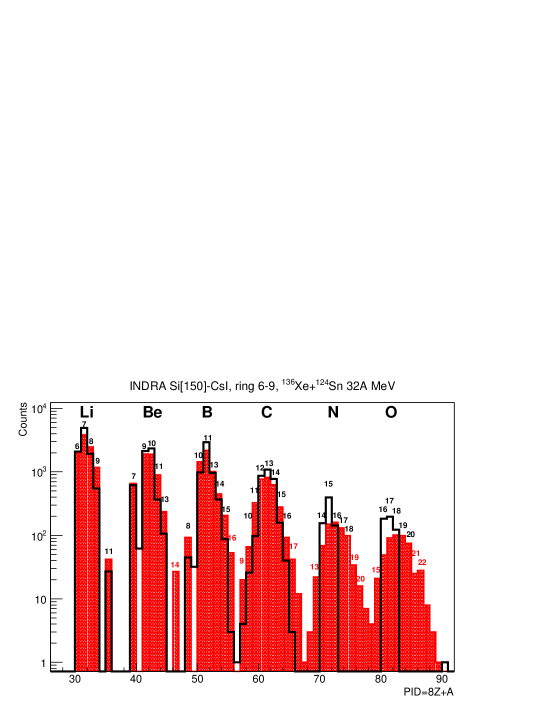
Using the AME method, we obtained isotopic distributions of light nuclei that have been compared to the ones obtained with the standard method (making use of semi-automatic [16] or handmade grids) for INDRA Si-CsI telescopes. Fig. 4 displays the isotopic distributions obtained by the new AME method (filled histograms) and the standard one, using standard grids (empty histograms), from lithium () up to oxygen () isotopes. The numbers indicate the isotope masses. For the meaning of the colours of these numbers : black or gray/red, see section (IV). The Particle IDentifier (PID) defined as , and allowing to separately observe the neighbouring elements, was chosen as abscissa for this representation. The modules incorporating silicon detectors of only thickness were kept for this representation. We observe an overall good agreement for the most probable isotopes, found as having the mass number as already discussed for Fig. 1.
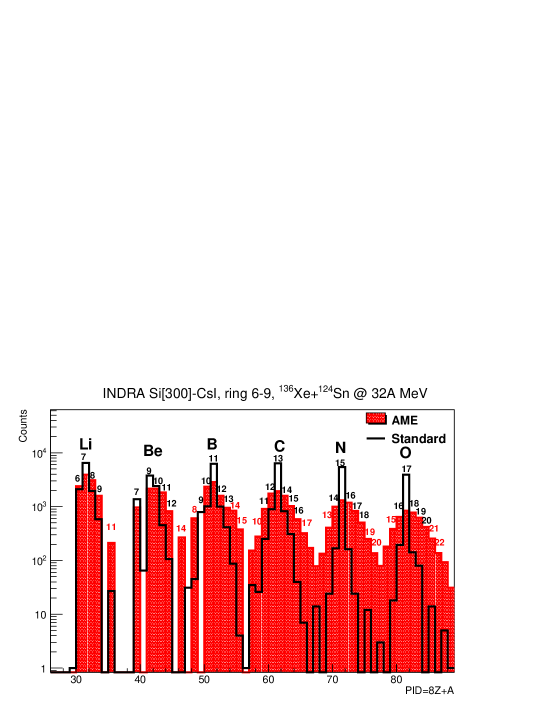
We also notice that the new method can still provide isotopic identification for less abundant species ((n)-rich and (n)-poor carbon to oxygen isotopes for example) since it does not use any visual recognition to build the grids for which a sufficiently large production cross-section is needed. This is clearly an improvement compared to the standard methods since it allows to recover the overall isotopic distributions for a given element , at least in this range of atomic numbers . This new feature is welcome for studying isospin effects as for example isotopic yields or isoscaling [4, 19].
To complete the benchmark on light nuclei, we also present in Fig. 5 the isotopic distributions obtained for the specific -thick Silicon detectors with a high gain, but for lower statistics. These ones allow to better discriminate the isotopes for light IMFs (up to ) and constitute a more stringent test for the comparison. Actually, the mass distribution for the carbon isotopes given by the standard method becomes now significantly larger, closer to that provided by the AME method, which recovers more exotic species. We also notice that even the yield for the most probable isotopes given by the two methods are sometimes not the same, due to the absence of grids for some telescopes where the visual inspection does not permit to define properly the isotopes curves and boundaries. This is particularly true for . In Figs. 4 and 5, the black numbers indicate the masses estimated with an uncertainty lower than one mass unit, while the grey/red ones, those affected by higher uncertainty. This specific point is developed in section (IV).
3.2 Comparison with different isospin systems
To extend and confirm the previous results, we checked the isotopic identification by means of the AME method for two systems with different isospins : and at the same incident energy per nucleon of AMeV without any event selection except here a common trigger multiplicity . These latter are also part of the data extracted from the INDRA campaign performed at GANIL. We could reasonably expect an overproduction of (n)-rich isotopes in the case of the (n)-rich system, for light nuclear fragments. In the following, we compared the isotopic distributions obtained for both systems, in order to see whether we observe any difference reflecting the possible different production yields for a given element .
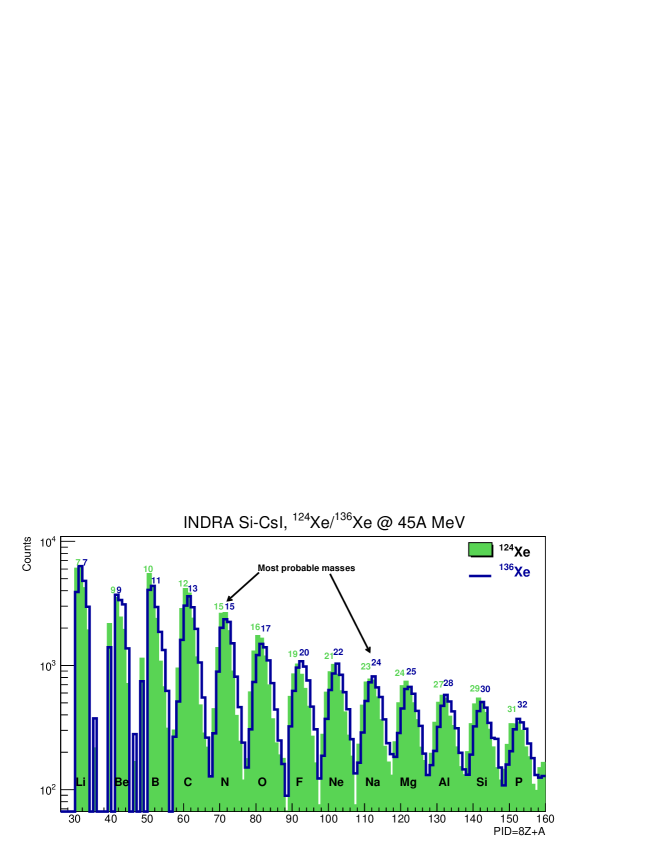
Fig. 6 shows the isotopic distributions from lithium to phosphorus isotopes, provided by Silicon-CsI telescopes. We display here only the results for the -thick Silicon ones. We can observe a global shift of the isotopic distribution toward more (n)-rich species for the (n)-rich system () as compared to the (n)-poor one (). If we consider the most abundant isotope per element, it is instead of and instead of for example, together with the enhancement of very (n)-rich isotopes production for the (n)-rich system () as one could expect. This illustrates the fact that the isotopic distributions determined with AME are not an artifact of the method but they truly could be associated to the genuine (physical) isotopic distributions.
4 Qualifying the isotopic identification
The isotopic identification can be further qualified by some specific operations. More precisely, we can provide a quite accurate estimate for the mass number even if the full isotopic resolution is not achieved. We remind that, knowing the thickness of the Silicon detector ( all along this section), the atomic number value of a detected fragment and the well determined , corrected for the PHD [17, 18], we can start by proposing an atomic mass number and compute the corresponding residual energy in the CsI stage using the energy loss tables. They are connected to the calculated scintillation light via the Eq.(3). Then, the integer mass number is varied, by steps of one unit, in order to minimize the quantity , in such a way that the measured value be reproduced too. After a few iterations, the best integer value of and the related value of are found, characterized by the shortest normalized distance between the calculated and experimental light. Finally, to get a representative value for the estimated mass number in a single event (one experimental point in the plot) at a given , we simply weight the different values by the inverse of as:
| (4) |
We shall exploit thus not only the mass number as an integer but directly the , defined above as: , by letting now the mass number to be a real number. Of course, for an experimental light , the main contributions to are coming from the shortest distances . Doing so, we can obtain an estimation concerning the uncertainty by taking the absolute difference between the optimum value , corresponding to the smallest distance and the weighted value obtained with the Eq. (4):
| (5) |
If the two values and are close enough (, so comprised in one unit range), we assume a full isotopic identification, whereas if , we have only a limited isotopic identification. This procedure can be therefore considered as a simple and easy way to qualify the isotopic identification. This is illustrated by the black and grey/red numbers on Figs. 4 and 5. The black numbers refer to whereas the grey/red ones to .
In order to further evaluate the validity of the method, we have also used INDRA results for the four different systems: at AMeV. Several tests are then proposed in the following. First, we have looked to data at the most forward angles, from rings , i.e. °°. These ones are obtained from the system at AMeV, by requiring a trigger multiplicity (fired telescopes) , in order to select mostly quasi-elastic events. From Fig. 3, we could indeed notice that we recover as main contribution the quasi-projectile () in the most forward rings. For such high values, the isotopes are not visually separated in the matrix; in the framework of the standard method, a hypothesis on the mass has to be made for finding their velocities starting from the measured energies deposited in the stage of a telescope. Fig. 7 displays the correlation between the mass and the velocity parallel to the beam, for different ejectiles and for different mass estimates. The yellow stars indicate the maximum number of entries.
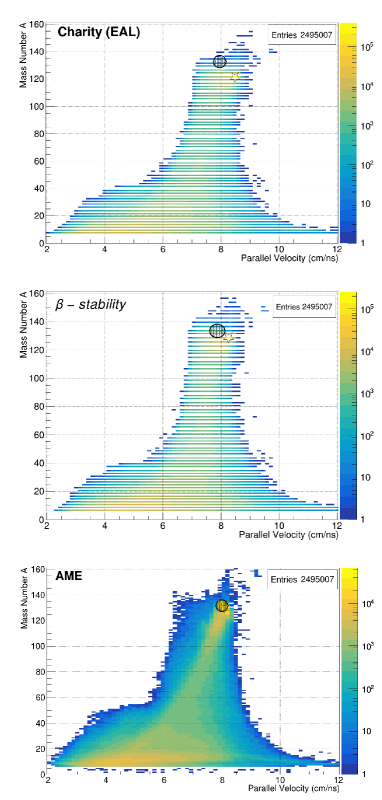
The two upper panels of Fig. 7 display the correlation for the standard case (usual method), where only the atomic number is determined from the plot. In the upper panel, for we took as mass hypothesis the prediction for the evaporation attractor line (EAL) [20] (see below). It leads to value of velocity parallel to the beam direction. In the middle panel, the -stability hypothesis is used , and the mass for xenon is set to , richer in neutron, and . In both cases, the values of the atomic mass and the parallel velocity are peaked quite far from the expected elastic contribution, in the present case: and represented by the filled circles on Fig. 7. This is due to the incorrect values of the mass number , simply calculated from the atomic numbers via different hypotheses. Consequently, the corresponding parallel velocities are also incorrect since they were computed by means of these hypothetical values. At variance, we can notice that applying the iterative method - lower panel of Fig. 7 -, the plotted distribution presents at and a maximum located much closer to the elastic contribution. We could therefore infer that the obtained results with are more valid for the (n)-rich projectiles even for these very heavy ions detected in the region of quasi-elastic events. We also found the same conclusion for the proton (p)-rich system at MeV.
Now, if we look at the distributions in Fig. 8, we may stress also the differences. In the upper panel, when we are not using the scintillation light to determine the mass number (usual method), we can get some isotopic identification up to . By contrast, as shown in the lower panel, thanks to the new AME method, we are now able to distinguish a fair isotopic identification up to at least for which we have as obtained from Eq. (5) for the most abundant isotopes. The corresponding improvement concerning the isotopic resolution is indeed obtained by taking into account the additional information from the CsI crystal.
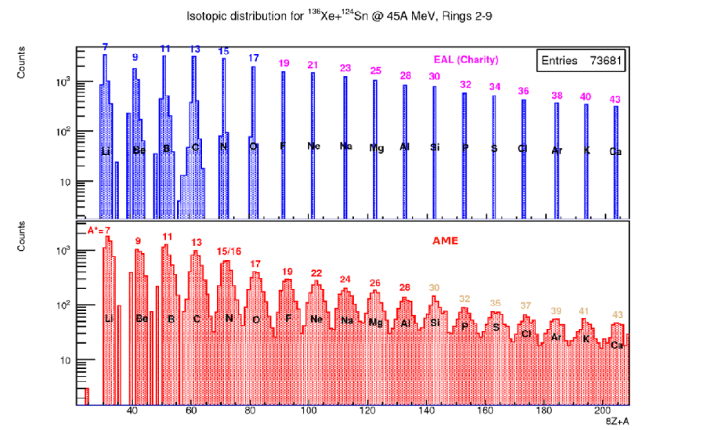
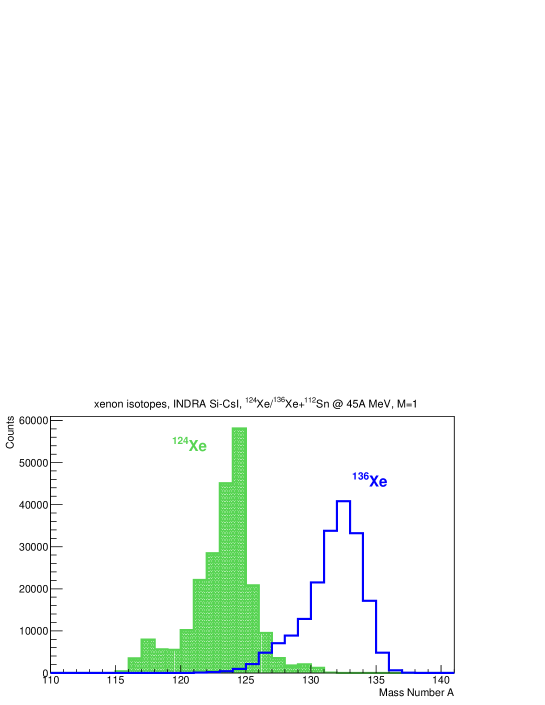
We could also qualify the accuracy of the isotopic identification for much higher than by taking advantage once again of the elastic channel for both reactions. For a trigger multiplicity , an angular range between ° and ° (rings 1-3), and by selecting only the xenon nuclei (), we obtain the isotopic distributions displayed in Fig. 9. These latters are centered around for (the mass of the projectile) and for (three mass units smaller than the projectile). For the data, due to its neutron richness, one could expect a loss of few neutrons for the projectile even in very peripheral collisions, transforming thus the elastic contribution into a quasi-elastic one. The results are therefore compatible with physical arguments and with those shown in the lower panel of Fig. 7 (mass - velocity correlation). The width of these isotopic distributions reflect indeed the convolution of the physical isotopic distribution as well as the uncertainty on the determined mass. We can therefore reasonably deduce that the uncertainty found in Fig. 9 could represent an upper limit for the mass uncertainty.
Finally, we display in Fig. 10 the charts for the reaction products in the above-mentioned reactions, their masses being determined via the AME procedure. We have selected the trigger condition , thus removing the major part of the quasi-elastic contribution presented in the previous Figs. 7-8. The grey/coloured curves represent the evaporation attractor lines [20], predicting the number of neutrons as an integer function of : the steeper/pink line, with recommended for and the more gentle slope/green line, with recommended for . The black curve indicates a degree polynomial fit of the -stability valley as the integer of , with i.e. nuclei more (n)-rich than for the EAL lines.
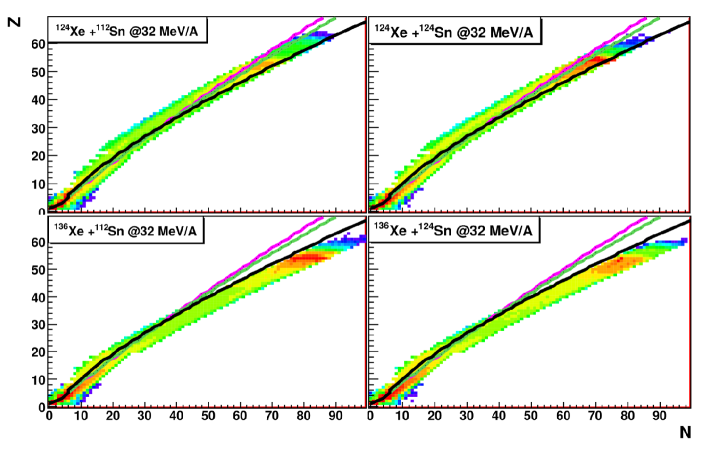
The charts in Fig. 10 concern the forward detection angles: °°(rings of INDRA). These data seem to reflect mainly the ratio of the projectile and none of these hypotheses on the number of neutrons, and consequently on , is able to reproduce in average the results, especially for the (n)-rich projectiles (lower panels). This overall view pleads in favour of the AME procedure compared to a simple mass hypothesis. With the present method we can obtain a better calibration of very thick CsI(Tl) scintillators allowing at the same time the full detection of very energetic charged reaction products and their mass determination with the best resolution. AME upgrades thus the INDRA array, designed to measure only the atomic number of the heavy nuclear fragments stemming from multifragmentation reactions, to a device able to estimate their mass too, up to for an isotopic resolution and for , and this in a very compact geometry.
5 Conclusion
We have presented a method called Advanced Mass Estimate (AME), a new approach for isotopic identification in Si-CsI telescopes using the analytical formulation for the CsI(Tl) light response provided in [3]. It includes explicitely the light quenching and the -rays contribution to the scintillation of the CsI(Tl) crystals. In this framework, we have shown that it is possible to use an iterative procedure to accurately calibrate the CsI detectors and, at the same time, to estimate the mass number of the charged reaction products, besides the charge one, with a resolution better than the one previously achieved by standard techniques. This method allows to recover not only the isotopic distributions obtained by the usual visual techniques for , but it can also be extended to heavier nuclei up to , with an uncertainty of one atomic mass unit for the telescopes of the INDRA array. In addition, from the comparison with experimental data, we have shown that it is reasonably possible to estimate the atomic mass within mass units up to xenon isotopes, if one is able to carefully evaluate the thickness and the pulse height defect in the silicon layer. We then consider that the quality of INDRA Si-CsI experimental results can be dramatically improved by using the new AME method, and that is particularly well adapted to undergo analyses with radioactive beams exploring a large domain. The AME method is not only suited for INDRA Si-CsI(Tl) telescopes but can be also successfully exploited with any charged particle array using the same kind of telescopes. Further studies concerning the implementation of the Recombination and Nuclear Quenching Model with the exact treatement mentioned in the first section are currently in progress, by using high-quality data from FAZIA telescopes, and will be the subject of a forthcoming paper.
References
References
- [1] J. Pouthas, et al., Nucl. Instr. and Meth. A 357 (1995) 418.
- [2] M. Parlog, et al., Nucl. Instr. and Meth. A 482 (2002) 674.
- [3] M. Parlog, et al., Nucl. Instr. and Meth. A 482 (2002) 693.
- [4] Dynamics and Thermodynamics with nuclear degrees of Freedom, Eur. Phys. J. A 30 (1) (2006), and references therein.
- [5] Topical Issue on Nuclear Symmetry Energy, Eur. Phys. J. A 50 (2) (2014), and references therein.
- [6] R. Bougault et al. (FAZIA collaboration), Eur. Phys. J. A50 (2014) 47.
- [7] S. Carboni et al. (FAZIA collaboration), Nuclear Instruments and Methods in Physics Research A 664 (2012) 251.
- [8] J.B. Birks, The theory and practice of scintillation counters, Pergamon Press, Oxford (1964).
- [9] D. Horn, et al., Nucl. Instr. and Meth. A 320 (1992) 273.
- [10] E. De Filippo, et al., Nucl. Instr. and Meth. A 342 (1994) 527.
- [11] A. Meyer, R.B. Murray, Phys. Rev. 118 (1962) 98.
- [12] J. F. Ziegler, Handbook of Stopping Cross Sections for Energetic Ions in All Elements, vol. 5 of series "Stopping and Ranges of Ions in Matter", Pergamon Press, New York (1980).
- [13] J. Lindhard, M. Scharff and H.E Schiott, K. Dan. Vidensk. Selk. Mat. Fys. Medd. 33 (14) (1963) 1-42.
- [14] L. C. Northcliffe and R. F. Schilling, Nuclear Data Tables A7 (1970) 233.
- [15] F. Hubert, R. Bimbot, H. Gauvin, Atomic Data and Nuclear Data Tables 46 (1990) 1.
- [16] L. Tassan-Got, Nucl. Instr. and Meth. B 194 (2002) 503.
- [17] G. Tabacaru, et al., Nucl. Instr. and Meth. A 428 (1999) 379.
- [18] J.B. Moulton, J.E. Stephenson, R.P. Schmitt, G.J. Wozniak, Nucl. Instr. and Meth. 157 (1978) 325.
- [19] G. Ademard et al. (INDRA collaboration), Eur. Phys. J. A50 (2014) 33.
- [20] R. J. Charity, Phys. Rev. C58 (1998) 1073.