Black Hole Mass Estimation in Type 1 AGN: H vs. Mg II lines and the role of Balmer continuum
Abstract.
Here we investigate the H and Mg II spectral line parameters used for the black hole mass (MBH) estimation for a sample of Type 1 Active Galactic Nuclei (AGN) spectra selected from the Sloan Digital Sky Survey (SDSS) database. We have analyzed and compared the virialization of the H and Mg II emission lines, and found that the H line is more confident virial estimator than Mg II. We have investigated the influence of the Balmer continuum emission to the MBH estimation from the UV parameters, and found that the Balmer continuum emission can contribute to the overestimation of the MBH on average for 5 (up to 10).
keywords: galaxies: active, galaxies: nuclei, quasars: supermassive black holes, techniques: spectroscopic, quasars: emission lines, line: profiles
1 Introduction
Several methods are used to estimate central black hole (BH) mass MBH in galaxies (for review see e.g. Marziani, Sulentic, 2012; Shen, 2013; Peterson, 2014; Ilić, Popović, 2014). For Type 1 AGN, the most appropriate methods for the MBH estimation are those using the strong broad emission lines (BELs), as the most prominent features in their spectra. The virial methods (see Peterson et al., 2004; Vestergaard, Peterson, 2006) are based on the assumption that the Broad Line Region (BLR) gas is bounded to the central BH (see Gaskell, 2009) and the main broadening mechanism of the BELs is the Keplerian motion around the supermassive BH, so the full width at half maximum (FWHM) of BELs indicates the velocity of the emitting gas. We should note that in principle the line dispersion much better represents this motion (Peterson et al., 2004; Collin et al., 2006), however in order to find the line dispersion one should assume some type of line profile (that may be very complex), therefore the FWHM is often used instead of the line dispersion.
One of these methods is based on the R - L relationship (see e.g. Bentz et al., 2006), the outcome of the reverberation mapping (see Blandford, McKee, 1982; Peterson et al., 2004, etc.), which enables the estimation of the photometric radius from only one epoch spectrum (see e.g. Vestergaard, Peterson, 2006). An alternative method for MBH estimation using the BEL parameters is based on the gravitational redshift in the broad line profiles (see Zheng, Sulentic, 1990; Popović et al., 1995; Bon et al., 2015; Jonić et al., 2016; Liu et al., 2017). The advantage of this method is that it does not depend on the BLR inclination, unlike the virial methods.
There are many unresolved questions relevant for the application of these methods. For example, since the BLR geometry could be complex (see e.g. Sulentic et al., 2000; Popović et al., 2004; Gaskell, 2009, etc.), it is essential to confirm if the virial assumption is correct for all BELs which are used in the methods for the MBH estimation and if the gravitational redshift could be measured from the BELs complex shapes, or if it may be suppressed by some other effects.
The most frequently used BELs as the virial estimators are the broad H (in the optical) and Mg II (in the UV) lines (see Marziani, Sulentic, 2012). Both, H and Mg II lines have complex profiles, which should be considered if these lines are used for the MBH estimation. Extracting refined H and Mg II profiles is a difficult task and it is essential for an accurate MBH estimation. Especially since the broad H overlaps with a numerous optical Fe II lines, the [O III] doublet and the H narrow line component, while the Mg II line overlaps with a numerous UV Fe II lines. Finally, the presence of the Balmer continuum for 3646Å, is contributing to the uncertainty of the MBH estimation from the UV parameters and it has to be subtracted for obtaining the pure power law luminosity in the UV band.
In this paper we first present the models of the optical Fe II, UV Fe II emission and Balmer continuum, that could give more precise measurements of the optical and UV parameters (H and Mg II broad line profiles, power law luminosity at = 3000Å, as L) used for the MBH estimation. Then, we analyze the virialization assumption for the H and Mg II broad lines, and the influence of the Balmer continuum to the MBH estimation from the UV parameters.
2 The Sample and Analysis
The used sample consists of the 287 spectra of Type 1 AGN, obtained from the SDSS Data Release 7 (DR7). The sample is the same as in Kovačević-Dojčinović, Popović (2015) where the detailed description of the sample selection criteria is given. For the investigation of the virialization of the emission regions, we exclude all spectra with the blue asymmetry, which resulted with the sample of 123 objects used in this research of the H and Mg II profiles (see Jonić et al., 2016). In the future work we plan to investigate in more details radio properties for this sample, and to search for the connection between the radio-loudness and MBH.
2.1 Model of the Optical Emission Lines in 4000-5500Å: Extracting the Pure Broad H Profile
To obtain a pure broad H component, the narrow H and [O III] lines have to be carefully subtracted, as well as the optical Fe II lines. After correcting the spectra for the Galactic reddening and the cosmological redshift, and subtracting the underlying continuum, we applied the multi-Gaussian fitting procedure in 4000-5500Å range, described in details in Kovačević et al. (2010) and Kovačević-Dojčinović, Popović (2015). In the fitting procedure, the number of free parameters was reduced assuming that the lines or the line components which originate from the same emission region, have the same widths and shifts. Therefore all narrow Balmer lines (H, H and H) have the same widths and shifts as [O III] lines, since we assume that they all originate from the Narrow Line Region (NLR). The broad part of the Balmer lines was modeled with two Gaussian functions representing the emission from the Intermediate Line Region (ILR) and from the Very Broad Line Region (VBLR) (see Popović et al., 2004; Bon et al., 2006, 2009; Hu et al., 2008).

We have made a Fe II template as a sum of the most prominent Fe II lines, described with Gaussian functions, with the same widths and shifts, since we assumed that all optical Fe II lines were originating from the same emission region. The number of free parameters was reduced by calculating the relative intensities for the Fe II lines with the same lower term of transition (see Kovačević et al., 2010). Finally, the Fe II template was described with five parameters of intensity, width, shift and temperature, which was included in the calculation of the relative intensities. For more details about the optical Fe II template see Kovačević et al. (2010) and Shapovalova et al. (2012), and this Fe II template is also available on line . The example of the spectral decomposition in 4000-5500Å range is shown in the optical part in Figure 1.
2.2 The Balmer Continuum Model
The UV pseudo-continuum consists of the power law, which represents the emission from the accretion disc and the bump at 3000Å, which represents the sum of the blended, high-order broad Balmer lines and the Balmer continuum ( 3646Å). In order to measure the flux or luminosity of the power law at UV spectral range (e.g. 3000Å), one needs to subtract the Balmer continuum emission first (see Figure 1). The model of the Balmer continuum first given in Kovačević et al. (2014), is based on the function for the Balmer continuum given in Grandi (1982) for the case of a partially optically thick cloud, with one degree of freedom decreased, as the intensity of the Balmer continuum was calculated, obtaining in that way lower uncertainty. The intensity of the Balmer continuum was estimated at the Balmer edge ( = 3646Å), as a sum of the intensities of all high-order Balmer lines at the same wavelength. All broad Balmer lines were represented with one Gaussian function only, with the same width and shift of a prominent Balmer line, and their relative intensities were taken from the literature or were calculated (see Kovačević et al., 2014). Therefore, if only one prominent Balmer line was fitted (e.g. H), and the shift, width and intensity were obtained from that fit, than the fluxes of all other Balmer lines would be known, and the Balmer continuum at the Balmer edge could be calculated. Finally, with this model, the UV pseudo-continuum was fitted with four free parameters: the width, shift and intensity of the one prominent Balmer line, and the exponent of the power law. An example of the Balmer continuum fit is shown below in Figure 1.
2.3 Model of the UV Emission Lines in 2650-3050Å: Extracting the Pure Mg II Profile
We performed the spectral decomposition in 2650-3050Å range in order to estimate the pure Mg II profile, which overlaps with the UV Fe II lines (Figure 1). The Mg II line was fitted with two Gaussian functions, the one that represents the line core and the other that fits the line wings (see Kovačević-Dojčinović, Popović, 2015), and a sum of those two components represents the broad Mg II line. The narrow Mg II line was not detected in analyzed spectra. The numerous Fe II lines in the range 2650-3050Å were all fitted with the Fe II template presented in Popović et al. (2003) and Kovačević-Dojčinović, Popović (2015). The Fe II lines in the 2650-3050Å range were divided into four multiplets, and relative intensities of the lines within each multiplet were taken from literature. Finally, the Fe II template was described with six parameters: four parameters for the intensity, line width and shift. The example of the spectral decomposition in the 2650-3050Å range with UV pseudo-continuum fit is shown in the UV part in Figure 1.
2.4 Measuring the Spectral Parameters
From the pure broad profiles of the H and Mg II lines, we measured the FWHM of these lines, as well as Full Width at 10% of the Maximum (FW10%M). The asymmetries of these lines (intrinsic shifts) were measured at different levels of the line maximal intensity (at 50%, z50 and at 10%, z10), as the centroid shift with respect to the broad line peak (see Jonić et al., 2016, their Fig 2). The luminosity of the continuum was calculated using the formula given in Peebles (1993) with adopted cosmological parameters of = 0.3, = 0.7, = 0, and Hubble constant Ho = 70 km s-1 Mpc-1. The virial MBH for the UV parameters (FWHM Mg II, L) was calculated using the formula given in Wang et al. (2009) (their E. (9), for = 2).
3 Results
3.1 Testing the Virialization of the Broad H and Mg II Lines
If the emission gas in the BLR is virialized, one can expect to observe correlations between the widths and the gravitational redshifts of the BELs, which comes from the equations for the MBH estimation by the virial method using the line width (see Zheng, Sulentic, 1990; Peterson et al., 2004). The expected relation is: zG FWHM2, i.e. log(zG) log(FWHM) (see Jonić et al., 2016). This correlation is expected since at the same distance from a BH the line is broadened by the gravitational rotational effect which depends from the distance as , and by the gravitational shift (red-shifting of photons) that also depends from the distance as (see Popović et al., 1995).
We investigated correlation between the intrinsic shifts, as indicators of the gravitational redshifts, and the widths of the H or the Mg II lines, at different levels (50% and 10%) of their maximal intensity, for the sample of 123 Type 1 AGNs with the red asymmetry in BELs. We have found that the width of the H line is well correlated with the line’s intrinsic shift measured at the 50% and at the 10% of the maximal intensity. However, in the case of the Mg II line, the correlation between the Mg II width and intrinsic shift is detected only at the 50% of the line maximal intensity, whereas at the 10% of the line maximal intensity an anti-correlation is seen (for more detail see Jonić et al., 2016).
Note here that the literature in the field presents comparisons on the use of the optical and the UV lines, like H and Mg II, as viral estimators of the MBH in AGN, pointing out that in some cases Mg II is more reliable as MBH estimator then H (e.g. Marziani et al., 2013, and references therein). However, it has been shown that the Mg II wings are emitted from the weakly gravitationally bounded gas (see Kovačević-Dojčinović, Popović, 2015; Jonić et al., 2016), i.e. the assumption of virialization may be problem in using Mg II line as the BH mass estimator.
3.2 Influence of the Blamer Continuum to the MBH Estimation Using the UV Spectral Parameters
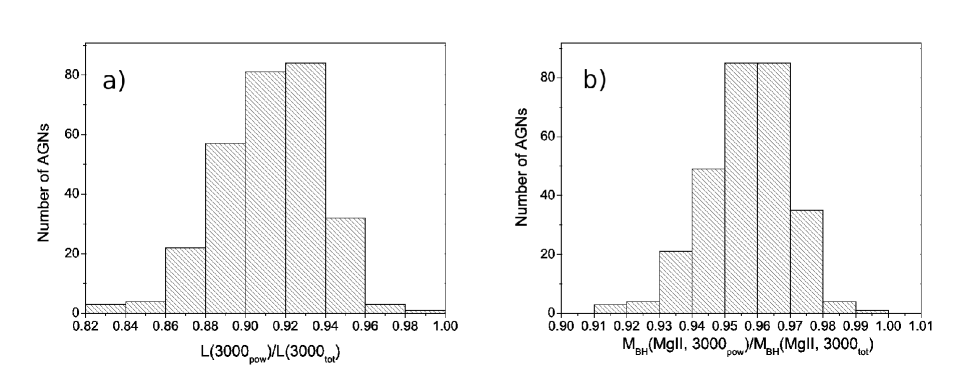
We calculated the luminosity at 3000Å before ( L) and after the Balmer continuum (L) contribution was subtracted. In the sample of 287 Type 1 AGN spectra, the Balmer continuum contributes to the continuum L on average for 10%, with the maximal value of 18%. The ratios of the L, with and without the Balmer continuum contribution, are shown on the histogram (Figure 2a).
The majority of the equations for the MBH estimation using the UV parameters neglect the contribution of the Balmer continuum (see e.g. McLure, Jarvis, 2002; Vestergaard, Osmer, 2009). Wang et al. (2009) give the relation for the assessment of MBH using the FWHM Mg II and L, assuming that after subtraction of the Balmer continuum, the L is the pure power law continuum, therefore we then compared MBH calculated with and without consideration of the Balmer continuum contribution.
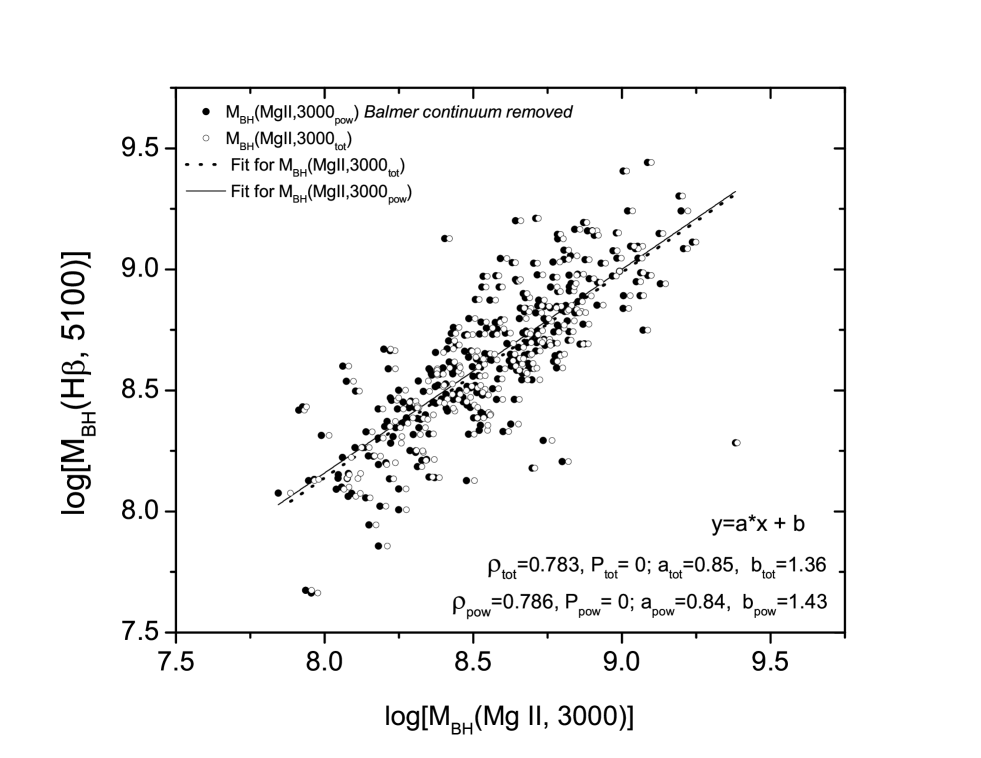
We got that the Balmer continuum increased MBH on average for 5% (0.02 dex), with the maximal value of the MBH overestimation up to 10% (0.04 dex). The ratio of the MBH estimates before and after the Balmer continuum subtraction is shown in Figure 2b. The comparison of MBH values before (index ’tot’) and after the Balmer continuum subtractions (index ’pow’) are also given in Figure 3, where the correlation coefficients ( and ), P-values (Ptot=0 and Ppow=0) and linear best-fit (y=a*x+b) coefficients are given: slope a, (atot=0.85 and apow=0.84) and y-intercept b, (btot=1.36 and bpow=1.43). It can be seen that the influence of the Balmer continuum to the MBH estimation is so small that it barely changes the correlation coefficient () or the coefficients of the linear best-fit (a, b) between the MBH estimated with the optical and the one estimated with the UV parameters. Also, it seams that removing the Balmer continuum does not affect the outliers in this relationship.
4 Conclusions
Here we have used the sample of the SDSS Type 1 AGN spectra to compare the most frequently used emission lines for the MBH estimation, H (in the optical band) and Mg II (in the UV band), in order to assess which line is better virial estimator and thus more convenient for that purpose. We investigated how the Balmer continuum affect the BH mass estimation using the UV parameters.
From our investigation we can outline the following conclusions:
-
(1)
The H line is a more reliable virial estimator than the Mg II line, since the expected linear relationship between logarithms of the widths (influenced by the Keplerian motion) and red asymmetries (caused by the gravitational redshift) was evidenced for both lines when measured at the 50% of the line maximal intensities, but when measured in the line wings (at the 10% of the line maximal intensities) the expected relationship was present only for H (see Jonić et al., 2016).
-
(2)
The disregard of the Balmer continuum emission, in the case of the MBH estimation using the UV parameters (Mg II, L), causes the overestimation of the MBH on average for 5% (0.02 dex) and up to 10% (0.04 dex).
At the end, let us note that similar investigation should be performed on the sample where more reliable methods for mass measurements (as e.g. reverberation) should be applied to explore the influence of the Balmer continuum and this we postpone for our future work. Moreover, some additional effects (as e.g. relativistic jets) can significantly affect line profiles, i.e. the radio loudness which can indicate the presence of relativistic jets, therefore in the future work radio properties of the sample should also be explored.
Acknowledgments
The work is a part of the project 176001 financed by the Ministry of Education, Science, Technology and Development, Republic of Serbia.
References
- Bentz et al. (2006) Bentz M. C., Peterson B. M., Pogge R. W., Vestergaard M., Onken C. A. The Radius-Luminosity Relationship for Active Galactic Nuclei: The Effect of Host-Galaxy Starlight on Luminosity Measurements // Astrophysical Journal. 2006. 644. 133–142.
- Blandford, McKee (1982) Blandford R. D., McKee C. F. Reverberation Mapping of the Emission Line Regions of Seyfert Galaxies and Quasars // Astrophysical Journal. 1982. 255. 419–439.
- Bon et al. (2009) Bon E., Popović L. Č., Gavrilović N., La Mura G., Mediavilla E. Contribution of a Disc Component to Single-peaked Broad Lines of Active Galactic Nuclei // MNRAS. 2009. 400. 924–936.
- Bon et al. (2006) Bon E., Popović L. Č., Ilić D., Mediavilla E. Stratification in the Broad Line Region of AGN: The two-component model // New Astronomy Reviews. 2006. 50, 9-10. 716–719.
- Bon et al. (2015) Bon N., Bon E., Marziani P., Jovanović P. Gravitational Redshift of Emission Lines in the AGN spectra // Astrophysics and Space Science. 2015. 360, 7. 7.
- Collin et al. (2006) Collin S., Kawaguchi T., Peterson B. M., Vestergaard M. Systematic effects in measurement of black hole masses by emission-line reverberation of active galactic nuclei: Eddington ratio and inclination // Astronomy & Astrophysics. 2006. 456. 75–90.
- Gaskell (2009) Gaskell C. M. What Broad Emission Lines Tell us About how Active Galactic Nuclei Work // New Astronomy Reviews. 2009. 53. 140–148.
- Grandi (1982) Grandi S. A. The 3000 Bump in Quasars // Astrophysical Journal. 1982. 255. 25–38.
- Hu et al. (2008) Hu C., Wang J. M., Ho L. C., Chen Y.-M., Bian W.-H., Xue S.-J. H Profiles in Quasars: Evidence for an Intermediate-Line Region // Astrophysical Journall. 2008. 683, L115. L115.
- Ilić, Popović (2014) Ilić D., Popović L. Č. Supermassive Black Holes and Spectral Emission Lines // Journal of Physics Conference Series. 548, 012002. 2014. 012002. (Journal of Physics Conference Series).
- Jonić et al. (2016) Jonić S., Kovačević-Dojčinović J., Ilić D., Popović L. Č. Virilization of the Broad Line Region in Active Galactic Nuclei: Connection Between Sshifts and Widths of Broad Emission Lines // Astrophysics and Space Science. 2016. 361, 101. 101.
- Kovačević-Dojčinović, Popović (2015) Kovačević-Dojčinović J., Popović L. Č. The Connections Between the UV and Optical Fe II Emission Lines in Type 1 AGNs // Astrophysical Journal Supplement. 2015. 221, 35. 35.
- Kovačević et al. (2010) Kovačević J., Popović L. Č., Dimitrijević M. S. Analysis of Optical Fe II Emission in a Sample of Active Galactic Nucleus Spectra // Astrophysical Journal Supplement. 2010. 189. 15–36.
- Kovačević et al. (2014) Kovačević J., Popović L. Č., Kollatschny W. A Model for the Balmer Pseudocontinuum in Spectra of Type 1 AGNs // Advances in Space Research. 2014. 54. 1347–1354.
- Liu et al. (2017) Liu H. T., Feng H. C., Bai J. M. A New Method to Measure the Virial Factors in the Reverberation Mapping of Active Galactic Nuclei // MNRAS. 2017. 466. 3323–3330.
- Marziani et al. (2013) Marziani P., Sulenti J. W., Plauchu-Frayn I., Olmo A. del. Is MgII2800 a reliable virial broadening estimator for quasars? // Astronomy & Astrophysics. 2013. 555. 16.
- Marziani, Sulentic (2012) Marziani P., Sulentic J. W. Estimating Black Hole Masses in Quasars Using Broad Optical and UV Emission Lines // New Astronomy Reviews. 2012. 56. 49–63.
- McLure, Jarvis (2002) McLure R. J., Jarvis M. J. Measuring the Black Hole Masses of High-redshift Quasars // MNRAS. 2002. 337. 109–116.
- Peebles (1993) Peebles P. J. Principles of Physical Cosmology. Princeton, New Jersey. 1993.
- Peterson (2014) Peterson B. M. Measuring the Masses of Supermassive Black Holes // Space Science Reviews. 2014. 183. 253–275.
- Peterson et al. (2004) Peterson B. M., Ferrarese L., Gilbert K. M., Kaspi S., Malkan M. A., Maoz D., Merritt D., Netzer H., Onken C. A., Pogge R. W., Vestergaard M., Wandel A. Central Masses and Broad-Line Region Sizes of Active Galactic Nuclei. II. A Homogeneous Analysis of a Large Reverberation-Mapping Database // Astrophysical Journal. 2004. 613. 682–699.
- Popović et al. (2004) Popović L. Č., Mediavilla E., Bon E., Ilić D. Contribution of the Disk Emission to the Broad Emission Lines in AGNs: Two-component model // Astronomy and Astrophysics. 2004. 423. 909–918.
- Popović et al. (2003) Popović L. Č., Mediavilla E. G., Bon E., Stanić N., Kubičela A. The Line Emission Region in III Zw 2: Kinematics and Variability // Astrophysical Journal. 2003.
- Popović et al. (1995) Popović L. Č., Vince I., Atanacković-Vukmanović O., Kubičela A. Contribution of Gravitational Redshift to Spectral Line Profiles of Seyfert Galaxies and Quasars // Astronomy and Astrophysics. 1995. 293. 309–314.
- Shapovalova et al. (2012) Shapovalova A. I., Popović L. Č., Burenkov A. N., Chavushyan V. H., Ilić D., Kovačević A., Kollatschny W., Kovačević J., Bochkarev N. G., Valdes J. R., Torrealba J., León-Tavares J., Mercado A., Benítez E., Carrasco L., Dultzin D., Fuente E. de la. Spectral Optical Monitoring of the Narrow-line Seyfert 1 Galaxy Ark 564 // Astrophysical Journal Supplement. 2012. 202, 10. 10.
- Shen (2013) Shen Y. The Mass of Quasars // Bulletin of the Astronomical Society of India. 2013. 41. 61–115.
- Sulentic et al. (2000) Sulentic J. W., Marziani P., Dultzin-Hacyan D. Phenomenology of Broad Emission Lines in Active Galactic Nuclei // Annual Review of Astronomy and Astrophysics. 2000. 38. 521–571.
- Vestergaard, Osmer (2009) Vestergaard M., Osmer P. S. Mass Functions of the Active Black Holes in Distant Quasars from the Large Bright Quasar Survey, the Bright Quasar Survey, and the Color-selected Sample of the SDSS Fall Equatorial Stripe // Astrophysical Journal. 2009. 699. 800–816.
- Vestergaard, Peterson (2006) Vestergaard M., Peterson B. M. Determining Central Black Hole Masses in Distant Active Galaxies and Quasars. II. Improved Optical and UV Scaling Relationships // Astrophysical Journal. 2006. 641. 689–709.
- Wang et al. (2009) Wang J.-G., Dong X.-B., Wang T.-G., Ho L. C., Yuan W., Wang H., Zhang K., Zhang S., Zhou H. Estimating Black Hole Masses in Active Galactic Nuclei Using the Mg II 2800 Emission Line // Astrophysical Journal. 2009. 707. 1334–1346.
- Zheng, Sulentic (1990) Zheng W., Sulentic J. W. Internal Redshift Difference and Central Mass in QSOs // Astrophysical Journal. 1990. 350. 512–517.