Centimeter-scale suspended photonic crystal mirrors
Abstract
Demand for lightweight, highly reflective and mechanically compliant mirrors for optics experiments has seen a significant surge. In this aspect, photonic crystal (PhC) membranes are ideal alternatives to conventional mirrors, as they provide high reflectivity with only a single suspended layer of patterned dielectric material. However, due to limitations in nanofabrication, these devices are usually not wider than . Here we experimentally demonstrate suspended PhC mirrors spanning areas up to . We overcome limitations imposed by the size of the PhC and measure reflectivities greater than on thick mirrors at a wavelength of – an unrivaled performance compared to PhC mirrors with micro scale diameters. These structures bridge the gap between nano scale technologies and macroscopic optical elements.
Photonic crystal (PhC) membranes are suspended dielectric sheets patterned with sub-wavelength, low-index two-dimensional periodic structures Fan2002 . These patterns give rise to resonances that couple out-of-plane radiation to in-plane leaky modes, and can be engineered to transform a flat membrane into a mirror Kanskar1997 , a lens Lu2010 , or even a curved mirror Fattal2010 ; Lu2010 ; Guo2017 . Here we study a PhC consisting of a periodic lattice of holes in a membrane, whose hole radius and lattice constant can be tuned to reflect light at a wavelength of choice. When fabricated from materials with low optical absorption such as low-pressure chemically vapor-deposited silicon nitride (LPCVD SiN), one can realize mirrors with sub-wavelength thicknesses and reflectivities , mostly limited by scattering losses, as shown in Chen2017 . LPCVD SiN thin films also enable the combination of PhC mirrors with low thermal noise mechanical oscillators, due to their high intrinsic stress, thin geometry, and weak coupling to undesired thermal modes Norte2016 ; Reinhardt2016 .
Microfabrication processes have so far restricted suspended PhC mirrors to areas around Chen2017 . This size sets an upper bound to the waist of incident Gaussian beams, since wider waists do not completely interact with the PhC, resulting in decreased reflectivity. But the waists also have a lower bound: very small waists have a high divergence and couple to undesired PhC modes, which leads to shifting, broadening and shallowing of the high-reflectivity crystal resonance. These adverse finite-size effects have been consistently measured in very thin mirrors with thicknesses below , where is the wavelength of the reflected light Bernard2016 ; Kemiktarak2012 ; Norte2016 ; Bui2012 . The ability to fabricate larger PhC mirrors with increasingly thinner membranes could greatly facilitate the combination of high reflectivity and low mechanical losses Norte2016 . These properties indicate the potential that PhC mirrors may have for reducing thermal mirror coating noise which stands as a limit in precision measurements such as atomic clocks Campbell2017 , frequency-stabilized lasers Kessler2012 , and gravitational wave detectors Reid2016 . At the centimeter scale, PhC mirrors could have more immediate applications as deformable mirrors with adjustable wavefront Madec2012 , or evanescent field sensors with a large interaction area Schmid2009 ; Fan2009 .
In this letter we experimentally demonstrate free-standing SiN photonic crystal mirrors with thicknesses of and and areas of up to . Not only do we increase the area of suspended PhC mirrors by nearly 4 orders of magnitude compared to previous works, we also show that these large aspect-ratios allow us to achieve high reflectivity from membranes thinner than previously measured. We observe greater than reflectivity of light from mirrors with a thickness of () – a significant increase compared to previous devices with similar thickness and wavelength Bernard2016 . Such large structures allow studying the spectrum of PhC membranes as a function of incident beam waist with less constraints from finite size effects.
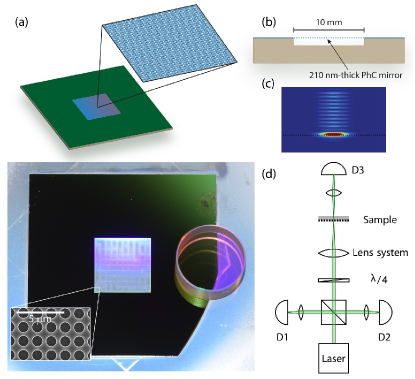
Our suspended PhC mirrors are fabricated from high-stress () LPCVD SiN films deposited on Si wafers. The geometry of the PhC structures is optimized for each desired film thickness to a wavelength of using finite-difference time-domain (FDTD) simulations Fan2002 . The structures are patterned on the SiN films using electron beam lithography and a plasma etching process (). Stitching errors occur about every millimeter due to stage drifts during the beamwrite and are on the order of wide. One of the fundamental challenges for large aspect-ratio membranes is suspending them without causing any fractures. Typically liquid etchants such as KOH or TMAH are used to release free-standing SiN structures from their Si substrates. However, such wet processes produce a number of forces, like turbulences and surface-tension at the interfaces, which can easily destroy the fragile suspended PhC mirrors. These methods also leave residues that negatively impact the optical performance of the mirrors, requiring additional liquid cleaning steps that decrease the the fabrication yield, specially for large area devices Norte2014 . In order to overcome these limitations, we have developed a stiction-free RIE-ICP plasma release using Patent2017 . A hot piranha solution consisting of sulfuric acid and hydrogen peroxide is first used to remove surface contaminations on the unreleased structures. This is followed by a diluted HF solution to smoothen the SiN surface Ji2017 and remove surface-oxide from the silicon which allows for an even release of the membrane. Finally, we suspend the PhC mirrors using the plasma release. Figures 1(a)-(c) show a sketch and a photograph of a -wide, -thin mirror, a scanning electron microscope picture of the PhC pattern, and numerical simulations of the reflected optical field.
In order to characterize the optical properties of the PhCs, we fabricate three devices with different thickness and size: two -thick mirrors, and -large; and a -thick, -large one. We measure the mechanical spectrum of the fabricated devices to match those of bare square membranes with the same intrinsic stress. This indicates that despite the unconventionally large areas, the material stress remains high, which should guarantee the membrane’s flatness, an important point when developing high reflectivity mirrors. This is also a relevant observation when estimating the thermal displacement noise of this type of device. More details can be found in Appendix B.
The devices are characterized by focusing a wavelength-tunable laser beam perpendicular to the PhC mirrors (Fig. 1(d)). We measure the reflected and transmitted power and compare it to a reference beam that does not interact with the devices. For calibration, we use a commercial broadband mirror at the same position as the PhC mirrors. The laser is tuned from to . The recorded signal is normalized to the reference arm and to the calibration mirror to obtain the reflectivity spectra for multiple beam waists. We vary the beam radius between and using a lens system placed in front of the PhC membranes. This allows us to analyze the behavior of PhC membranes with different thicknesses to laser beams of varying sizes.
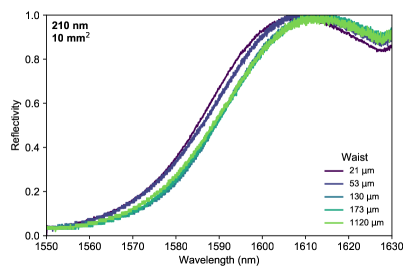
Figure 2 shows a selection of measured spectra of the -thick, -large and the -thick devices. While the PhC is completely released, for testing purposes the chip itself is not fully etched through (cf. Fig. 1(b)). This results in a parasitic interference pattern with a periodicity of on top of the expected PhC spectra, corresponding to a -thick Si etalon. Since the frequency of this interference is well defined, we post-process it by band-pass filtering the data. Appendix C contains the full set of acquired spectra, as well as a detailed description of the data processing.
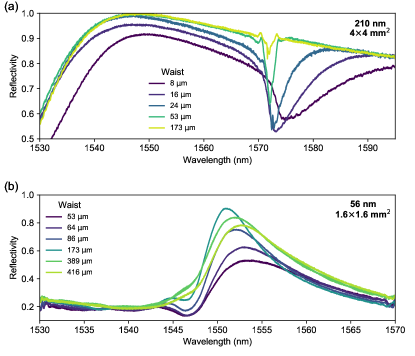
The spectra of the -thick PhC mirror, shown in Fig. 2(a), exhibit a resonance at that varies little with the incident beam waist. At a parasitic resonance emerges whose width increases as the waist becomes smaller. This can be understood by considering the decomposition of a Gaussian beam with waist into plane waves Born1986 . The decomposition in terms of incidence angle is weighted by a Gaussian distribution with a standard deviation equal to the beam divergence . A large waist has a small divergence , which is a good approximation to a plane wave with a zero angle of incidence. As decreases, becomes larger, and so plane waves with larger angles of incidence have a stronger weight on the decomposition. These waves can couple to PhC modes other than the resonance of interest, giving rise to parasitic features such as the one observed. We can apply the same reasoning to explain the increase in maximum reflectivity of the main resonance: the device geometry was optimized assuming a plane wave with normal incidence. Hence, beams with a large waist approximate this condition better, which results in a reflectivity closer to the optimized one.
In Fig. 2(b) we observe that the main resonance of the -thick membrane exhibits stronger shifts in wavelength, width and maximum reflectivity with varying beam waist, in comparison to the -thick device. As explained in the work of Bernard et al. Bernard2016 , the spectral response of plane waves incident on a PhC mirror depends on the angle of incidence. This dependence is stronger for thinner devices and results in large resonance wavelength shifts. Therefore, as the beam waist decreases – and its divergence increases – the reflectivity of thin devices is more strongly attenuated. On the other hand, due to the small size of the -thick PhC mirror (area of vs. for the -thick device) beams with waists larger than are partially scattered outside the PhC and exhibit a decreasing maximum reflectivity (see below).
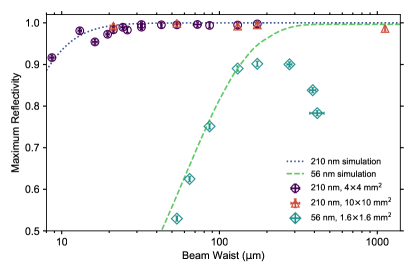
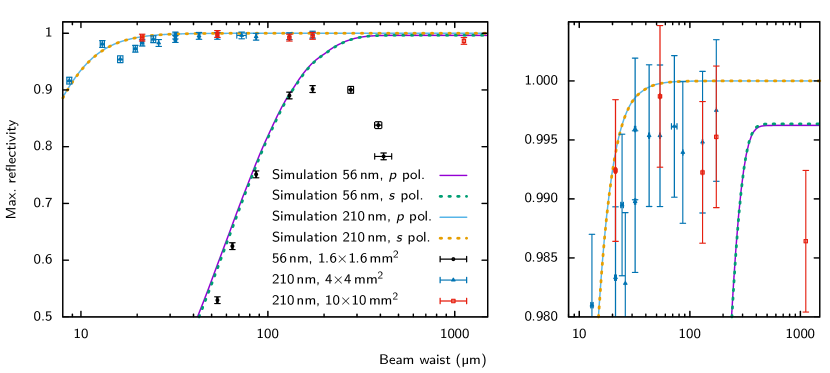
Figure 3 shows the maximum reflectivity of all PhC membranes as a function of the incident beam waist. As described in the previous paragraphs, larger beam waists approximate the design conditions of the PhCs better, reducing the amount of light that couples to unwanted modes. As such, the maximum reflectivity increases for larger beams. We verify this behavior with simulations and plane wave decomposition: starting with the geometry parameters that resulted from the FDTD optimization and that were patterned on the SiN membranes, we simulate the reflectivity of plane waves with varying angles of incidence at the resonance wavelength using rigorous coupled-wave analysis (RCWA) Moharam1981 . The reflectivity at each beam waist is then the weighted sum of the simulation results, following a Gaussian distribution with standard deviation , which is further described in Appendix D.
The reflectivity of the -thick PhC mirror decreases when the beam radius measures between and . Considering that the field amplitude of a Gaussian beam falls as , where is the distance from the beam’s center, we expect of the field to be within a diameter of . Since the PhC measures , beams with waists larger than will have larger field components reflecting off the area outside the PhC. This allows us to observe a smooth transition between two regimes: one, for small waists, where the PhC response is limited by a large beam divergence and another one for large waists, where the limitation is the finite size of the device. Between these two bounds we see a plateau where the maximum reflectivity is approximately constant. To the best of our knowledge, this is the highest reported reflectivity of a suspended PhC mirror, operating in a regime with lower beam divergence and finite size limits.
In conclusion, we fabricate and characterize the first suspended PhC mirrors that span areas up to square-centimeters, with reflectivities exceeding , which are only limited by our measurement precision. Previous attempts focused on devices not wider than , resulting in strong limits to the maximum achievable reflectivity, in particular for devices thinner than . By measuring the reflectivity spectrum of the PhC mirrors for varying incident beam waists, our work shows that these devices are indeed strongly affected by finite size effects. In particular, we observe a reflectivity of for a -thick PhC mirror at a wavelength of , whereas previous reports of devices with similar thickness were limited to Bui2012 ; Bernard2016 . Despite the presence of fabrication errors in the lithography process for the largest device (see Fig. 1(a)), we suspect that its performance becomes insensitive to small defects in the PhC lattice for large beam waists, since the reflectivity shows no appreciable changes with increasing waists (see Fig. 3, 210 nm data). Since larger incident beams sample a larger area of the PhC structure, we observe that the reflectivity seems robust to imperfections in the 2D array of holes that arise from drifts or poor stitching during lithography. It is also important to note that these mirrors could be improved even further with more sophisticated methods of lithography. Electron beam lithography is prone to stage drifts during exposure and secondary back-scattering of electrons from the substrate which produce uneven dosing – both of these effects can lead to an inhomogeneous lattice constant and variations in hole size. We envision scaling these devices further to full wafer sizes by using techniques such as nano-imprint lithography, lithography stepping, or interference lithography Lu2010a .
Due to its high intrinsic stress, LPCVD SiN PhC membranes should remain relatively flat even at larger areas. Together with the low optical absorption of SiN, this is a promising platform for light sails in future space probes propelled by light, such as the Breakthrough Initiative Starshot Starshot2017 . In addition, high-stress SiN membranes have been shown to have high thermal noise suppression which becomes better with thinner, larger membranes Norte2016 . At large scales, SiN PhCs could thus be an interesting route towards low-noise suspended mirror coatings. In Appendix E, we include a first-order estimate of the thermal displacement noise such devices would have, and make a baseline comparison of their performance to the well-documented mirror coatings used on LIGO test-masses.
Furthermore, the fact that these mirrors are suspended allows them to be used in a variety of applications that profit from mechanical tuning of mirrors. Deformable mirrors could be realized with these PhC structures Madec2012 , for example through electrostatic-tuning with arrays of electrodes close to the mirror, or even as displacement noise tunable mirrors, using techniques such as optomechanical feedback control Wiseman1994 . Further experiments are planned to study the transversal mode composition of the reflected beam and to properly characterize the devices’ optical absorption and scattering using a high finesse optical cavity. These developments open up a new paradigm in photonics – one that steers away from the focus on simply miniaturizing components, but instead tries to bring the performance of nano-engineered materials to large scales.
Acknowledgements.
We thank F. Alpeggiani, P. Klupar, A. Loeb, and P. Worden for helpful discussions. We also acknowledge valuable support from the Kavli Nanolab Delft, in particular from C. de Boer and M. Zuiddam. This project was supported by the European Research Council (ERC StG Strong-Q) and by the Netherlands Organisation for Scientific Research (NWO/OCW), as part of the Frontiers of Nanoscience program.References
- (1) S. Fan and J. D. Joannopoulos, Analysis of guided resonances in photonic crystal slabs, Phys. Rev. B 65, 235112 (2002).
- (2) M. Kanskar, P. Paddon, V. Pacradouni, R. Morin, A. Busch, J. F. Young, S. R. Johnson, J. MacKenzie, and T. Tiedje, Observation of leaky slab modes in an air-bridged semiconductor waveguide with a two-dimensional photonic lattice, Appl. Phys. Lett. 70, 1438–1440 (1997).
- (3) F. Lu, F. G. Sedgwick, V. Karagodsky, C. Chase, and C. J. Chang-Hasnain, Planar high-numerical-aperture low-loss focusing reflectors and lenses using subwavelength high contrast gratings, Opt. Express 18, 12606–12614 (2010).
- (4) D. Fattal, J. Li, Z. Peng, M. Fiorentino, and R. G. Beausoleil, Flat dielectric grating reflectors with focusing abilities, Nat. Photon. 4, 466–470 (2010).
- (5) J. Guo, R. A. Norte, and S. Gröblacher, Integrated optical force sensors using focusing photonic crystal arrays, Opt. Express 25, 9196–9203 (2017).
- (6) X. Chen, C. Chardin, K. Makles, C. Caër, S. Chua, R. Braive, I. Robert-Philip, T. Briant, P.-F. Cohadon, A. Heidmann, T. Jacqmin, and S. Deléglise, High-finesse Fabry-Perot cavities with bidimensional Si3N4 photonic-crystal slabs, Light Sci. Appl. 6, e16190 (2017).
- (7) R. A. Norte, J. P. Moura, and S. Gröblacher, Mechanical resonators for quantum optomechanics experiments at room temperature, Phys. Rev. Lett. 116, 147202 (2016).
- (8) C. Reinhardt, T. Müller, A. Bourassa, and J. C. Sankey, Ultralow-noise SiN trampoline MEMS for sensing and optomechanics, Phys. Rev. X 6, 021001 (2016).
- (9) S. Bernard, C. Reinhardt, V. Dumont, Y.-A. Peter, and J. C. Sankey, Precision resonance tuning and design of sin photonic crystal reflectors, Opt. Lett. 41, 5624–5627 (2016).
- (10) U. Kemiktarak, M. Durand, M. Metcalfe, and J. Lawall, Cavity optomechanics with sub-wavelength grating mirrors, New J. Phys. 14, 125010 (2012).
- (11) C. H. Bui, J. Zheng, S. W. Hoch, L. Y. T. Lee, J. G. E. Harris, and C. W. Wong, High-reflectivity, high-Q micromechanical membranes via guided resonances for enhanced optomechanical coupling, Appl. Phys. Lett. 100, 021110 (2012).
- (12) S. L. Campbell, R. B. Hutson, G. E. Marti, A. Goban, N. Darkwah Oppong, R. L. McNally, L. Sonderhouse, J. M. Robinson, W. Zhang, B. J. Bloom, and J. Ye, A Fermi-degenerate three-dimensional optical lattice clock, Science 358, 90–94 (2017).
- (13) T. Kessler, C. Hagemann, C. Grebing, T. Legero, U. Sterr, F. Riehle, M. J. Martin, L. Chen, and J. Ye, A sub-40-mHz-linewidth laser based on a silicon single-crystal optical cavity, Nat. Photon. 6, 687–692 (2012).
- (14) S. Reid and I. W. Martin, Development of mirror coatings for gravitational wave detectors, Coatings 6, 61 (2016).
- (15) P.-Y. Madec, Overview of deformable mirror technologies for adaptive optics and astronomy, in Adaptive Optics Systems III, , vol. 8447 (SPIE, 2012), vol. 8447, pp. 844705–1–18.
- (16) J. H. Schmid, W. Sinclair, J. García, S. Janz, J. Lapointe, D. Poitras, Y. Li, T. Mischki, G. Lopinski, P. Cheben, A. Delâge, A. Densmore, P. Waldron, and D.-X. Xu, Silicon-on-insulator guided mode resonant grating for evanescent field molecular sensing, Opt. Express 17, 18371–18380 (2009).
- (17) X. Fan, ed., Advanced Photonic Structures for Biological and Chemical Detection (Springer-Verlag, 2009), 1st ed.
- (18) R. A. Norte, Nanofabrication for on-chip optical levitation, atom-trapping, and superconducting quantum circuits, Ph.D. thesis, California Institute of Technology (2014).
- (19) Method for fabrication of large-aspect-ratio nano-thickness mirrors, Patent pending.
- (20) X. Ji, F. A. S. Barbosa, S. P. Roberts, A. Dutt, J. Cardenas, Y. Okawachi, A. Bryant, A. L. Gaeta, and M. Lipson, Ultra-low-loss on-chip resonators with sub-milliwatt parametric oscillation threshold, Optica 4, 619–624 (2017).
- (21) M. Born and E. Wolf, Principles of Optics (Pergamon Press, 1986), 6th ed.
- (22) M. G. Moharam and T. K. Gaylord, Rigorous coupled-wave analysis of planar-grating diffraction, J. Opt. Soc. Am. 71, 811–818 (1981).
- (23) C. Lu and R. H. Lipson, Interference lithography: a powerful tool for fabricating periodic structures, Laser Photon. Rev. 4, 568–580 (2010).
- (24) Breakthrough Initiative – Starshot, https://breakthroughinitiatives.org/Initiative/3. Accessed January 2018.
- (25) H. M. Wiseman, Quantum theory of continuous feedback, Phys. Rev. A 49, 2133–2150 (1994).
- (26) S. Chakram, Y. S. Patil, L. Chang, and M. Vengalattore, Dissipation in ultrahigh quality factor SiN membrane resonators, Phys. Rev. Lett. 112, 127201 (2014).
- (27) M. Aspelmeyer, T. J. Kippenberg, and F. Marquardt, Cavity optomechanics, Rev. Mod. Phys. 86, 1391 (2014).
- (28) D. R. Rhodes, On a fundamental principle in the theory of planar antennas, Proc. IEEE 52, 1013–1021 (1964).
- (29) V. Liu and S. Fan, S4: A free electromagnetic solver for layered periodic structures, Comput. Phys. Commun. 183, 2233–2244 (2012).
- (30) The LIGO Scientific Collaboration, Advanced LIGO, Class. Quantum Grav. 32, 074001 (2015).
- (31) P. R. Saulson, Thermal noise in mechanical experiments, Phys. Rev. D 42, 2437 (1990).
- (32) D. J. Wilson, Cavity optomechanics with high-stress silicon nitride films, Ph.D. thesis, California Institute of Technology (2012).
- (33) S. Schmid, K. D. Jensen, K. H. Nielsen, and A. Boisen, Damping mechanisms in high-Q micro and nanomechanical string resonators, Phys. Rev. B 84, 165307 (2011).
- (34) M. Bao, H. Yang, H. Yin, and Y. Sun, Energy transfer model for squeeze-film air damping in low vacuum, J. Micromech. Microeng. 12, 341–346 (2002).
Appendix A: Setup
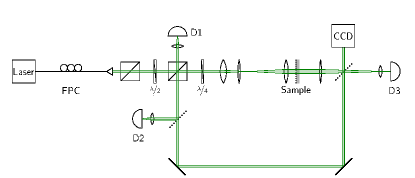
In order to characterize the optical properties of the PhCs, we use the setup outlined in Fig. A1. A fiber coupled Santec TSL510 wavelength-tunable laser is used as a light source. Its polarization is adjusted with a fiber polarization controller (FPC) and the beam is brought into free-space using a triplet collimator (Thorlabs TC12APC-1550). The first polarization beam splitter (PBS) is used as a polarizer to mitigate the effect of polarization drifts in the fiber part of the setup. The second PBS splits light into the beam that is going to interact with the sample (incident beam), and a reference beam that is detected by D1. We use the reference beam to remove the effect of power oscillations from the measured spectra that are not related to the sample. Between the two PBSs we place a half-waveplate () to control the power ratio between the incident and reference beams. After the second PBS, the incident beam is focused onto the sample using a lens set (between 1 and 3 lenses) which are adjusted to change the waist from to . Light reflected by the sample is sent into the second PBS. We place a quarter-waveplate () in the incident beam path such that the reflected beam is separated from the incident beam by the PBS and then detected by D2. Light transmitted by the sample is recorded by D3.
For every lens system a commercial broadband-coated mirror is placed at the sample position and record reference and reflection spectra. These serve as calibration and remove effects such as losses in the optical path from the sample reflectivity spectra. The sample is then placed back and care is taken to ensure good tip/tilt alignment with respect to the optical beam, since the response of the PhC is very sensitive to the incident angle. Using flip mirrors we are also able to send the transmitted or reflected beam into an infra-red CCD. The camera helps during the tip/tilt alignment of the sample, or acts as a reference during the alignment of the lens system.
The reflectivity spectrum is calculated as
where and are the voltage signals of the reflected beams from the PhC and the calibration mirror, and are the reference signals of the corresponding PhC and calibration mirror measurements, and is the reflectivity of the calibration mirror, which is specified to be . We consider all measurement uncertainties to be independent from each other, and estimate the uncertainty in reflectivity via the method of uncertainty propagation
where .
To estimate the uncertainty of the beam waist, the same propagation method was applied. As uncertainty parameters, the position of each lens (with a count varying between 1 and 3) and its focal length is taken into account. The beam was propagated through the lens system by means of the complex beam parameter and ABCD matrices.
The photodetectors D1, D2, D3 are home-built surface-mount-device circuits equipped with a JDSU ETX500 photodiode. By means of electronic design and spectral characterization, a linear response to the optical input power is guaranteed.
Appendix B: Mechanical modes of PhC mirror
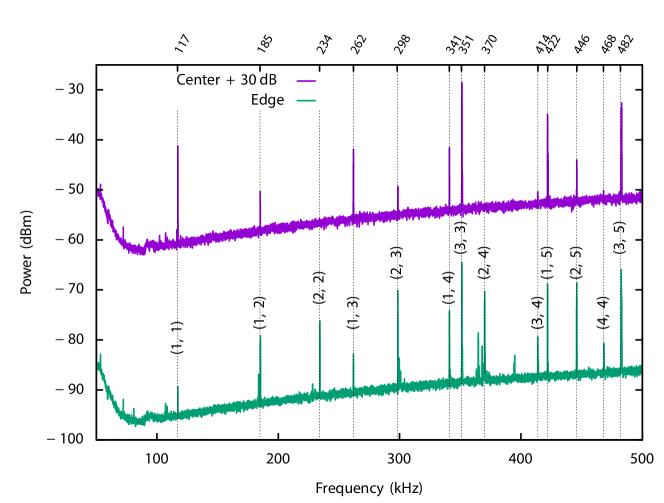
In order to get a better understanding of the mechanical properties of the PhC mirrors, a displacement spectrum was recorded for a mirror. The device was mounted in a vacuum chamber and a homodyne detector measured the phase quadrature of the back reflected light. Figure A2 shows a spectrum recorded in the center of the mirror and another spectrum measured at the edge of it. The off-center spectrum displays mechanical modes which have no net-effect on centered beams, i.e. modes which are mirror symmetric on two orthogonal axes. The fundamental mechanical frequency of a bare square membrane is given by
| (A1) |
where is the length the membrane, is the material density ( for SiN), and is the tensile pre-stress in the film, which we take to be , a value defined by the parameters of the LPCVD deposition process. A square membrane with the same dimensions and material properties as the one discussed here has a fundamental frequency of . Comparing this to the value measured for our device () leads us to conclude that the pre-stress remains high even for these unconventionaly large suspended areas.
To simplify the analysis, we model the structure as a simple square membrane without holes.
Starting from the fundamental mode frequency of the device, we can calculate the frequencies of all higher-order modes Chakram2014 , which we plot on the upper horizontal axis in Fig. A2. We observe a very accurate fit of the measured higher-order modes (the deviation is around ). The measured spectrum also allows to predict the noise performance of an optical cavity made with such PhC mirrors Aspelmeyer2014 .
Appendix C: Post-processing of spectral data
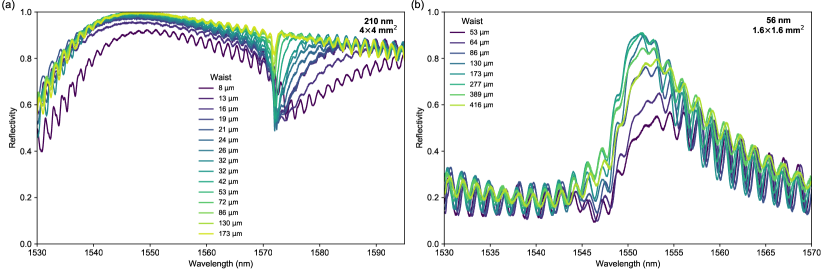
Figure A3 shows the full, unprocessed set of measured reflectivity spectra for the (a) and (b) -thick devices. We measured the spectra for several incident beam waists, which are indicated in the figure legends. The spectra follow the expected Fano resonance shape, characteristic for this type of device.
In addition, we also see a parasitic oscillation with a periodicity of . This is because the devices are suspended but the substrate is not etched through. In fact, to facilitate the testing process, the membranes are undercut by only a few on top of the silicon substrate (cf. Fig. 1(b)). The observed periodic pattern arises from interference of reflections from the substrate interfaces. Using the thickness of the silicon substrate and a refractive index of , we calculate a free spectral range of for a wavelength of , which is in excellent agreement with the observed oscillations. The periodicity observed on the measured spectra is equal for all measurements and as such, we remove it digitally using the procedure described below.
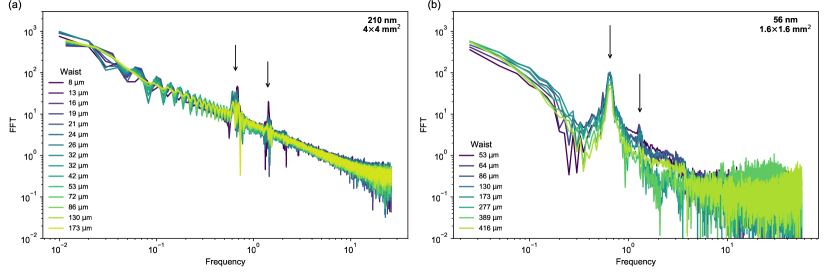
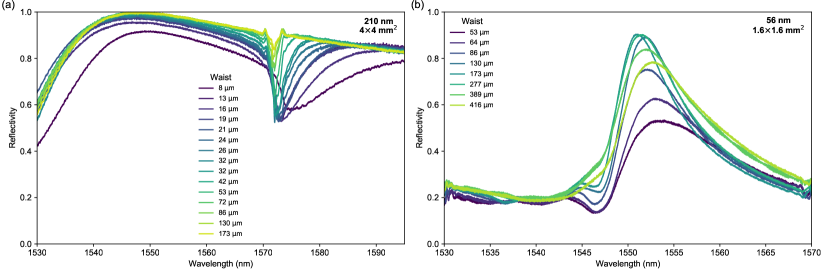
The Fourier transformations of the unprocessed reflectivity spectra show peaks (marked by the arrows in Fig. A4) that are well defined and common to all measurements, which we associate with the described etalon effect. These are obtained with the fft.rfft and fft.rfftfreq commands of the Python numpy library. To remove these parasitic features from the Fourier transforms, we apply a Tukey filter, with filter parameter , around the identified peaks. The filter was generated using the function signal.tukey from the scipy library. Finally, the filtered spectra are obtained by performing the inverse Fourier transform using the fft.irfft command. These can be seen in Fig. A5. We carefully verify that filtering does not change the reading of the maximum reflectivity.
Figure A6 shows the raw data of the -thick, -wide device. This device was attached to a single-side polished carrier wafer using an index matching oil. Since the bottom surface of the substrate is rough, the interference between interfaces is no longer visible. Therefore this data set did not require any post-processing.
Appendix D: Simulated reflectivity spectra for Gaussian beams
To simulate the expected reflectivity spectra of the PhC membranes, we use a rigorous coupled wave analysis (RCWA) Moharam1981 combined with a plane wave decomposition Rhodes1964 . On the one hand, choosing a RCWA implies that the simulated spectra are valid only for periodic structures, i.e. spectral changes caused by diffraction effects at the membrane’s edge cannot be recreated. As this approach commonly starts with a plane wave as the incident electromagnetic field, it also requires to implement a composition of plane wave spectra when dealing with Gaussian beams. On the other hand, a finite element analysis (FEA) can in principle be set up to compute spectra of a finite, e.g. large, PhC membrane excited by a Gaussian beam of waist . However, the simplicity of a FEA approach has disadvantages when it comes to hardware, especially memory, requirements. To faithfully simulate the structure, the model volume has to cover about and still capture the details of the nano-scale membrane, which increases the memory usage drastically. A RCWA only discretizes the actual PhC membrane, such that the reflected field can be retrieved at any point above or below the structure. Finally, having simulated a set of plane waves via RCWA allows to assemble Gaussian beams of any size. For our requirements, the RCWA approach therefore is most appropriate.
We simulate two different unit cells:
-
•
thick, lattice constant , hole radius
-
•
thick, lattice constant , hole radius .
Each cell, composed of 140 modes, is excited at a certain wavelength with plane waves of various polar and azimuthal angles of incidence. To verify that the structure is polarization insensitive, the wavelength- and angle scan is conducted for both - and -polarization. The simulation is built around an open source RCWA package Liu2012 , which rotates the and component of the incident field with respect to the incident angles. To align the polarization uniformly for all angles, the - and -electric field component are transformed as
| (A2a) | ||||
| (A2b) | ||||
and
| (A3a) | ||||
| (A3b) | ||||
for a - and -polarized beam, respectively. Here the polar angle is denoted by , while is the azimuthal angle. This set of transformations inverts the global rotation implemented in the software package.
Having computed the reflection coefficients for a plane wave, the reflectivity of a Gaussian beam with the electric field distribution
| (A4) |
at the waist position () is obtained by weighting the reflection coefficients according to the plane wave decomposition
| (A5) |
Transforming the expression to spherical coordinates, the power reflectivity spectra are computed via
| (A6) |
Figure A7 illustrates the results of the simulations for a and unit cell with the parameters given above. Due to a small mismatch in the cell parameters the absolute resonance frequency of the measured and simulated spectra deviate from each other slightly, however the overall features of the measurement are recreated faithfully. The individual simulations of - and -polarization exhibit virtually no difference, which is important as we probe the membranes with a circularly polarized beam. From the data plotted in Fig. A7, the maximum achievable reflectivity can be readily extracted by determining the peak reflectivity for each wavelength and beam waist scan. In figure A8 the results from the main text are plotted again and the simulated maximum reflectivity is shown for both polarizations. A zoom into the last two percent helps reading out the measured values.
Appendix E: Estimation of thermal displacement noise
Thermal mirror coating noise is currently one of the main limitations to the sensitivity of high-precision experiments including atomic clocks, frequency stabilized lasers and gravitational wave detectors. Widely used in these communities are distributed Bragg reflector (DBR) coatings made of alternating layers of dielectric materials. One challenge with DBR coatings is that their reflectivity has a natural trade-off with the number of layers used (and therefore the total thickness). Increases in coating thickness are usually associated with increases in coating’s thermal Brownian noise. Attaining high reflectivity requires DBR surfaces which are commonly microns thick, while PhC mirrors can realize similarly high reflectivities with a membrane which is only the thickness of a single DBR layer. Additionally, their suspended geometry makes them into an easily deformable mirror surface, which potentially provides mechanical isolation from substrate (i.e. test mass) noise, and the possibility to dynamically tune the mechanical properties using optomechanical techniques.
In order to assess the potential that suspended PhC membranes could have in these types of applications, we perform a simplified calculation of the thermal noise performance of suspended PhC mirrors in this section and compare it to the thermal coating noise of the a-LIGO experiment LIGO2015 .
For large LPCVD SiN mirrors we estimate the biggest noise contribution to be due to the thermal displacement noise, which for a square membrane is given by Saulson1990
| (A7) |
where is the mechanical quality factor, the Boltzmann constant, is the membrane’s temperature, the effective mass of the membrane’s fundamental mode, and its frequency given by Eq. (A1). The effective mass can be estimated with Wilson2012 , where is the physical mass. It is further reduced by a factor of , which accounts for the mass lost to the PhC holes.
There are numerous limiting factors to the mechanical quality of a membrane Schmid2011 ; Chakram2014 : thermoelastic damping, surface defects, Akhiezer damping, etc. For LPCVD SiN membranes, the most relevant factors are acoustic radiation losses and damping from collisions with gas particles. The acoustic radiation losses into the substrate generally scale as the ratio between and the thickness : Schmid2011 ; Chakram2014 . Considering previously measured radiation limited quality factors of for , we can extrapolate the radiation limit for arbitrary sizes of the PhC mirror. In addition, the quality factor limited by gas damping is given by Bao2002
| (A8) |
where is the ideal gas constant, is the pressure, and is the molecular mass of the background gas molecules. The final Q is given by , where are the various contributions mentioned above.
In order to estimate the thermal displacement noise of suspended PhC mirrors, we need to assume some parameters. We chose those of the a-LIGO experiment, since its DBR coated mirrors are well known and characterized in terms of noise properties. This allows us to make a first-order comparison of how suspended PhC mirrors would operate when scaled up to the same size of the a-LIGO mirrors.
We take a SiN film thickness of , a lateral size mm, and effective mass mg. We assume the mirrors are placed in a vacuum chamber at room temperature with a pressure of hPa and that the main background gas component is hydrogen LIGO2015 . These parameters result in a fundamental mechanical frequency of Hz and a pressure-limited fundamental mode mechanical quality factor . Considering a detection frequency of Hz, we find a thermal displacement noise of around . For comparison, the thermal coating noise of the mirrors used in a-LIGO is of the order of .
These estimates are mainly limited by the environment pressure, which sets an upper bound to the mechanical quality factor. By decreasing the pressure further it could be possible to improve the thermal displacement noise significantly. Furthermore, suspended mirrors have the additional advantage that they can be adjusted, for example either through the addition of tuning electrodes or optomechanical techniques, in order to further reduce the noise performance in the desired regime.
It is important to note that the focus of this calculation is the estimation of thermal Brownian noise associated with the mirror coatings. The presented calculations and mirror designs are heuristic in nature and only allow one to make estimates comparing different mirror coating noise performances. It is however not entirely clear for example, how the Brownian noise related to the substrate (or test mass) would couple to such a suspended mirror. This could be relevant for monolithic cavities in quantum optomechanics experiments at room temperature, where substrate thermal noise is the dominant source of heating in laser cooling experiments Wilson2012 . In addition, it has been shown that at increasingly large aspect ratios the substrate thickness becomes a significant variable in a membrane’s mechanical quality factor Norte2016 . A massive substrate could work well in experiments which require large test masses. How these effects translate to the cm-scale remains an open question.