Production, Processing and Consumption of the Dust in the Galaxy
Abstract
The recent results obtained by the modern telescopes and spacecrafts allow us for the first time to compare directly the mass, spatial density and size distribution of the dust grains in the regions of their production, processing and consumption in our Galaxy. The ALMA and VLT/SPHERE telescopes allow us to estimate the production of the dust by supergiants and collapsing core supernovae. The 2MASS, WISE, SDSS, Planck and other telescopes allow us to estimate the processing of the dust in the interstellar medium. After renewed Besançon Galaxy model the medium appears to contain about half the local mass of matter (both baryonic and dark) in the Galactic neighborhood of the Sun. The Helios, Ulysses, Galileo, Cassini and New Horizons spacecrafts allow us to estimate the consumption of the dust into large solid bodies. The results are consistent each other assuming the local mean spatial density of the dust is about of g/cm3, mean density of the grain is about 1 g/cm3, and the dust production rate is about of 0.015 Solar mass per year for whole the Galaxy.
The dust grains are formed in the shells of branch red giants, asymptotic branch giants, supergiants, novae and collapsing core supernovae This is the production of the dust. Then in the interstellar medium some events lead to the growth of the dust particles whereas others lead to their fragmentation. This is the processing of the dust. Finally, we meet the dust on the Earth as a result of the formation of the stars and planets from the interstellar medium in past and the penetration of the dust particles into the Solar system from the interstellar medium in present. This is the consumption of the dust.
The production of dust by supergiants and collapsing core supernovae are particularly important since only this production by very massive stars can explain the large abundance of dust in high-z quasars. For a long time, the observable mass of the dust production were several orders of magnitude less than the theoretical estimates (Wesson et al. 2015). However, Matsuura et al. (2011), Matsuura et al. (2015) and Wesson et al. (2015) found the dust mass of in the ejecta of SN 1987A by use of the Herschel Space Observatory. Indebetouw et al. (2014) by use of ALMA telescope confirmed the condensation of more than 0.2 of carbon dust produced by SN 1987A for 25 years. A noticeable fraction of the dust particles larger than 2 micrometers proves the intensive growth of the grains in the ejecta. Such large grains must better survive during the transfer to the interstellar medium. Large grains with an average radius of 0.5 micrometers are also found by Scicluna et al. (2015) by use of the SPHERE instrument at the VLT telescope in the mass-loss envelope of the supergiant VY Canis Majoris.
Li et al. (2011) estimated the mean rate of collapsing core supernova in the Galaxy as 2.3 per century. If a typical supernova produces dust mass of 0.5 , then the medium is enriched with dust at a rate of 0.011 per year. Together with supergiants it gives the total production about 0.015 per year. At the Galactic star formation rate of about 1.6 a year (Licquia & Newman 2015) and the typical gas-to-dust ratio of 100, the star formation takes away from the medium about of 0.016 a year. Thus, the recent investigations proves the production and consumption balance.
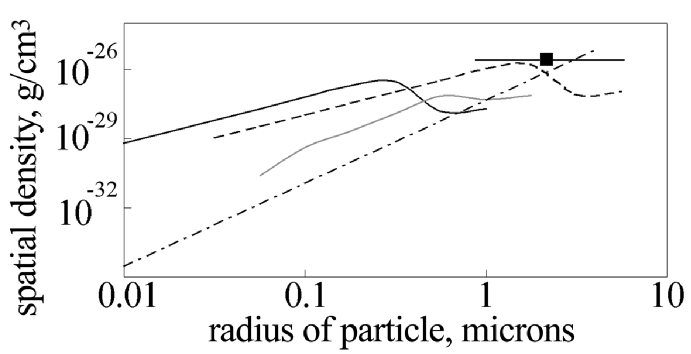
For further comparison we use the power law distribution of dust particles by size in the environment around the supernovae SN 2010jl, SN 1995N, SN 1998S, SN 2005ip and SN 2006jd found by Gall et al. (2014). Using the normalization of the dust spatial mass density of g/cm3 discussed later this distribution is shown by the dash-dotted line in Figure 1 and discussed further as the distribution of dust particles by size in the places of their production.
The mean density of the medium in the Galactic neighborhood within few hundred pc from the Sun has revised significantly in the last years: since 28% of the total mass of matter (local spatial mass density 0.02 ) by the old version of the Besançon model of the Galaxy (Robin et al. 2003) to 47% (0.05 ) by its new version (Czekaj et al. 2014) following Binney & Tremaine (2008). This increase of 2.5 times is explained by some discoveries of gas and dust far from the Galactic plane (McKee et al. 2015). Thus, the interstellar medium contains about half the local mass of matter (baryonic and dark) in the Galactic neighborhood of the Sun. It looks reasonable if we allow the current star formation from the medium. With the typical gas-to-dust ratio of 100 it means the local spatial mass density of dust , or g/cm3. This value is used further.
The distribution of dust grains on their size has been investigated by many authors (see review by Gontcharov (2016b)). Gorbikov & Brosch (2010), Planck Collaboration (2011), Davenport et al. (2014), Gontcharov (2012a, 2013a, 2013b, 2016a) and other authors have used the observations with Hipparcos (Tycho-2), 2MASS, SDSS, WISE, UKIDSS, Planck and other telescopes and showed that the familiar medium with extinction-to-reddening coefficient is valid only within 100 pc from the Galactic plane. But for the bulk of the nearby kiloparsec and all investigated regions of the Galaxy up to 25 kpc from the plane the observations better agree with the dust model by Weingartner & Draine (2001) with or even with a flat extinction law in infrared, at micrometers. It is supported by Miville-Deschenes et al. (2002) showing that in a typical low-density high-latitude clouds the relative velocities of typical grains of radius of about 0.1 micrometers are close to the critical (growth vs. fragmentation) speed of order of 1 km/s.
In particular, Gontcharov (2016a) found an overdensity of large grains () within 14 pc of the Solar system by use of the stellar photometry from the Tycho-2, 2MASS and WISE. The orientation of this overdensity fits 16-year Ulysses spacecraft’s dust detector data about invasion of the dust and gas flow into the Solar system (Krüger et al. 2015). The Galactic coordinates of the entry point (about , ) of this flow roughly correspond to the area of maximum concentration of dust in the Gould belt (, ) (Gontcharov 2012b). Probably, there is a relation between the dust in Gould belt, in the Local overdensity and in the Solar system.
I calculated the distribution of grains by size based on Mie theory (Bohren & Huffman 1983) and dust properties derived for the Local overdensity by Gontcharov (2016a). The mean physical density of 3 g/cm-3 was accepted for the grains as for silicates and graphite. I obtained the maximum of size distribution at 0.25 micrometers and related wavelength of the extinction maximum at 1.5 micrometers. This distribution is shown in Figure 1 by the solid black curve. It can be considered as the spatial mass distribution of grains by size in the interstellar medium.
However, there are some reasons (Dwek et al. 2007); (Bochkarev 2009) to believe that the mean physical density of grains is about 1 g/cm3. Some explanation is the models of fluffy, porous and/or icy grains (Zubko et al. 2004). With a fixed optical depth of the dust layer and a fixed spatial mass density of dust the decrease of the physical density of grains means the increase of their size. In the calculations based on Mie theory I found that to provide the extinction with the maximum at micrometers the grains with radius of micrometers and physical density of 3 g/cm3 can be replaced by the ones with radius of micrometers and physical density of 1 g/cm3. It means the shifted distribution shown in Figure 1 by black dotted line. This curve can be considered as the spatial mass distribution of dust particles by size in the interstellar medium, more realistic.
Based on the data of Ulysses (at 5 AU), Galileo (5 AU), Cassini (1–9.5 AU) and Helios (0.3–1 AU) spacecrafts Krüger et al. (2015) estimated the spatial density ( g/cm3) and size distribution of interstellar grains penetrating deep into the Solar system. This distribution is shown in Figure 1 by the solid gray curve and is considered as the one of the dust inside the solar system. This estimate is an order of magnitude less than the one for interstellar medium.
According to Poppe et al. (2010) the dust sensor aboard New Horizons spacecraft at heliocentric distances AU showed the spatial density of interstellar grains close to that of Ulysses, Galileo, Pioneer 10, Pioneer 11, Voyager 1 and Voyager 2. But for the distances AU New Horizons detected the mean spatial density of g/cm3 for interstellar grains of g (i.e. a radius of microns). This density is indicated in Figure 1 by the black square (horizontal line shows the uncertainty). It can be considered as the assessment of dust at the edge of the Solar system. Vertical shift in Figure 1 between the black square and gray curve reflect the slow decrease of the interstellar dust flow deeper in the Solar system.
1 Conclusions
The results summarized in Figure 1 show that processing of the dust grains in the local interstellar medium shifts their distribution to smaller grains, the spatial mass density of dust in the medium is consistent with the one in the outer regions of the Solar system, only a small portion of dust penetrates deeper to the system.
Acknowledgments
The study was financially supported by the “Transient and Explosive Processes in Astrophysics” Program P-7 of the Presidium of the Russian Academy of Sciences.
References
- Binney & Tremaine (2008) Binney, J., & Tremaine, S. 2008, Galactic Dynamics (Princeton University Press), 2d ed.
- Bochkarev (2009) Bochkarev, N. G. 2009, Basic physics of the interstellar medium (Moscow: LIBROKOM), in Russian, p. 296
- Bohren & Huffman (1983) Bohren, C. F., & Huffman, D. R. 1983, Absorption and scattering of light by small particles (New York: John Wiley & Sons)
- Czekaj et al. (2014) Czekaj, M. A., Robin, A. C., Figueras, F., Luri, X., and Haywood, M. 2014, A&A, 564, A102
- Davenport et al. (2014) Davenport, J. R. A., Ivezic, Z., Becker, A. C., et al. 2014, MNRAS, 440, 3430
- Dwek et al. (2007) Dwek, E., Galliano, F., & Jones, A. P. 2007, ApJ, 662, 927
- Gall et al. (2014) Gall, C., Hjorth, J., Watson, D., et al. 2014, Nature, 511, 326
- Gontcharov (2012a) Gontcharov, G. A. 2012a, Astronomy Letters, 38, 12
- Gontcharov (2012b) Gontcharov, G. A. 2012b, Astronomy Letters, 38, 87
- Gontcharov (2013a) Gontcharov, G. A. 2013a, Astronomy Letters, 39, 83
- Gontcharov (2013b) Gontcharov, G. A. 2013b, Astronomy Letters, 39, 550
- Gontcharov (2016a) Gontcharov, G. A. 2016a, Astronomy Letters, 42, 445
- Gontcharov (2016b) Gontcharov, G. A. 2016b, Astrophysics, 59, 617
- Gorbikov & Brosch (2010) Gorbikov, E., & Brosch, N. 2010, MNRAS 401, 231
- Indebetouw et al. (2014) Indebetouw, R., Matsuura, M., Dwek, E., et al. 2014, ApJ, 782, L2
- Krüger et al. (2015) Krüger, H., Strub, P., Grün, E., Sterken, V.J. 2015, ApJ, 812, 139
- Li et al. (2011) Li, W., Chornock, R., Leaman, J., Filippenko, A.V., Poznanski, D., Wang, X., Ganeshalingam, M., Mannucci, F. 2011, MNRAS 412, 1473
- Licquia & Newman (2015) Licquia, T.C., Newman, J.A. 2015, ApJ, 806, 96
- Matsuura et al. (2011) Matsuura, M., Dwek, E., Meixner, M., et al. 2011, Science, 333, 1258
- Matsuura et al. (2015) Matsuura, M., Dwek, E., Barlow, M.J., et al. 2015, ApJ, 800, 50
- McKee et al. (2015) McKee, C.F., Parravano, A., & Hollenbach, D.J., 2015, ApJ, 814, 13
- Miville-Deschenes et al. (2002) Miville-Deschenes, M.-A., Boulanger, F., Joncas, G., Falgarone, E. 2002, A&A, 381, 209
- Planck Collaboration (2011) Planck Collaboration 2011b, A&A, 536, A24
- Poppe et al. (2010) Poppe, A., James, D., Jacobsmeyer, B., Horanyi, M. 2010, Geophysical Research Letters, 37, L11101
- Robin et al. (2003) Robin, A. C., Reyle, C., Derriere, S., & Picaud, S. 2003, A&A, 409, 523
- Scicluna et al. (2015) Scicluna, P., Siebenmorgen, R., Wesson, R., Blommaert, J. A. D. L., Kasper, M., Voshchinnikov, N. V., Wolf, S. 2015, A&A, 584, L10
- Weingartner & Draine (2001) Weingartner, J. C., & Draine, B. T. 2001, ApJ, 548, 296
- Wesson et al. (2015) Wesson, R., Barlow, M. J., Matsuura, M., Ercolano, B. 2015, MNRAS, 446, 2089
- Zubko et al. (2004) Zubko, V., Dwek, E., Arendt, R. G. 2004, ApJS, 152, 211