On the Possibility of Fast Radio Bursts from Inside Supernovae: The Case of SN 1986J
Abstract
We discuss the possibility of obtaining Fast Radio Bursts (FRBs) from the interior of supernovae, in particular SN 1986J. Young neutron stars are involved in many of the possible scenarios for the origin of FRBs, and it has been suggested that the high dispersion measures observed in FRBs might be produced by the ionized material in the ejecta of associated supernovae. Using VLA and VLBI measurements of the Type IIn SN 1986J, which has a central compact component not so far seen in other supernovae, we can directly observe for the first time radio signals which originate in the interior of a young (30 yr old) supernova. We show that at age 30 yr, any FRB signal at 1 GHz would still be largely absorbed by the ejecta. By the time the ejecta have expanded so that a 1-GHz signal would be visible, the internal dispersion measure due to the SN ejecta would be below the values typically seen for FRBs. The high dispersion measures seen for the FRBs detected so far could of course be due to propagation through the intergalactic medium provided that the FRBs are at distances much larger than that of SN 1986J, which is 10 Mpc. We conclude that if FRBs originate in Type II SNe/SNRs, they would likely not become visible till yr after the SN explosion.
1 Introduction
Fast Radio Bursts (FRBs) are bursts of radio emission, 0.1 to 10 Jy at 1 GHz, which occur on timescales of milliseconds or less. They are characterized by high dispersion measures (DM) in the range of 375 to 1700 cm-3 pc. Their origin is still mysterious (for recent reviews, see e.g., Katz, 2016a; Petroff et al., 2016; Thornton et al., 2013). They have mostly been detected with single-dish telescopes with low (arc-minute) resolution111Recently, Caleb et al. (2017) reported the interferometric detection of several FRBs using the Molongolo Observatory Synthesis Telescope, but the bursts are only localized to an area of 11 arcmin2, too large to reliably identify a host galaxy., hence counterparts are not readily identified. Although Keane et al. (2016) suggested that FRB 150418 was associated with a radio “afterglow” in an elliptical galaxy at redshift, , Williams & Berger (2016) and Vedantham et al. (2016) showed that the “afterglow” emission was probably due to AGN variability and not to the FRB, and that the exact location of FRB 150418 is thus still not known.
So far, only one, FRB 121102, has been found to repeat (Spitler et al., 2016), and consequently it was possible to localize it, to dwarf galaxy at (Chatterjee et al., 2017; Tendulkar et al., 2017). A persistent radio counterpart was identified, and studied using VLBI by Marcote et al. (2017). To date, FRB 121102 remains the only FRB which repeats and the only one that is well localized. Its DM, after subtraction of the Galactic component, is cm-3 pc (Scholz et al., 2016), and it has stayed constant over a period of 3 yr.
At the time of writing, 23 FRBs are known222See http://www.astronomy.swin.edu.au/pulsar/frbcat/ (Petroff et al., 2016).. Of these, 17 are at Galactic latitudes, . The DMs of the FRBs at are far higher than expected from our own Galaxy’s interstellar medium (see, e.g., Thornton et al., 2013; Katz, 2016a). The DMs are therefore analogously higher than can readily be explained by the host galaxies, except in the few cases where the host galaxies would be edge on, or if the FRBs occur only very near the galactic centers. The high DMs therefore suggest cosmological distances, with very long path-lengths through the intergalactic medium (IGM), large DMs intrinsic to the sources within the host galaxies, or a combination of both.
Although a number of arguments have been advanced that FRBs are indeed at cosmological distances, and that the large DMs are in fact due to the long path-length through the intergalactic medium, there remain some difficulties with this scenario, in particular in reproducing the temporal scattering (see discussion in Connor et al., 2016).
One way of obtaining large intrinsic DMs without recourse to cosmological distances was proposed by Connor et al. (2016). It is that we are seeing FRBs through the dense ionized ejecta in young core-collapse supernovae (SNe), with the ionized parts of the dense SN ejecta and possibly the circumstellar environment providing the observed dispersion. The FRBs themselves would be generated by the pulsars or magnetars left behind by the supernova explosion in the centers of the clouds of expanding SN ejecta.
We have observed such a nearby core-collapse supernova, SN 1986J, in the radio, and have obtained both very long baseline interferometry (VLBI) imaging, and broadband measurements of its spectral energy distribution (SED) using the National Radio Astronomy Observatory’s333The National Radio Astronomy Observatory, NRAO, is a facility of the National Science Foundation operated under cooperative agreement by Associated Universities, Inc. Karl G. Jansky Very Large Array (VLA). SN 1986J is unique among SNe in having a central component, a bright, compact radio source most likely located in the very center of the expanding shell of debris. Although no FRBs have been associated with SN 1986J, it is important in the context of FRBs because SN 1986J represents the first case where we have direct observational constraints on the propagation of GHz-frequency radio signals through the ejecta of a supernova. In this paper, we use our observations of SN 1986J to address the possibility of propagating an FRB signal through the ejecta of a 30-year old supernova.
2 SN 1986J and its Central component: Radio Emission from Inside a Young Supernova
Although many supernovae (SNe) are detected optically every year, optical observations cannot resolve the expanding clouds of ejecta beyond the Magellanic clouds. Only VLBI observations have the necessary resolution, and only a handful of SNe are sufficiently radio bright and nearby so that resolved images can be obtained. SN 1986J was one of the first SNe observed with VLBI (Bartel et al., 1987, 1991). It was also one of the most radio-luminous ever observed, and one of the few SNe still detectable more than years after the explosion, thus we have been able to follow its evolution for longer than was possible for most other SNe. We describe the VLBI observations of SN 1986J along with VLA observations to monitor the evolution of its radio SED in a series of papers: Bietenholz et al. (2002, 2010), and Bietenholz & Bartel (2017a, b), which we will refer to as SN86J-I to SN86J-IV respectively. We refer the interested reader particularly to a sequence of VLBI images in SN86J-III which show both the expansion and the non-selfsimilar evolution over almost three decades and to a discussion of the evolution of the broadband radio SED in SN86J-IV.
SN 1986J occurred in the nearby galaxy NGC 891, for whose distance the NASA/IPAC Extragalactic Database (NED) lists 19 measurements with a mean of Mpc, which value we adopt throughout this paper. It was classified as being a Type IIn supernova (Rupen et al., 1987), showing signs of strong interaction of the expanding supernova shock with the circumstellar material (CSM).
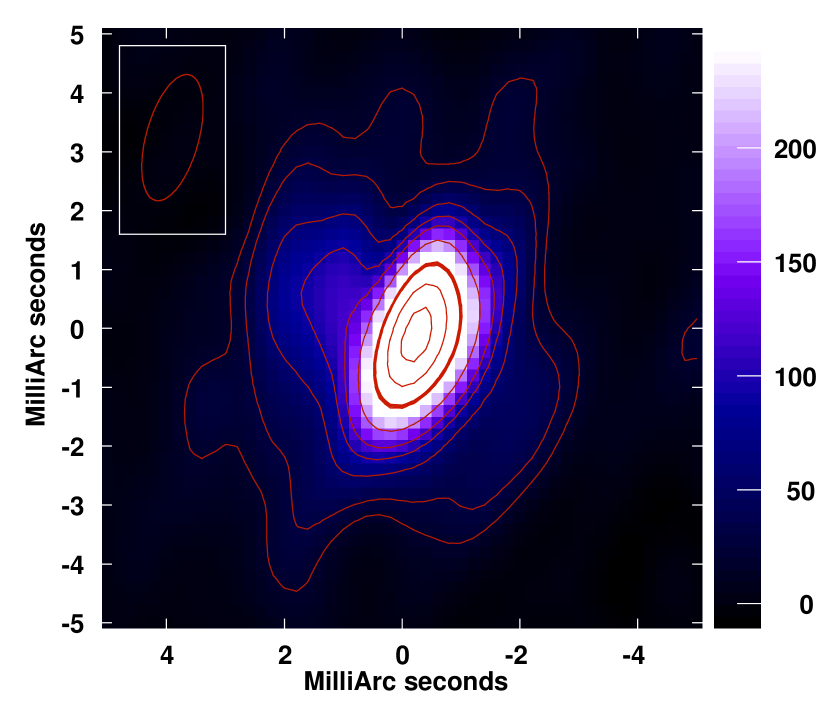
The structure seen in the cm-wavelength VLBI images shows an expanding, albeit somewhat distorted shell, but also two strong compact enhancements of the brightness: one, now fading, to the NE of the shell center, and a second, which remains bright, at or very near the projected center. Such a cm-wavelength central radio component has not so far been seen in any other supernova444We note that central emission at mm wavelengths, but not at cm wavelengths, has been seen in SN 1987A (Zanardo et al., 2014). SN 1987A’s mm-wavelength central component, which is attributed to dust, does not provide any useful constraints on the propagation of cm-wave FRB-like signals through the ejecta. (see e.g., Bietenholz, 2014; Bartel & Bietenholz, 2014).
We showed by means of phase-referenced multi-frequency VLBI imaging, that the central component in the images was associated with an inversion which appeared in the SED of SN 1986J in Bietenholz et al. (2004). We first saw the central component in 2002 at 15 GHz, and it was not yet visible at 5-GHz. Since then, however, it has increased steadily in brightness at 5-GHz, and now it dominates the 5-GHz image. We show the most recent 5-GHz VLBI image of SN 1986J at yr, reproduced from SN86J-III, in Figure 1.
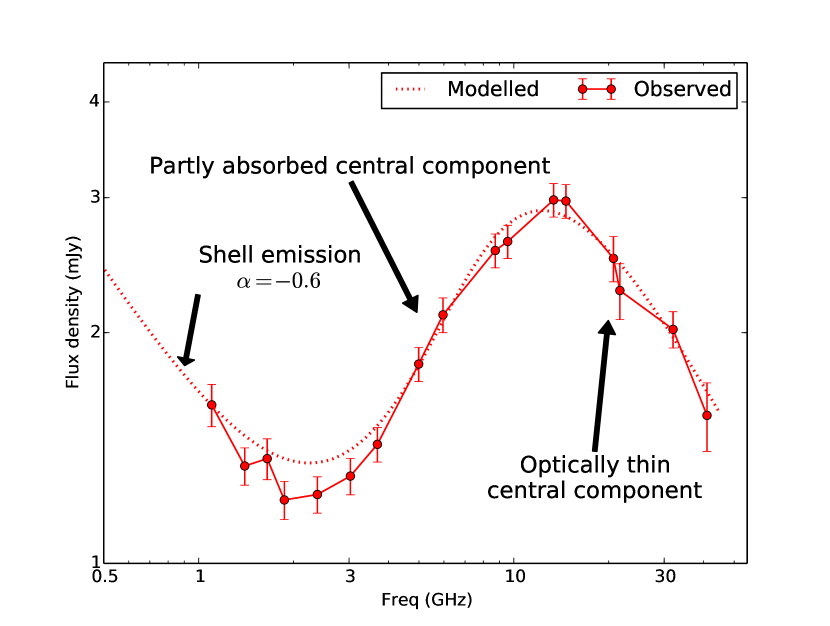
We show the radio SED of SN 1986J at about the same age ( yr) in Figure 2 (for details, and the detailed evolution of the SED, see SN86J-IV, ). The part of the SED due to the central component, i.e., that above 3 GHz, suggests that the emission is absorbed below a frequency of 15 GHz. Although both synchrotron self-absorption and free-free absorption are seen commonly in SNe, we argued in SN86J-II and Bietenholz et al. (2005) that synchrotron-self-absorption is not plausible in this case. At yr, the angular size of the central component is as, corresponding at 10 Mpc to a radius, cm, and the peak in the SED was 3 mJy at 13 GHz (SN86J-IV). Following Chevalier (1998), for that flux density, we can compute that synchrotron self-absorption would only be important for radii of cm. The central component, therefore, is too large and faint to suffer significant self-absorption, and we can therefore conclude that the absorption is dominated by free-free absorption.
Significant free-free absorption is indeed expected if the central component is in the center of the supernova and we are seeing it through the shell of expanding ejecta, which is expected to be at least partly ionized and thus to provide free-free absorption at radio frequencies.
The longevity, still-increasing flux density at 5-GHz and stationarity of the central component argue convincingly that it is due to emission originating in the three-dimensional center of the supernova, rather than being associated with the expanding shell of ejecta and central only in projection (\al@SN86J-3, SN86J-4; \al@SN86J-3, SN86J-4). The absorption seen is therefore almost certainly due to the ionized portion of the intervening SN ejecta.
The central component therefore represents synchrotron radio emission most likely coming from inside a young supernova, which has not so far been observed for any other supernova. This fact is of particular interest in the context of FRBs because it gives us direct observational constraints on the propagation of radio signals through SN ejecta.
Although SN 1986J was of type IIn, characterized by strong CSM interaction, the CSM at this late stage is likely to have little effect on either the absorption or the dispersion. Weiler et al. (1990) show that the 1.4 GHz lightcurve of SN 1986J reached its peak around yr, therefore the optical depth of the CSM at 1.4 GHz was 1 at that time. Since the supernova has expanded by at least a factor of 3 since then, the remaining opacity due to the CSM even at 1 GHz is expected to be quite small. Since the densities in the CSM are expected to be low compared to those in the ejecta, we expect the contribution of the CSM to the DM also to be small. Therefore our conclusions should be applicable to different kinds of Type II SNe, not just to Type IIn’s like SN 1986J.
3 Absorption of Radio Signals by the SN Ejecta
As we have shown (see Figure 2), at yr, the emission from SN 1986J’s central component is absorbed below a turnover frequency of 15 GHz, almost certainly by free-free absorption. The optical depth to free-free emission is given by:
where is the frequency, is the electron temperature, and EM the emission measure. EM is given by
where is the number density of free electrons, and is the path-length along the line of sight from the center of the SN to the observer.
The turnover frequency is approximately the frequency where (the exact value depends on the unabsorbed spectral index of the emission). So, for that particular time of yr, assuming that occurs at exactly 15 GHz, we can calculate that
The SED shown in Figure 2, however, is not static, since we found in SN86J-II and SN86J-IV that the turnover frequency is decreasing with time. Time variability therefore needs to be considered. In order to characterize the evolving SED of SN 1986J, we fitted a model with 8 free parameters to the flux density measurements (such as those in Fig. 2) between and 30 yr using Bayesian statistics. Our model consisted of a shell emission component, which is optically thin, as expected at these late times, and a central component which is partly absorbed, with both the intrinsic flux densities and the amount of absorption varying with time in a powerlaw fashion. Note that in our model, the SED is calculated accurately, and we did not make the simplifying assumption above that the spectral peak occurs exactly at the frequency where . Details of our fit are given in SN86J-IV. The fit adequately reproduces the downward evolution of the turnover frequency with time as well as the shape of the SED at any given time.
Of interest here is the result on the absorption. The relevant fitted parameter in our model is the emission measure (EM) as a function of time. We found that
The EM, therefore is decreasing in time. This is expected as the SN is expanding with time. In a homologously expanding system with a constant number of free electrons and , one would expect EM to be proportional to , so the fitted time-dependence of EM suggests a system expanding with . This is somewhat more decelerated than the forward shock of SN 1986J, which we found to be expanding with (SN86J-II), suggesting perhaps some ongoing fragmentation of the ejecta, which could cause the opacity to not scale simply with the radius.
This result on the EM and its time-dependence gives us a unique observational constraint on the column density of free electrons between us and the center of SN 1986J, and thus allows us to put some constraints on the time that SN ejecta would become transparent to FRB-like signals (i.e., 1 GHz), and on the dispersion measure.
4 Time Until SN Becomes Transparent to an FRB Signal
Given that, at the present time ( yr), the turnover frequency is at 15 GHz (Fig. 2), it is clear that any FRB-like signals, which are generally observed in the 0.6 to 1.4 GHz range (e.g., Katz, 2016a), originating in the center of SN 1986J would still be heavily absorbed.
Extrapolating our fit to the evolving value of EM above, we obtain a best estimate of the age of the SN at which the optical depth at 1 GHz would reach unity of yr. The uncertainty on this best estimate is not easy to compute: the model we fitted to SN 1986J’s SED was only approximate, and it was fitted to measurements only between to 30 yr, thus the extrapolation to times yr is quite uncertain. Nonetheless, it is clear that the ejecta would not be transparent to signals at typical FRB frequencies of 1 GHz until at least three decades from now, and we take a lower bound of yr.
5 Dispersion Measure
One of the distinguishing features of FRBs is their high values of the dispersion measure,
Can we calculate the DM for SN 1986J from our estimate of the EM, and could such high values of DM still be produced locally by the ejecta of by the time the ejecta have become transparent to 1-GHz radiation?
We found in § 4 that the expected optical depth at 1 GHz of SN 1986J would reach unity at 200 yr, at which time the EM would be cm-6 pc, and the extrapolated outer radius of the SN would be 0.9 pc (SN86J-II).
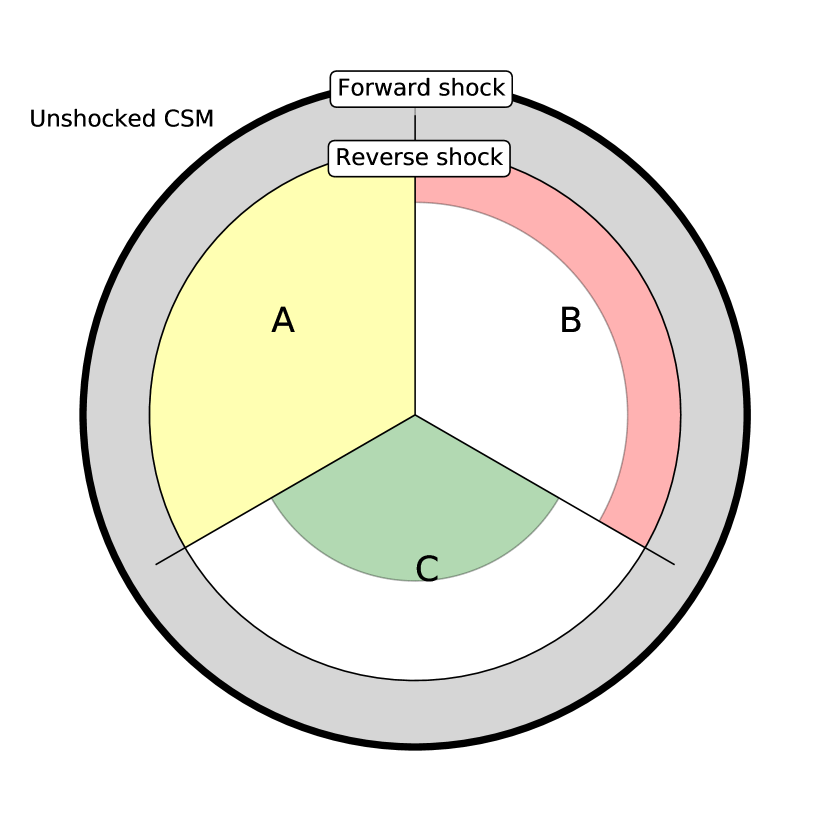
To calculate the DM from the EM we need to know the distribution of the free electrons along the line of sight. In a supernova, a dual shock structure will form with a forward shock being driven into the CSM and a reverse shock being driven back into the ejecta. We show a schematic diagram of the structure of the SN in Figure 3. The thickness of the region between the shocks is 20% of the forward-shock radius (e.g., Chevalier, 1982; Bietenholz et al., 2003). The material between the two shocks is at sufficiently low density and high temperatures ( K; e.g., Chevalier, 1982; Lundqvist & Fransson, 1988) that it does not contribute significantly to the radio absorption, or to our values of EM.
Due to the low density of the region between the shocks, this region is also not expected to contribute to the DM. For example, for an outer shock radius of 0.90 pc and an inner shock radius of 0.72 pc, a completely ionized mass of 10 between the two shocks would produce a DM of only 40 cm-3 pc. Since the mass between the two shocks will almost certainly be less than 10 , we also ignore the contribution to the DM from the region between the two shocks. We need consider, therefore, only the unshocked ejecta inside the reverse shock, and of these it is only the ionized fraction which contributes significantly to the the EM or DM or both.
However, that ionized fraction and its distribution within the ejecta is not well known. It is generally expected that the ejecta are largely ionized by the SN shock breakout, however recombination may be rapid thereafter. While some portions of the ejecta may recombine, the radiation from the shocks will likely keep at least the outer portion of the ejecta ionized. We therefore consider various distributions of ionized material within the ejecta. In particular, we consider three example distributions of the ionized material, which are illustrated schematically in Figure 3, namely: case “A”, where the ejecta are uniformly ionized, case “B”, where they are ionized from the outside, but are neutral towards the center of the SN, and case “C”, where they are ionized from the center of the SN, but neutral towards the outside.
We seek to constrain the DM based on the observed absorption, via our fitted values of EM. For our calculation, we use the extrapolated time when the SN becomes optically thin at 1 GHz of = 200 yr, along with the extrapolated value of EM of cm-6 pc that we get for that time (§ 4). We further take, at that time, the radius of the forward shock to be 0.9 pc, and that of the reverse shock to be 80% of that, or 0.72 pc, again extrapolating our the measured expansion of SN 1986J to yr (SN86J-II).
5.1 Uniform Distribution of the Ionized Ejecta
For the first and simplest case, we assume that the ionized ejecta are uniformly distributed inside the reverse shock, which is sketched as case A in Figure 3. We therefore have a sphere of uniform out to pc. From our extrapolated value of EM, we can straightforwardly calculate that, at yr, cm-3 and DM cm-3 pc.
While this value of DM is compatible with the values of 375 to 1700 cm-3 pc seen for FRBs, if we assume fully ionized material with a mass in u (unified atomic mass units) per free electron of , it implies an unreasonable total ionized mass, = 100 . Therefore, to produce the EM with only reasonable masses, the ionized material would have to be non-uniformly distributed.
5.2 Non-Uniform Distribution of the Ionized Ejecta
The value of DM corresponding to a particular one of EM depends only on the path-length through the ionized portion of the material (equal to the reverse-shock radius in the case of a sphere of uniform assumed for case A in § 5.1 above). We can therefore consider cases B, ejecta ionized from the outside, and C, ejecta ionized from the inside, together for the calculation of the DM. We compute the values of DM corresponding to different path-lengths, for yr, and the same outer shock radius and extrapolated value of EM used in § 5.1 above (0.9 pc and cm-6 pc respectively). In case B, the path-length is the thickness of the ionized shell, while in case C it is the radius of the ionized sphere.
We plot the values of DM in Figure 4. Values of DM in the range observed for FRBs can indeed be achieved for path-lengths of 0.05 to 1 pc. The question however remains whether these high values of DM are consistent with the expected values of in a SN.
As in § 5.1, we calculate the total ionized mass, , associated with cases B and C, again assuming . Unlike DM, does depend on the distribution of ionized matter and not just on the path-length, and it therefore differs between cases B and C, so we plot one curve for each of the two cases in Figure 4. We note that this figure is very similar to Figure 5 of SN86J-IV, but that figure was for yr, whereas in the present one we plot the values for the extrapolated time of transparency of yr.
In both cases, for large values of DM, unrealistically large values of are required. What is a reasonable upper limit for ? Although Type II SNe could easily have more than 10 of total ejected material, only a fraction is expected to be ionized at late times (decades or more after the explosion). The expected values for SN 1986J are likely in the range of 0.5 to 5 . In the case of SN 19867A, Zanardo et al. (2014) argue that in the ejecta is in the range of 0.7 to 2.5 . Since SN 1986J’s progenitor was probably more massive than that of SN 1987A, we consider values of up to 5 . The generally expected picture is that the ejecta will cool and become neutral except for a shell which is heated by emission from the shocks (Hamilton & Sarazin, 1984; Chevalier & Fransson, 1994), which corresponds to our case B, and in which case is expected to be % of the total ejecta mass.
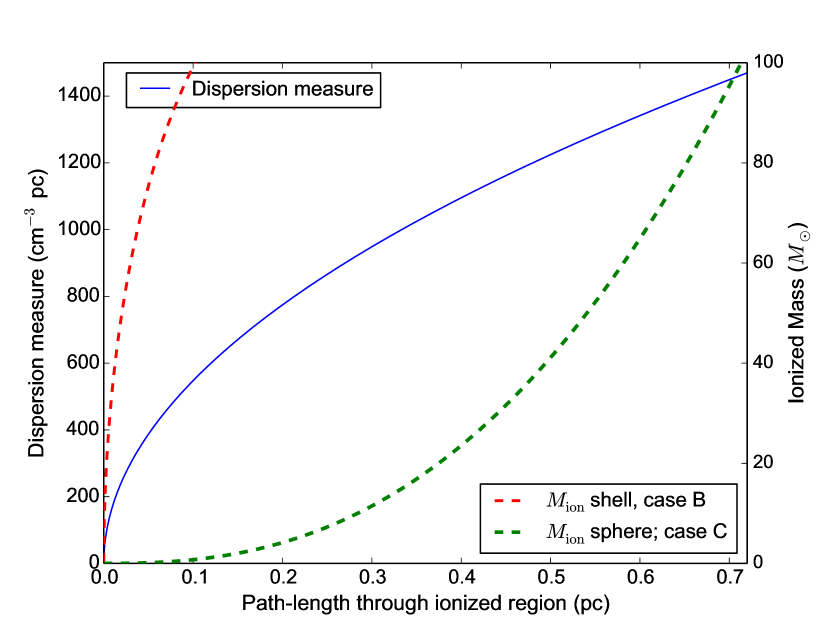
For a spherical shell distribution with outer radius, , equal to the reverse shock radius (0.72 pc, case B), which is what is expected if the ejecta are ionized from the outside by the shocks, a mass of 5 is reached already at DM of only 25 cm-3 pc, with the shell thickness being quite thin at pc or 0.03% of the forward shock radius. Such a thin shell containing a substantial fraction of the total ejecta mass seems implausible. We note that even if is as high as 10 , the DM reaches only 50 cm-3 pc with the shell thickness still only being pc.
In fact we had already found in SN86J-IV that the required EM can only be produced if is concentrated near the center of the SN, rather than being out near the reverse shock (or of course if the distribution is strongly aspherical). If is indeed distributed in a spherical region near the center of SN 1986J (case C), then a DM of 800 cm-3 pc is produced when = 5 and the radius of the sphere is 0.2 pc. Such a distribution may in fact be possible for SN 1986J, where the central component may ionize the ejecta from the center, but is unlikely for other SNe which do not have any central component.
We can conclude therefore, that by the time the supernova ejecta have become transparent to radio waves at 1 GHz, it is difficult to produce the high values of DM typical of FRBs from the supernova ejecta without either an implausibly high or having the ionized ejecta concentrated in an implausibly small region.
We note that a large value of DM with a reasonable in a shell distribution can be produced with a thin shell of small radius. This case is similar to the spherical distribution with a small radius. One possibility for producing such a shell inside an expanding SN would be if a pulsar wind nebula (PWN), with a radius much smaller than that of the SN forward shock, re-ionizes the ejecta from the inside. In that case a thin, dense shell could produce a value of DM of 1000 cm-3 pc (for our extrapolated EM of cm-6 pc) with only a reasonable mass. Although SN 1986J’s central component could be interpreted as being a young PWN nebula, we argue in SN86J-IV that a PWN hypothesis is not favored.
Regardless of the exact distribution and location of the ionized portion of the ejecta, if DM were produced by propagation through the expanding SN ejecta, one would expect it to decrease relatively rapidly as the ejecta expanded, since DM is proportional to in an expanding but otherwise unchanging system (e.g., Piro, 2016; Kashiyama & Murase, 2017; Yang et al., 2017) SNe typically expand with so one would expect that DM . The repeating FRB 121102 has been observed for over 3 yr, and with the DM changing by cm-3 pc or % over that period (Scholz et al., 2016; Yang & Zhang, 2017; Law et al., 2017). However, given its distance () the proportion of the DM due to the IGM probably dominates, and only a relatively small fraction would be intrinsic and time-variable due to expanding SN ejecta.555Yang et al. (2017) derive a value of the host-galaxy DM of FRB 121102 of 210 cm-3 pc, but that value is based on calculating a value of the intergalactic DM for the known redshift of of 164 cm-3 pc based on the work of McQuinn (2014), but the latter also shows that the dispersion in the value of the intergalactic DM over different lines of sight is expected to be cm-3 pc, and the uncertainty in the host-galaxy value of DM for FRB 121102 must therefore be at least as large. Our measurements of SN 1986J show that ejecta do not become transparent to FRB-like emission ( GHz) till yr after the explosion, and thus the fractional time-variability of the intrinsic DM over a few years would not be large.
6 Summary and Conclusions
Our VLA and VLBI observations of the core-collapse Type IIn SN 1986J, which has a bright, central radio component, have for the first time given us direct observational constraints on the propagation of radio signals through the ejecta of a young SN. Based on our results from SN 1986J, we conclude that FRB signals at 1 GHz would not be able to propagate through SN 1986J’s ejecta for some decades, and that by the time they could, it would be difficult for the SN ejecta to produce the high values of DM seen in FRBs. This echoes the conclusions of Piro (2016), Murase et al. (2016), Piro & Burke-Spolaor (2017), and Metzger et al. (2017), who all concluded that Type II SN ejecta would be opaque to FRB-like signals for periods of several decades to a century or more except possibly in the case of a stripped-envelope (Type I b/c) SN. Our conclusion is also in accord with those of Katz (2016b), who examined the distribution of DM from the observed FRBs and concluded that it was inconsistent with that expected if the DMs were produced by the propagation of signals through SN ejecta alone.
Our conclusions are not in conflict with the hypothesis that FRBs originate from young pulsars or magnetars, which are among the more promising hypotheses for the origins of FRBs (see, e.g., Katz, 2016a). However, we find on the basis of observational evidence that the FRB signals would likely be absorbed for the first few decades for a supernova similar to SN 1986J, i.e. of Type II, and that the high DMs are unlikely to be caused by propagation of the FRB signal through the SN ejecta. Very likely therefore, some other explanation for the large DMs, such as cosmological distances, must be sought.
In summary:
1. Our observations of radio emission from SN 1986J’s central component show that FRB-like signals from inside a Type II SN (at 1 GHz) would be free-free absorbed by the ionized material in the ejecta for periods of yr after the supernova explosion.
2. Once the ejecta have become optically thin to 1-GHz radiation, producing the dispersion measures required for FRBs (375 to 1700 cm-3 pc) requires either an unrealistically large mass of ionized material in the ejecta () or the confinement of the ionized portion of the ejecta to an implausibly small region within the SN.
Acknowledgments
We have made use of NASA’s Astrophysics Data System Abstract Service, as well as the NASA/IPAC Extragalactic Database (NED) which is operated by the Jet Propulsion Laboratory, California Institute of Technology, under contract with the National Aeronautics and Space Administration. This research was supported by both the National Sciences and Engineering Research Council of Canada and the National Research Foundation of South Africa.
References
- Bartel & Bietenholz (2014) Bartel, N., & Bietenholz, M. F. 2014, in IAU Symposium, Vol. 296, Supernova Environmental Impacts, ed. A. Ray & R. A. McCray, 53–57
- Bartel et al. (1991) Bartel, N., Rupen, M. P., Shapiro, I. I., Preston, R. A., & Rius, A. 1991, Nature, 350, 212
- Bartel et al. (1987) Bartel, N., Ratner, M. I., Rogers, A. E. E., et al. 1987, ApJ, 323, 505
- Bietenholz (2014) Bietenholz, M. 2014, in 12th European VLBI Network Symposium and Users Meeting (2014), published by SISSA, Trieste, ed. A. Tarchi, M. Giroletti, & L. Feretti, 51
- Bietenholz & Bartel (2017a) Bietenholz, M. F., & Bartel, N. 2017a, ApJ, 839, 10
- Bietenholz & Bartel (2017b) —. 2017b, ArXiv e-prints, arXiv:1707.06596
- Bietenholz et al. (2002) Bietenholz, M. F., Bartel, N., & Rupen, M. P. 2002, ApJ, 581, 1132
- Bietenholz et al. (2003) —. 2003, ApJ, 597, 374
- Bietenholz et al. (2004) —. 2004, Science, 304, 1947
- Bietenholz et al. (2005) —. 2005, Advances in Space Research, 35, 1052
- Bietenholz et al. (2010) —. 2010, ApJ, 712, 1057
- Caleb et al. (2017) Caleb, M., Flynn, C., Bailes, M., et al. 2017, MNRAS, 468, 3746
- Chatterjee et al. (2017) Chatterjee, S., Law, C. J., Wharton, R. S., et al. 2017, Nature, 541, 58
- Chevalier (1982) Chevalier, R. A. 1982, ApJ, 259, 302
- Chevalier (1998) —. 1998, ApJ, 499, 810
- Chevalier & Fransson (1994) Chevalier, R. A., & Fransson, C. 1994, ApJ, 420, 268
- Connor et al. (2016) Connor, L., Sievers, J., & Pen, U.-L. 2016, MNRAS, 458, L19
- Hamilton & Sarazin (1984) Hamilton, A. J. S., & Sarazin, C. L. 1984, ApJ, 287, 282
- Kashiyama & Murase (2017) Kashiyama, K., & Murase, K. 2017, ApJ, 839, L3
- Katz (2016a) Katz, J. I. 2016a, Modern Physics Letters A, 31, 1630013
- Katz (2016b) —. 2016b, ApJ, 818, 19
- Keane et al. (2016) Keane, E. F., Johnston, S., Bhandari, S., et al. 2016, Nature, 530, 453
- Law et al. (2017) Law, C. J., Abruzzo, M. W., Bassa, C. G., et al. 2017, ArXiv e-prints, arXiv:1705.07553
- Lundqvist & Fransson (1988) Lundqvist, P., & Fransson, C. 1988, A&A, 192, 221
- Marcote et al. (2017) Marcote, B., Paragi, Z., Hessels, J. W. T., et al. 2017, ApJ, 834, L8
- McQuinn (2014) McQuinn, M. 2014, ApJ, 780, L33
- Metzger et al. (2017) Metzger, B. D., Berger, E., & Margalit, B. 2017, ApJ, 841, 14
- Murase et al. (2016) Murase, K., Kashiyama, K., & Mészáros, P. 2016, MNRAS, 461, 1498
- Petroff et al. (2016) Petroff, E., Barr, E. D., Jameson, A., et al. 2016, PASA, 33, e045
- Piro (2016) Piro, A. L. 2016, ApJ, 824, L32
- Piro & Burke-Spolaor (2017) Piro, A. L., & Burke-Spolaor, S. 2017, ApJ, 841, L30
- Rupen et al. (1987) Rupen, M. P., van Gorkom, J. H., Knapp, G. R., Gunn, J. E., & Schneider, D. P. 1987, AJ, 94, 61
- Scholz et al. (2016) Scholz, P., Spitler, L. G., Hessels, J. W. T., et al. 2016, ApJ, 833, 177
- Spitler et al. (2016) Spitler, L. G., Scholz, P., Hessels, J. W. T., et al. 2016, Nature, 531, 202
- Tendulkar et al. (2017) Tendulkar, S. P., Bassa, C. G., Cordes, J. M., et al. 2017, ApJ, 834, L7
- Thornton et al. (2013) Thornton, D., Stappers, B., Bailes, M., et al. 2013, Science, 341, 53
- Vedantham et al. (2016) Vedantham, H. K., Ravi, V., Hallinan, G., & Shannon, R. M. 2016, ApJ, 830, 75
- Weiler et al. (1990) Weiler, K. W., Panagia, N., & Sramek, R. A. 1990, ApJ, 364, 611
- Williams & Berger (2016) Williams, P. K. G., & Berger, E. 2016, ApJ, 821, L22
- Yang et al. (2017) Yang, Y.-P., Luo, R., Li, Z., & Zhang, B. 2017, ApJ, 839, L25
- Yang & Zhang (2017) Yang, Y.-P., & Zhang, B. 2017, ApJ, 847, 22
- Zanardo et al. (2014) Zanardo, G., Staveley-Smith, L., Indebetouw, R., et al. 2014, ApJ, 796, 82