Analysis of the Daya Bay Reactor Antineutrino Flux Changes with Fuel Burnup
Abstract
We investigate the recent Daya Bay results on the changes in the antineutrino flux and spectrum with the burnup of the reactor fuel. We find that the discrepancy between current model predictions and the Daya Bay results can be traced to the original measured 235U/239Pu ratio of the fission beta spectra that were used as a base for the expected antineutrino fluxes. An analysis of the antineutrino spectra that is based on a summation over all fission fragment beta-decays, using nuclear database input, explains all of the features seen in the Daya Bay evolution data. However, this summation method still predicts an anomaly. Thus, we conclude that there is currently not enough information to use the antineutrino flux changes to rule out the possible existence of sterile neutrinos.
Recent results from the Daya Bay (DB) reactor neutrino experiment DayaBay-new show significant change in the emitted antineutrino flux with the evolution of the reactor fuel. Over the course of 1230 days, the fuel evolved such that the fraction of fissions from 239Pu increased from 25% to 35%, while those from 235U decreased from 63% to 51%. Over the same period, the fraction from 238U remained approximately constant at 7.6%, while the 241Pu fraction increased from 4% to 8%. The dependence of antineutrino flux on the fuel evolution was measured DayaBay-new by the change in the yield from the inverse beta decay (IBD) reaction with the variation in the 239Pu fission fraction, . The IBD yield, which is an integral over energy of the product of the IBD cross section and the antineutrino flux per fission, was fitted with a linear dependence on as DayaBay-new ,
| (1) |
where is the average IBD yield, is the average 239Pu fission fraction, and is the change of the IBD yield per unit 239Pu fission fraction. The values reported by Daya Bay are: cm2/fission, cm2/fission, and for i=(235U, 238U, 239Pu, 241Pu).
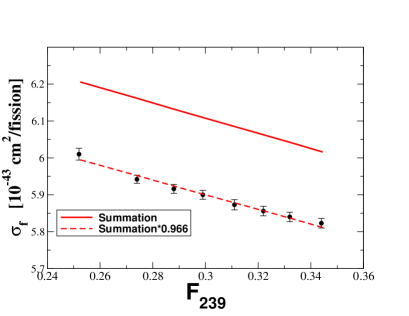
These DB results confirm the “reactor neutrino anomaly” anomaly ; daya-bay , in that the measured value of is about 5.1% below that predicted by the model spectra of Huber and Mueller (H-M) huber ; mueller . However, the new DB results question the origin of this anomaly because the magnitude of the anomaly varies with the fuel evolution. The variation in the size of the anomaly with the fuel evolution results from the fact that the H-M value for cm2/fission differs from DB’s measured value by 3.1 . The H-M ratio does not agree with experiment and is incompatible with the IBD deficit being the same for all four actinides by 2.6 . DB’s experimentally deduced IBD yields for 235U and 239Pu are cm2/fission and cm2/fission, respectively, corresponding to a ratio of 1.445. By comparison, the Huber model ratio is 1.534 0.05. The DB analysis DayaBay-new suggests that the anomaly arises almost entirely from 235U, and that the Huber prediction huber for IBD yield for 235U, , is 7.8% larger than that deduced by DB, while the model IBD yield for 239Pu, , is in reasonable agreement with experiment.
The purpose of the present work is to point out that (1) the Huber prediction for is strongly constrained by the original measured aggregate beta spectra of Schreckenbach et al. schreck that Huber converted to antineutrino spectra, and (2) a nuclear database analysis, involving a summation over all beta-decay transitions that make up the aggregate antineutrino spectra, provides a reasonable description of all of the evolution data, but still predicts an anomaly. Thus, it is difficult to draw a conclusion about the existence of sterile neutrinos from evolution data alone.
The experimental aggregate beta spectra were obtained in the 1980’s schreck at the Institute Laue-Langevin (ILL). To investigate the origin of the Huber ratio, we refitted the ILL beta decay spectra, varying many of the assumptions that go into such a fit. The spectra were fitted assuming different combinations of allowed and first forbidden beta transitions, ranging from all allowed to 40% first forbidden. The procedure and parameterization that we employed is described in hayes . Only 25 or so transitions are required to fit the integral beta spectra. Thus, in order to calculate the the Fermi function and its finite size correction, a choice must be made to assign a and to these effective transitions. These choices of and and the related endpoint energies introduce uncertainty into the fit, with a corresponding uncertainty in the antineutrino spectra. Thus, in fitting the spectra the prescriptions for and were also varied. The relative importance of the different approximations used in deriving expected antineutrino spectra is summarized in hayes-vogel .
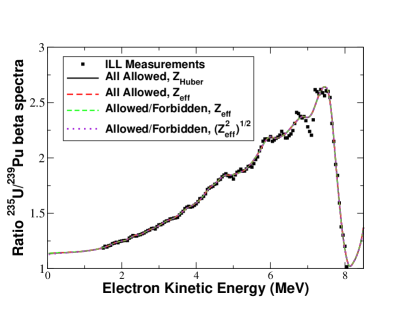
Varying all of the assumptions in fitting the aggregate fission beta spectra for 235U and 239Pu led to variations in the corresponding antineutrino spectra that differed at the few percent level. However, in all cases the ratio of the antineutrino spectra and IBD yield ratio varied only slightly, with remaining close to 1.53, Fig. 1 and Table 1. In this figure and table we show results for four sets of assumptions: (1) all transitions are allowed and Huber’s quadratic prescription for , (2) all transitions are allowed and , (3) transitions can be either allowed or forbidden and , and (4) transitions can be either allowed or forbidden and . Here are the cumulative fission yields for the fission fragments . We find that, for all sets of assumptions that we checked, the fits to the Schreckenbach beta spectra result in an IBD yield ratio with that is about 6% higher than the DB result.
| all allowed | all allowed | allow.+forbid. | allow.+forbid. | |
|---|---|---|---|---|
| 235U | 6.69 | 6.58 | 6.47 | 6.48 |
| 239Pu | 4.36 | 4.3 | 4.22 | 4.23 |
| ratio | 1.534 | 1.530 | 1.533 | 1.532 |
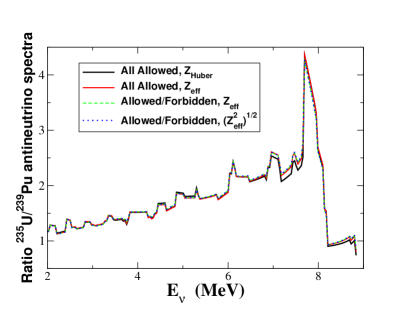
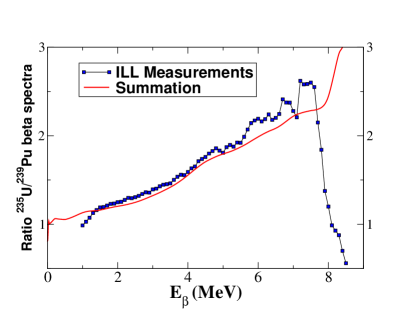
An alternate procedure for investigating the ratio is to employ the so-called summation method using the nuclear database libraries for the cumulative fission yields and beta decay spectra. In this work we have used the JEFF-3.1 cumulative fission yields JEFF in combination with a preliminary version of the ENDF/B-VIII.0 decay data sub-library endf-8 as described in Ref. bnl . ENDF/B fission yields were not used due to the compatibility issues discussed in Ref. BNL-bump . For most of the energy interval, 2-7 MeV, these summation calculations predict a smaller 235U/239Pu beta spectra ratio, see Fig. 2, leading to an IBD antineutrino yield ratio equal to 1.46. However, it is difficult to draw any conclusions from this fact because about 4% of the predicted 235U electron spectra and 7% of the 239Pu predicted electron spectra originate from nuclei whose decays are quite uncertain. In such cases the theoretical spectra of Kawano et al. kawano were used. In addition, the uncertainty on the database summation spectra was not estimated because correlation matrices for fission yields are not available. The summation method prediction for , which also involves 238U and 241Pu, is in closer agreement with the Daya Bay result than the H-M model, Table 2 and Fig. 3. However, the DB and summation results differ in detail. In particular, the summation predictions for the IBD cross section for 235U, 239Pu and 241Pu are all about 5% higher than the Daya Bay values. Thus, all three actinides contribute approximately equally to the summation anomaly. In the case of 238U, the uncertainty in the antineutrino spectrum is larger because 238U involves fast (as opposed to thermal) fission yields. In addition, does not change significantly with the fuel evolution.
| DBa | Summation | H-Mb | |
| (10-43cm2) | 5.9 0.13 | 6.11 | 6.220.14 |
| (10-43cm2) | -1.86 0.18 | -2.05 | -2.460.06 |
| (10-43cm2) | 6.17 0.17 | 6.49 | 6.690.15 |
| (10-43cm2) | 4.27 0.26 | 4.49 | 4.360.11 |
| (10-43cm2) | 10.11.0 | 10.2 | 10.11.0 |
| (10-43cm2) | 6.040.6 | 6.4 | 6.040.6 |
| 1.4450.097 | 1.445 | 1.53 0.05 |
The Daya Bay collaboration also observed a change in the shape of antineutrino spectrum over the course of the reactor fuel evolution. This is defined as , where denotes four prompt energy intervals , (0.7-2 MeV, 2-4 MeV, 4-6 MeV, and 6-8 MeV), with MeV. is the corresponding partial contribution to the IBD yield in the energy range :
| (2) |
The summation predictions, along with the DB measurements are shown in Fig. 4, where good agreement is seen.
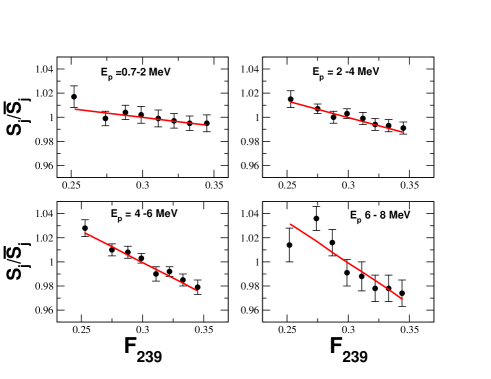
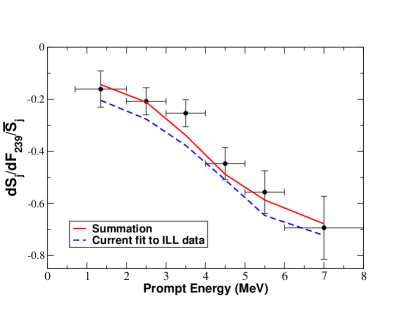
A comparison to the change in the IBD spectrum with for six prompt energy ranges is shown in Fig.5. In this figure we show both the summation predictions and one of our conversions of the ILL data, using assumption (2) of Fig. 1. The current fit to ILL leads to a change in the IBD spectrum that is very similar to the Huber model, while the summation predictions are closer to experiment.
The Daya Bay collaboration concluded that the expected Huber model 235U spectrum is too high in magnitude, while that for 239Pu is consistent with the DB data. This raises the question whether the measured changes in IBD yield and spectrum are consistent with a sterile neutrino explanation of the reactor neutrino anomaly. The present analysis suggests that there is currently insufficient evidence to draw any conclusions on this issue. As we have shown, an analysis based on the summation method explains all of the features seen in the evolution data, but it predicts an average IBD yield that is 3.5% higher than observed. All actinides except 238U contribute approximately equally to the summation anomaly. But we note that 238U does not evolve with the rest of the fuel, and its summation antineutrino spectrum is at least 10% uncertain. Resolving the issue of the existence of sterile neutrinos requires new very short baseline neutrino experiments. A re-measurement of the aggregate fission beta spectra of 235U and 239Pu would also be very valuable in determining whether there is a problem with the ratio.
Acknowledgements.
The research at Los Alamos National Laboratory was sponsored by the U.S. Department of Energy FIRE Topical Collaboration. The research at Brookhaven National Laboratory was sponsored by the Office of Nuclear Physics, Office of Science of the U.S. Department of Energy under Contract No. DE-AC02-98CH10886. X.B. Wang was sponsored by the National Natural Science Foundation of China under Grants No. 11505056 and No. 11605054 and China Scholarship Council (201508330016).References
- (1) F.P. An, et al., Phys. Rev. Lett. 118, 251801 (2017).
- (2) G. Mention et al., Phys. Rev. D 83 073006 (2011).
- (3) F. P. An et al., Phys. Rev. Lett. 108, 171803 (2012).
- (4) P. Huber, Phys. Rev. C 84, 024617 (2011).
- (5) Th. A. Mueller et al., Phys. Rev. C 83, 054615 (2011).
- (6) K. Schreckenbach, H. R. Faust, F. von Feilitzsch, A. A. Hahn, K. Hawerkamp, and J. L. Vuilleumier, Phys. Lett. 99B, 251 (1981); F. von Feilitzsch, A. A. Hahn, and K. Schreckenbach, Phys. Lett. 118B, 162 (1982), and K. Schreckenbach, G. Colvin, W. Gelletly, and F. von Feilitzsch, Phys. Lett. 160B 325 (1985); A. A. Hahn, K. Schreckenbach, W. Gelletly, F. von Feilitzsch, G. Colvin, and B. Krusche, Phys. Lett. B218, 365 (1989).
- (7) A. C. Hayes, J. L. Friar, G. T. Garvey, Gerard Jungman, G. Jonkmans, Phys. Rev. Lett. 112, 202501 (2014).
- (8) Anna Hayes and Petr Vogel, Annual Review of Nuclear and Particle Science, 219-244 Vol. 66 (2016).
- (9) M. A. Kellett , O. Bersillon, R. W. Mills, “The JEFF-3.1/-3.1.1 Radioactive Decay Data and Fission Yields Sub-Libraries,” JEFF Report 20, NEA Report No. 6287 (2009).
- (10) The ENDF/B-VIII.0 library, which is soon to be released, includes all TAGS beta decay data published TAGS since the release of ENDF/B-VII.1 endf-7 .
- (11) A.-A. Zakari-Issoufou et al., Phys. Rev. Lett. 115, 102503 (2015); B. C. Rasco et al., Phys. Rev. Lett. 117, 092501 (2016).
- (12) M. B. Chadwick et al., Nucl. Data Sheets 112, 2887 (2011).
- (13) A. A. Sonzogni, T. D. Johnson, and E. A. McCutchan, Phys. Rev. C 91, 011301(R) (2015).
- (14) A. A. Sonzogni, E. A. McCutchan, T. D. Johnson, and P. Dimitriou, Phys. Rev. Lett. 116, 132502 (2016).
- (15) S. T. Holloway, T. Kawano, and P. Möller, J. Korean Phys. Soc. 59, 875 (2011), and T. Kawano, P. Moller, and W. B. Wilson, Phys. Rev. C 78, 054601 (2008); T. Kawano and S. T. Holloway, CGM: Cascading Gamma-ray and Multiplicity Code Ver. 3, 2010, unpublished.