A Spatially Resolved Study of the GRB 020903 Host Galaxy
Abstract
GRB 020903 is a long-duration gamma ray burst (LGRB) with a host galaxy close enough and extended enough for spatially-resolved observations, making it one of less than a dozen GRBs where such host studies are possible. GRB 020903 lies in a galaxy host complex that appears to consist of four interacting components. Here we present the results of spatially-resolved spectroscopic observations of the GRB 020903 host. By taking observations at two different position angles we were able to obtain optical spectra (3600-9000Å) of multiple regions in the galaxy. We confirm redshifts for three regions of the host galaxy that match that of GRB 020903. We measure metallicity of these regions, and find that the explosion site and the nearby star-forming regions both have comparable sub-solar metallicities. We conclude that, in agreement with past spatially-resolved studies of GRBs, the GRB explosion site is representative of the host galaxy as a whole rather than localized in a metal-poor region of the galaxy.
1 Introduction
Long-duration gamma-ray bursts (LGRBs) are highly energetic transient events associated with the core collapse of massive progenitor stars (Woosley 1993). Given the short lifetimes of their massive progenitor stars, LGRBs occur in star-forming galaxies, with morphologies that are more irregular than normal core-collapse supernovae hosts (Bloom et al. 2002; Le Floc’h et al. 2003; Christensen et al. 2004; Fruchter et al. 2006). The extreme luminosities of these events allow us to detect them out to extremely high redshifts (, Cucchiara et al. 2011). As a result, LGRBs can serve as excellent probes of the earliest star-forming galaxies in our universe. Consequently, it is important to understand whether the explosion site of an LGRB - including its star formation rate, metallicity, and evolved massive star population - can be treated as representative of both the host galaxy and the local star-forming galaxy population as a whole.
Recent studies have suggested that LGRBs are preferentially located in relatively low-metallicity galaxies (Woosley & Heger 2006; Wainwright et al. 2007; Krühler et al. 2015), with LGRB hosts falling below the mass-metallicity and luminosity-metallicity relations for star-forming galaxies out to (Fynbo et al. 2008; Kocevski et al. 2009; Levesque et al. 2010a, b; Woosley & Heger 2006). Krühler et al. (2015) identified a population of GRB hosts with greater than solar metallicity (the average GRB host metallicity is log(O/H)+12 8.5), but this fraction of hosts is small and suggests that some mechanism may be hindering GRB development in high metallicity environments. However, most LGRB studies are limited to global studies of the host galaxies as a whole, studying morphological trends in LGRB localization or obtaining a single spectrum of a small and faint galaxy that represents a galaxy-wide composite of its ISM properties. Host absorption in an LGRB afterglow spectrum is a better representation of the local GRB host environment, but this only samples a single sight-line and is limited to higher redshifts (), where most work is done in the rest-frame UV and is thus difficult to consistently compare to lower-redshift optical studies.
A complete understanding of the environmental dependence of LGRBs relies upon observations that can pinpoint the specific local explosion sites of GRBs and compare them to their larger host galaxies.Unfortunately, GRB rate density peaks at z2.5 and decreases by an order of magnitude towards z0 (Jakobsson et al. 2012; Perley et al. 2016). LGRBs in this z1 region preferentially occur in faint, low mass galaxies (Vergani et al. 2015). Consequently, LGRB hosts that are close enough or large enough (in projection) for spatially resolved studies are rare, and only five have been studied so far (Levesque 2016). The closest such galaxy, the host of GRB 980425 at , has been studied using integral field unit spectroscopy (Christensen et al. 2008; Krühler et al. 2017). Thöne et al. (2014) and Izzo et al. (2017) performed similar IFU analysis using the Very Large Telescope (VLT), on the hosts of GRB 060505 and GRB 100316D respectively; the former being an update to a previous long slit study by Thöne et al. (2008). All provided an extensive series of spatially resolved spectra and complex metallicity maps, demonstrating that GRBs form in regions that appear to be slightly more metal-poor than the global metallicity but agree to within the uncertainties of the metallicity diagnostics (Kewley & Ellison 2008).
The remaining hosts have been studied using long-slit spectroscopy, positioning the slit to capture multiple distinct regions within the presumed host complex (the hosts of GRB 120422A Levesque et al. 2012; Schulze et al. 2014, and GRB 020819B Levesque et al. 2010b). However, a more recent study of the GRB 020819B host using the Multi Unit Spectroscopic Explorer (MUSE) on the VLT revealed the host galaxy to be a foreground galaxy unassociated with the GRB (Perley et al. 2017). This further demonstrates the advancements provided by IFU studies over traditional long-slit spectroscopy. The host galaxy of the ultra-long GRB 130925A at has also been studied with spatially-resolved longslit spectroscopy (Schady et al. 2015), although it is unclear whether the ultra-long class of GRBs should be treated as phenomenologically distinct from the general LGRB population (e.g. Levan et al. 2014). In all studies where the host is successfully resolved into multiple components, the observations conclude that the explosion site metallicity is representative of the galaxy as a whole (Levesque et al. 2012).
GRB 020903 (sometimes also referred to as XRF 020903 given the soft but X-ray rich spectrum; Heise et al. 2001) was originally detected on 2002 September 3.421 UT on the Wide-Field X-Ray monitor and the Soft X-Ray Camera on the High Energy Transient Explorer-2 (HETE-2) (Soderberg et al. 2004). Originally the afterglow went undetected (Tristram et al. 2002; Price et al. 2002; Pavlenko et al. 2002; Uemura et al. 2002), given the interference from a nearby galaxy, and by the time Soderberg et al. (2004) detected an optical and radio afterglow (using the Palomar Observatory and the Very Large Array) the host galaxy dominated the optical spectrum. The radio afterglow was successfully observed and 1000 times more luminous than that of a Ibc supernova, indicating the presence of a GRB afterglow (Soderberg et al. 2004). An optical rebrightening was observed approximately 25 days after the initial detection, indicating that a supernova might be associated with the GRB (Soderberg et al. 2002; Bersier et al. 2006). Given the similarities between the light curve and spectral distribution curve of this afterglow to those of SN 1998bw, a supernova is the only plausible source for this GRB (Bersier et al. 2006). The first study of the LGRB host environment showed it to be a low-metallicity starburst galaxy and concluded that it appeared to have at least 4 interacting components (Soderberg et al. 2004; Levan et al. 2002). The explosion site itself has been previously observed spectroscopically and found to have one of the lowest metallicities measured for a GRB host, with log(O/H)+12 8.0 (Levesque et al. 2010a), as well as features of a significant Wolf-Rayet star population (Hammer et al. 2006; Han et al. 2010). However, the other three bright components of the host complex have never been spectroscopically observed, and it is unclear whether these are indeed the results of an interaction or merger (as proposed by Soderberg et al. 2004; Conselice et al. 2005; Wainwright et al. 2007) or whether the larger host complex contains an active galactic nucleus as proposed by Gal-Yam et al. (2002).
Here we present a spatially-resolved study of the GRB 020903 host galaxy, using long-slit spectra of multiple locations within the host complex. Observations and reductions are discussed in Section 2. We determine redshifts and ISM properties for these regions (Section 3) and discuss our results and comparisons with previous work in Section 4.
2 Observations & Reductions
2.1 Observations
We were allocated 4.5 hours of observing time through the Gemini Fast Turnaround program on the Gemini Multi-Object Spectrograph on Gemini South. Observations were carried out in queue mode during November and December of 2016 (see Table 1), with an image quality of 70111Our image quality criteria correspond to a point source FWHM of in the -band; see http://www.gemini.edu/sciops/telescopes-and-sites/observing-condition-constraints#ImageQuality for a complete discussion of Gemini image quality criteria. and a mean airmass of 1.19.
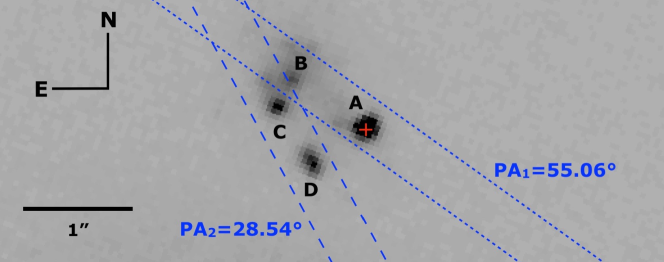
Our spectra of the GRB 020903 host complex were taken with the 0.5330′′ slit, using the B600 grating centered at 5000Å and the R400 grating (with the GG0405 blocking filter) centered at 7000Å for a total wavelength coverage of 3600Å to 9000Å (with the grating centers shifted by +50Å for half of our observations to avoid the detector gaps). Given the irregular nature of the GRB 020903 host complex, we observed spectra of the galaxy at two different specific position angles: 55.06∘ to observe the A (GRB explosion site) and B regions of the host, and 28.54∘ to observe the C and D regions (see Figure 1). As a result of this technique, some of our observations were taken well off of the parallactic angle (up to 62∘). Since this technique was the only means of ensuring that we could observe two regions of the host complex in a single observation, it rendered flux calibration of our data impractical.
To ensure that we did indeed capture the GRB host galaxy in the slit, we first centered the slit on nearby bright stars that would would place both the centered star and the specified regions of the host complex on the slit at the appropriate position angle. We then confirmed our slit placement in the raw 2D images, successfully identifying continua from the host spectra and other intervening objects at the appropriate positions along the slit.
A full summary of observing dates and configurations is given in Table 1; each configuration was observed for a total exposure time of 1800s. We also obtained standard quartz lamp and CuAr arc lamp observations for flatfield and wavelength calibrations. The pixel scale of the GMOS-S detector is /pix and the data were reading out in 2x2 binning mode, giving our data an image scale of /pixel.
| Date (UT) | PA (∘) | Grating | (Å) |
|---|---|---|---|
| 2016 Nov 5 | 55.06 | B600 | 5000 |
| 55.06 | B600 | 5050 | |
| 2016 Nov 28 | 55.06 | R400 | 7000 |
| 55.06 | R400 | 7050 | |
| 2016 Dec 2 | 28.54 | R400 | 7000 |
| 28.54 | R400 | 7050 | |
| 2016 Dec 20 | 28.54 | B600 | 5000 |
2.2 Reduction
The data were reduced using IRAF222IRAF is distributed by the National Optical Astronomy Observatories, which are operated by the Association of Universities for Research in Astronomy, Inc., under cooperative agreement with the National Science Foundation., primarily using the GMOS package tailored specifically for reduction of Gemini spectrograph data and including standard routines for bias correction, flatfielding, and cosmic ray removal. Initially, a single spectrum was extracted from each file using the IRAF task apall and a 10-pixel () aperture, large enough to yield composite spectra of regions A+B (for spectra taken at a position angle of 55.06∘) and C+D (for spectra taken at a position angle of 28.54∘).
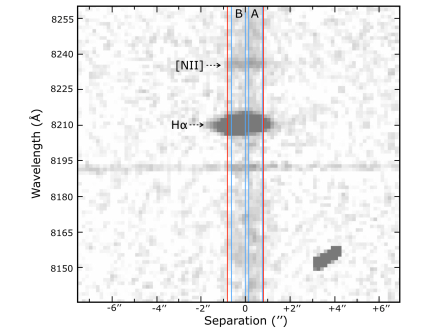
In addition, we extracted an H line profile in the spatial direction (also using the apall optimal extraction algorithm) for our A+B observations. The line profile revealed two spatially-distinct peaks in our A+B observations, f (5 pixels) apart, corresponding to separate spectra from the A and B regions (Figure 2) and discernible given the maximum FWHM image quality criteria required for executing our observations (FWHM in ); no similar distinction could be discerned in the line profiles for the C+D observations. To extract individual spectra of regions A and B within the host, we performed a second extraction centered on each peak with two smaller apertures of 4 pixels () to minimize blending from the two regions in the individual spectra. However, given the close proximity of the apertures (the peak of Region A is separated from the Region B aperture by only and vice versa) some contribution to the spectrum of each region from its neighbor is still to be expected. Assuming Gaussian brightness profiles for both regions we estimate a contribution of 10% from Region B in the Region A spectrum and 20% from Region A in the Region B spectrum.
Beginning on 2016 Sept 30 a new bias structure appeared on the GMOS-S detector following a full thermal cycle of the dewar. This most notably included broad bright vertical fringes and 1-pixel horizontal stripes in CCD2 and CCD3 that could not be reliably subtracted in full, and a significant increase in the detector noise (as much as five times higher than unaffected areas in CCD2). A solution for removing this bias structure was not found during engineering tests, but the problem spontaneously resolved following an unscheduled thermal cycle of the instrument on 2017 Feb 21. All of our observations were taken while this bias structure and excess noise were present on the detector, including biases (Gemini support advised using contemporaneous bias frames to minimize the effects of this problem). As the central chip, CCD2, was the most heavily affected, this made all data between 4800-5500Å (for our blue spectra) and 6000-7800Å (for our red spectra) unsuitable for line measurements. Our grating configurations did provide clean wavelength coverage below 4800Å and between 5500-6500Å (for the B600 grating centered at 5050Å) and between 7800-9000Å (for the R400 grating centered at 7050Å), successfully capturing the critical [OII]3727, H, [OIII]4959, [OIII]5007, H, and [NII]6584 features at the presumed GRB 020903 host redshift of in the clean regions of CCD3 (see Section 3.1 for further discussion).
To avoid compounding the effects of the CCD2 and CCD3 bias structures, we reduced each individual observation of the GRB 020903 host complex separately. The effects of the bias structure precluded effectively combining spectra taken with two different gratings or two different central wavelengths, since shifting bias structure and chip gap effects would inconsistently impact our emission features across different configurations. As a result, our final analyses were conducted using only the B600 =5050Å (where we detect the [OII], H, and [OIII] emission features of the GRB host) and R400 =7050Å spectra (where we detect the H and [NII] emission features of the GRB host) for the A and B regions. Due to a slight misalignment of the position angle, B600 spectra were not obtained for the C+D region, only R400 spectra (where we detect the H, [OIII]4959, H and [NII] emission features). [OIII]5007 is lost in the chip gap, and the C+D region was dimmer than the A+B region, making [OII]3727 indistinguishable from the continuum.
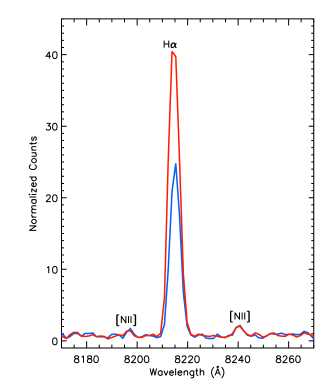
Figure 3 shows sections from the composite spectra of regions A+B and C+D, confirming that the redshift of these regions is z=0.251 and demonstrating how the C and D regions are significantly dimmer. This comes into significant effect when we consider any contributions from the C+D spectrum in the A+B spectrum and vice versa. Regions B and C in particular are quite close together; one could thus expect potential contributions from each region in the other’s spectrum. It is possible that region C+D is not strongly star-forming and thus does not contribute significant emission signatures to the A and B spectra. It is also possible that contribution of region B is too weak to be discerned in the C+D spectrum; however, this explanation seems unlikely given the relative brightness of region B in Figure 1. It is possible that the image quality during these observations was sufficient to avoid significant blending. Unfortunately, Gemini notes only the image quality percentile for individual exposures (corresponding here to FWHM in ), so the precise FWHM during these observations cannot be confirmed. More likely there is some blending between regions, especially between regions C and B, that is unavoidable.


3 Analysis
Emission line equivalent widths were measured by continuum normalizing the spectra using the task continuum and using the splot task in the kpnoslit package to integrate the pixel values of each spectral feature from the linear continuum. Table 2 summarizes the average line widths measured in regions A, B, and C+D, corrected for reddening and redshift effects.
| Wavelength | Region A (Å) | Region B (Å) | Region C+D (Å) |
|---|---|---|---|
| 3727 | 41.571.96 | 17.200.86 | NA |
| H | 59.191.80 | 30.141.12 | 7.431.00 |
| 4959 | 99.763.44 | 68.162.11 | 10.792.05 |
| 5007 | 321.710.71 | 218.87.35 | NA |
| H | 305.28.02 | 167.64.38 | 9.600.91 |
| 6584 | 9.420.63 | 8.640.51 | 0.510.10 |
The spectra were dereddened using the Pyastronomy package pyasl.unred.333https://github.com/sczesla/PyAstronomy values were calculated using the Cardelli et al. (1989) reddening law and the H/H line ratio, assuming case B recombination (H/H = 2.87) with an effective temperature of K and following Osterbrock (1989). We measured an = 0.030.03 in the A explosion site region, in good agreement with Levesque et al. (2010a). Region B had a slightly higher = 0.100.03, as did Region C+D with = 0.160.02.
After correcting the spectra for reddening effects, we proceeded to compare the metallicities of the three regions, using B and C+D as a comparative host regions to the GRB site A. We calculated metallicities using the R23 diagnostic presented in Kobulnicky & Kewley (2004) for regions A and B, which was calibrated using emission line equivalent widths and is thus well-suited for use with our data. Unfortunately the 3727 is not available for the C+D region. To compensate, we also include metallicities calculated using the O3N2 and N2 diagnostic calibrations of Pettini & Pagel (2004), though we note that these diagnostics are typically applied to data sets where line fluxes are available. The 5007 is not available for the C+D spectrum, so we adopt a 5007 / 4959 ratio of 3 and use this to estimate a 5007 line.
The resulting metallicities are given in Table 3. While there are offsets on the order of 0.1-0.2 dex between the different diagnostics (in agreement with the diagnostic offsets found by Kewley & Ellison 2008), we measure a metallicity of log(O/H)+12=8.00.1 for region A and B, and log(O/H)+12=8.10.2 for region C+D. While both the R23 and N2 diagnostic suggest that regions B,C, and D may have a slightly higher metallicity, all three diagnostics show that the two regions have comparable metallicities to within the errors (with the systematic errors of the metallicity diagnostic calibrations dominating the sources of error; see Kewley & Ellison 2008).
| Region | log(O/H) + 12 | ||
|---|---|---|---|
| PP04 | PP04 | ||
| A | 8.10.1 | 8.10.1 | 8.00.1 |
| B | 8.30.1 | 8.20.1 | 8.00.1 |
| C+D | NA | 8.20.2 | 8.10.2 |
The rest-frame equivalent width of the H emission line () can be used as a diagnostic of the age of the young stellar populations in a star-forming galaxy (e.g. Dottori 1981; Levesque & Leitherer 2013). Despite sensitivities to the initial mass function, metallicity, and stellar mass loss rate, is predominantly dependent on the evolution of HII regions. decreases monotonically with population age, and effects from electron temperature and density are negligible. Therefore, if a zero-age instantaneous burst star formation history is assumed can be used to approximate the typical age of the galaxy’s young stellar population (Copetti et al. 1986; Levesque & Leitherer 2013). To clarify, stars of this age dominate the galaxy’s continuum, so many young stars within the galaxy have ages equal to or less than the typical young stellar population age. It is also crucial to note the drawbacks of this method, particularly that it adopts a zero-age instantaneous burst star formation history when modeling how decreases with age (Copetti et al. 1986); in reality the star formation history of the galaxy is likely much more complex. Despite these limitations, the age - relation still provides a valuable, if approximate, insight on the young stellar population of the host galaxy.
We applied the equations for stellar population age derived by Levesque et al. (2010a), based on data from Schaerer & Vacca (1998), adopting a model metallicity of Z0.004 for all three regions following our own metallicity determination. Region A had a typical young stellar population age of Myr, while region B yielded a slightly older typical young stellar population age of Myr. Region C+D had a significantly older typical young stellar population age of Myr. This is in agreement with the predicted young ages of GRB progenitors and their parent stellar populations (Bloom et al. 2002; Berger et al. 2007), as well as predicted masses for GRB progenitors. Adopting the Georgy et al. (2013) stellar evolutionary tracks (adopting a sub-solar - log(O/H)+12 8 - metallicity similar to that of the GRB 020903 host and assuming non-rotating single star evolution), these ages correspond to a zero-age main sequence (ZAMS) mass of 40M⊙ for Region A, as compared to 32M⊙ for Region B and 20M⊙ for the C+D region. This is in good agreement with recent work on the presumed progenitor masses of GRBs: Larsson et al. (2007) estimated that GRB progenitors must have ZAMS masses significantly higher than 20M⊙ (with a model considering only main sequence lifetimes, making this a very conservative lower limit), while Raskin et al. (2008) use host galaxy modeling to conclude that progenitors of GRBs have ZAMS masses above 40⊙. The age and inferred ZAMS mass of Region A is thus in excellent agreement with basic predictions for GRB progenitors (though it is worth noting that the effects of rotation and binary interactions will also impact the expected ZAMS mass range of core-collapse progenitors as determined from stellar population ages).
Levesque et al. (2010a) determined a minimum age of 5.80.2 Myr for region A, the explosion site, based on a = 31.3. However, it is important to note that the GRB 020903 spectrum presented in Levesque et al. (2010a) was, unusually, taken only about a year after GRB 020903 was detected, on 2003 Oct 7. At this time the light from the explosion site may still be contaminated by the fading core-collapse supernova associated with the GRB (see, for example, Bersier et al. 2006), which would increase the continuum flux in the blue and lead to an underestimate of the equivalent width for the host’s nebular H emission. It should also be noted that blending with other components of the host (or background) galaxies could have complicated an accurate determination of the H equivalent width in Region A given that the Levesque et al. (2010a) spectrum was taken with a slit rather than the narrow slit used here at a position angle of 72.6∘. This set-up could potentially introduce blending with other components of the host complex depending on the seeing conditions.
4 Discussion and Future Work
Overall, our results show that the A region, the explosion site of GRB 020903, is less dusty and may contain a younger massive star population than B, C, and D regions. The young stars and low dust content suggest that Region A is likely the most recent and active site of star formation in the GRB 020903 host complex. This is in agreement with other spatially-resolved host studies of GRB host galaxies that have localized GRBs in the most strongly star-forming regions of their hosts. We also find that the all regions share comparably low metallicities based on the R23, O3N2, and N2 diagnostics. This is the most metal-poor host galaxy yet studied with spatially-resolved spectra, and our results agree with similar conclusions for the hosts of GRB 980425, 060505, 100316D, and 120422A, which all support relatively homogeneous metallicity within the galaxy (Christensen et al. 2008; Thöne et al. 2008; Levesque et al. 2011, 2012; Schulze et al. 2014; Izzo et al. 2017; Krühler et al. 2017).
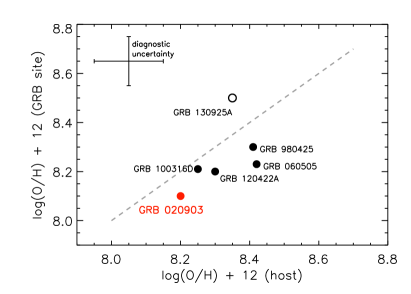
Figure 4 illustrates that all six existing studies of spatially-resolved GRB hosts (including the ultra-long GRB 130925A and our work on GRB 020903, but now excluding GRB 020819B based on Perley et al. 2017) measure explosion site and galaxy metallicities that agree to within the uncertainty of the diagnostics. This further supports evidence that explosion site metallicities can be considered representative of the entire host galaxy, and that GRB host metallicities determined from global spectra can be adopted as acceptable proxies for the natal metallicity of the GRB progenitor. It is worth noting that at the distances of most GRBs “site” metallicities remain unresolved on the scale of a kpc or more; for comparison, Niino et al. (2015) found that a 500 pc resolution is needed to discern metallicity variations and 100 pc resolution is needed to avoid systemic errors. However, at the typical distance of GRBs kpc resolution is the best attainable resolution for studying potential variations - even at relatively large scales - across their hosts.
This is, of course, based on the still-small sample of spatially-resolved GRB hosts with well-studied ISM properties. There are other GRB host galaxies where spatially resolved studies of the ISM are possible but have not yet been performed, including GRBs 990705, 011121, 030329, 060218, and 130427A (Levesque 2016). With a larger sample of spatially-resolved GRB host studies we could draw more concrete conclusions about the precise environments and parent populations that produce GRB progenitors, and how representative these regions are of the galaxies as a whole. These are also compelling future targets for integral field unit (IFU) spectroscopy, which offers the possibility of constructing finer-grained metallicity maps and clearly distinguishing between interacting components and foreground or background regions. Christensen et al. (2008) and Krühler et al. (2017) successfully obtained IFU observations of the very nearby (44Mpc) GRB 980425 host galaxy using VIMOS and MUSE (respectively) on the Very Large Telescope; in the future, IFU instruments on the Extremely Large Telescopes should make it possible to extend this work to greater distances and smaller angular sizes, allowing for a larger and more detailed census of GRB explosion sites.
Finally, in the case of GRB 020903, studies of additional ISM properties such as ionization parameter and star formation history, combined with dynamical studies that can highlight potential past interactions between the A region and the other host regions, will allow us to further characterize the key environmental parameters that led to the birth of the GRB’s progenitor star.
References
- Berger et al. (2007) Berger, E., Fox, D. B., Kulkarni, S. R., Frail, D. A., & Djorgovski, S. G. 2007, ApJ, 660, 504
- Bersier et al. (2006) Bersier, D., Fruchter, A. S., Strolger, L.-G., et al. 2006, ApJ, 643, 284
- Bloom et al. (2002) Bloom, J. S., Kulkarni, S. R., & Djorgovski, S. G. 2002, AJ, 123, 1111
- Cardelli et al. (1989) Cardelli, J. A., Clayton, G. C., & Mathis, J. S. 1989, ApJ, 345, 245
- Christensen et al. (2004) Christensen, L., Hjorth, J., & Gorosabel, J. 2004, A&A, 425, 913
- Christensen et al. (2008) Christensen, L., Vreeswijk, P. M., Sollerman, J., et al. 2008, A&A, 490, 45
- Conselice et al. (2005) Conselice, C. J., Vreeswijk, P. M., Fruchter, A. S., et al. 2005, ApJ, 633, 29
- Copetti et al. (1986) Copetti, M. V. F., Pastoriza, M. G., & Dottori, H. A. 1986, A&A, 156, 111
- Cucchiara et al. (2011) Cucchiara, A., Levan, A. J., Fox, D. B., et al. 2011, ApJ, 736, 7
- Dottori (1981) Dottori, H. A. 1981, Ap&SS, 80, 267
- Fruchter et al. (2006) Fruchter, A. S., Levan, A. J., Strolger, L., et al. 2006, Nature, 441, 463
- Fynbo et al. (2008) Fynbo, J. P. U., Prochaska, J. X., Sommer-Larsen, J., Dessauges-Zavadsky, M., & Møller, P. 2008, ApJ, 683, 321
- Gal-Yam et al. (2002) Gal-Yam, A., Ofek, E. O., Filippenko, A. V., Chornock, R., & Li, W. 2002, PASP, 114, 587
- Georgy et al. (2013) Georgy, C., Ekström, S., Eggenberger, P., et al. 2013, A&A, 558, A103
- Hammer et al. (2006) Hammer, F., Flores, H., Schaerer, D., et al. 2006, A&A, 454, 103
- Han et al. (2010) Han, X. H., Hammer, F., Liang, Y. C., et al. 2010, A&A, 514, A24
- Heise et al. (2001) Heise, J., Zand, J. I., Kippen, R. M., & Woods, P. M. 2001, in Gamma-ray Bursts in the Afterglow Era, ed. E. Costa, F. Frontera, & J. Hjorth, 16
- Izzo et al. (2017) Izzo, L., Thöne, C. C., Schulze, S., et al. 2017, ArXiv e-prints, arXiv:1704.05509
- Jakobsson et al. (2012) Jakobsson, P., Hjorth, J., Malesani, D., et al. 2012, ApJ, 752, 62
- Kewley & Ellison (2008) Kewley, L. J., & Ellison, S. L. 2008, ApJ, 681, 1183
- Kobulnicky & Kewley (2004) Kobulnicky, H. A., & Kewley, L. J. 2004, ApJ, 617, 240
- Kocevski et al. (2009) Kocevski, D., West, A. A., & Modjaz, M. 2009, ApJ, 702, 377
- Krühler et al. (2017) Krühler, T., Kuncarayakti, H., Schady, P., et al. 2017, A&A, 602, A85
- Krühler et al. (2015) Krühler, T., Malesani, D., Fynbo, J. P. U., et al. 2015, A&A, 581, A125
- Larsson et al. (2007) Larsson, J., Levan, A. J., Davies, M. B., & Fruchter, A. S. 2007, MNRAS, 376, 1285
- Le Floc’h et al. (2003) Le Floc’h, E., Duc, P.-A., Mirabel, I. F., et al. 2003, A&A, 400, 499
- Levan et al. (2002) Levan, A., Fruchter, A., Strolger, L., Burud, I., & Rhoads, J. 2002, GRB Coordinates Network, 1761
- Levan et al. (2014) Levan, A. J., Tanvir, N. R., Starling, R. L. C., et al. 2014, ApJ, 781, 13
- Levesque (2016) Levesque, E. M. 2016, IAU Focus Meeting, 29, 267
- Levesque et al. (2010a) Levesque, E. M., Berger, E., Kewley, L. J., & Bagley, M. M. 2010a, AJ, 139, 694
- Levesque et al. (2011) Levesque, E. M., Berger, E., Soderberg, A. M., & Chornock, R. 2011, ApJ, 739, 23
- Levesque et al. (2012) Levesque, E. M., Chornock, R., Soderberg, A. M., Berger, E., & Lunnan, R. 2012, ApJ, 758, 92
- Levesque et al. (2010b) Levesque, E. M., Kewley, L. J., Berger, E., & Zahid, H. J. 2010b, AJ, 140, 1557
- Levesque & Leitherer (2013) Levesque, E. M., & Leitherer, C. 2013, ApJ, 779, 170
- Niino et al. (2015) Niino, Y., Nagamine, K., & Zhang, B. 2015, MNRAS, 449, 2706
- Osterbrock (1989) Osterbrock, D. 1989, Astrophysics of Gaseous Nebulae and Active Galactic Nuclei, A Series of books in astronomy (University Science Books)
- Pavlenko et al. (2002) Pavlenko, E., Rumyantsev, V., & Pozanenko, A. 2002, GRB Coordinates Network, 1535
- Perley et al. (2016) Perley, D. A., Krühler, T., Schulze, S., et al. 2016, ApJ, 817, 7
- Perley et al. (2017) Perley, D. A., Krühler, T., Schady, P., et al. 2017, MNRAS, 465, L89
- Pettini & Pagel (2004) Pettini, M., & Pagel, B. E. 2004, MNRAS, 348, L59
- Price et al. (2002) Price, P. A., Schmidt, B. P., & Axelrod, T. S. 2002, GRB Coordinates Network, 1533
- Raskin et al. (2008) Raskin, C., Scannapieco, E., Rhoads, J., & Della Valle, M. 2008, ApJ, 689, 358
- Schady et al. (2015) Schady, P., Krühler, T., Greiner, J., et al. 2015, A&A, 579, A126
- Schaerer & Vacca (1998) Schaerer, D., & Vacca, W. D. 1998, ApJ, 497, 618
- Schulze et al. (2014) Schulze, S., Malesani, D., Cucchiara, A., et al. 2014, A&A, 566, A102
- Soderberg et al. (2002) Soderberg, A. M., Price, P. A., Fox, D. W., et al. 2002, GRB Coordinates Network, 1554
- Soderberg et al. (2004) Soderberg, A. M., Kulkarni, S. R., Berger, E., et al. 2004, ApJ, 606, 994
- Thöne et al. (2014) Thöne, C. C., Christensen, L., Prochaska, J. X., et al. 2014, MNRAS, 441, 2034
- Thöne et al. (2008) Thöne, C. C., Fynbo, J. P. U., Östlin, G., et al. 2008, ApJ, 676, 1151
- Tristram et al. (2002) Tristram, P., Castro-Tirado, A. J., Gorosabel, J., et al. 2002, GRB Coordinates Network, 1531
- Uemura et al. (2002) Uemura, M., Ishioka, R., Kato, T., & Yamaoka, H. 2002, GRB Coordinates Network, 1537
- Vergani et al. (2015) Vergani, S. D., Salvaterra, R., Japelj, J., et al. 2015, A&A, 581, A102
- Wainwright et al. (2007) Wainwright, C., Berger, E., & Penprase, B. E. 2007, ApJ, 657, 367
- Woosley (1993) Woosley, S. E. 1993, ApJ, 405, 273
- Woosley & Heger (2006) Woosley, S. E., & Heger, A. 2006, ApJ, 637, 914