VLBA imaging of the 3mm SiO maser emission in the disk-wind from the massive protostellar system Orion Source I
Abstract
Context. High-mass star formation remains poorly understood due to observational difficulties (e.g. high dust extinction and large distances) hindering the resolution of disk-accretion and outflow-launching regions.
Aims. Orion Source I is the closest known massive young stellar object (YSO) and exceptionally powers vibrationally-excited SiO masers at radii within 100 AU, providing a unique probe of gas dynamics and energetics. We seek to observe and image these masers with Very Long Baseline Interferometry (VLBI).
Methods. We present the first images of the 28SiO , maser emission around Orion Source I observed at 86 GHz (3mm) with the Very Long Baseline Array (VLBA). These images have high spatial (0.3 mas) and spectral (0.054 km s-1) resolutions.
Results. We find that the 3mm masers lie in an X-shaped locus consisting of four arms, with blue-shifted emission in the south and east arms and red-shifted emission in the north and west arms. Comparisons with previous images of the 28SiO , transitions at 7mm (observed in 2001–2002) show that the bulk of the transition emission follows the streamlines of the emission and exhibits an overall velocity gradient consistent with the gradient at 7mm. While there is spatial overlap between the 3mm and 7mm transitions, the 3mm emission, on average, lies at larger projected distances from Source I (44 AU compared with 35 AU for 7mm). The spatial overlap between the , and transitions is suggestive of a range of temperatures and densities where physical conditions are favorable for both transitions of a same vibrational state. However, the observed spatial offset between the bulk of emission at 3mm and 7mm possibly indicates different ranges of temperatures and densities for optimal excitation of the masers. We discuss different maser pumping models that may explain the observed offset.
Conclusions. We interpret the 3mm and 7mm masers as being part of a single wide-angle outflow arising from the surface of an edge-on disk rotating about a northeast-southwest axis, with a continuous velocity gradient indicative of differential rotation consistent with a Keplerian profile in a high-mass proto-binary.
Key Words.:
ISM: individual objects: Orion BN/KL — ISM: jets and outflows — masers — radio lines: stars — stars: formation1 Introduction
Massive stars are crucial to the evolution of galaxies: they are the main source of heavy elements and UV radiation and they provide turbulence to the interstellar medium, greatly affecting star and planet formation processes (Zinnecker & Yorke, 2007). However, high-mass star formation still remains a poorly understood phenomenon due to observational difficulties, mainly high dust extinction, clustering and large distances of high-mass star-forming regions, which hinder attempts to resolve disk-accretion and outflow-launching regions (Zinnecker & Yorke, 2007; Beuther et al., 2007; Beltrán & de Wit, 2016).
With very long baseline interferometry (VLBI), maser radiation from different molecules (OH, H2O, CH3OH, SiO, NH3) close to high-mass protostars and young stellar objects (YSOs) can be detected and imaged in the radio regime. Masers are ideal probes of early-stage high-mass star formation as they arise in compact bright spots that can easily be tracked with VLBI to study gas kinematics with sub-milliarcsecond angular resolution (e.g. Torrelles et al., 2001; Goddi et al., 2005; Sanna et al., 2010; Goddi et al., 2011; Moscadelli et al., 2016). They generally require velocity coherence along the line of sight and dense warm (or hot) gas for excitation. Different molecules enable studies of different regions in close proximity to high-mass compact objects (Elitzur, 1992; Cragg et al., 2005; Goddi et al., 2009; Hollenbach et al., 2013).
The closest known example of a high-mass YSO is Source I, an approximately equal-mass 20 M⊙ binary YSO (Goddi et al., 2011). It is deeply embedded in the Orion BN/KL nebula, at a distance of pc (Menten et al., 2007; Kim et al., 2008). Exceptionally, Source I excites SiO masers, which are usually only found in the circumstellar shells of evolved red giant stars. The Orion 28SiO masers were first discovered in 1973 (Snyder & Buhl, 1974) and linked to Source I by Menten & Reid (1995), making BN/KL the first of seven known high-mass star-forming regions to date where SiO masers have been observed (Hasegawa et al., 1986; Zapata et al., 2009; Ginsburg et al., 2015; Higuchi et al., 2015; Cho et al., 2016). These masers are particularly interesting because they require high temperatures and total gas densities – 1000-3000 K and cm-3 (Goddi et al., 2009), and thus are excited at small radii, thereby providing a unique probe of gas dynamics and energetics (Greenhill et al., 1998; Doeleman et al., 1999; Eisner et al., 2002; Kim et al., 2008).
SiO masers in Source I have been previously observed with VLBI at 43 GHz (7mm) and 86 GHz (3mm). Matthews et al. (2010) imaged the emission from the 7mm 28SiO rotational transition in the vibrational states based on a multi-epoch monitoring study in 2001–2002 and demonstrated that the masers arise at the surface of an (almost) edge-on disk and a wide-angle rotating outflow, at projected distances of 20–100 AU from the central YSO. The first VLBI observations of the 3mm (, ) 28SiO maser emission were carried out with the Coordinated Millimeter VLBI Array but resulted in a single short-baseline (85 km) detection, unsuitable to recover the maser flow structure with imaging (Doeleman et al., 2004). Nevertheless, this early experiment enabled a comparison between the bulk of maser emission at 7mm (Doeleman et al., 1999) and Gaussian-fitted average positions of 3mm emission, which suggested that the 3mm SiO emission occurs further away from the YSO than the 7mm emission. We have used the National Radio Astronomy Observatory’s111The National Radio Astronomy Observatory is a facility of the National Science Foundation operated under cooperative agreement by Associated Universities, Inc. (NRAO) Very Long Baseline Array (VLBA) to observe and image for the first time the 3mm SiO emission associated with Source I. The resulting images have a resolution comparable to the 7mm images by Matthews et al. (2010).
The organization of the paper is as follows. After summarizing the observations and data reduction process (Section 2), we present our VLBA images and compare our results with the 7mm images by Matthews et al. (2010) in Section 3. In Section 4, we discuss a suitable model for the gas kinematics around Source I (Section 4.1) as well as physical conditions in the SiO maser flow predicted by maser pumping models (Section 4.2). A summary is given in Section 5.
2 Data reduction and imaging
Observations of the 28SiO , transition toward Source I (, ) were made with all eight of the VLBA antennas equipped with 86 GHz receivers on January 24, 2011 (project code BG205). The observations were carried out in a single polarization (RR) with a total bandwidth of 64 MHz continuous over four intermediate frequency bands (IFs) to search for high-velocity components of the 28SiO , transition ( GHz).222None were found. The velocity range of detected 28SiO , emission was from 12.3 to 25.4 km s-1 (in the third IF). See . The data were processed with the VLBA correlator, yielding 1024 spectral channels per IF with a spectral channel spacing of 0.054 km s-1. The 8-hour track included four calibrator sources: 0528+134; 0458-020; 0539-037; and 0605-085. The total integration time on Source I was of 5.26 hours.
Data reduction utilized the NRAO Astronomical Imaging Processing System (AIPS). Visibilities with spurious amplitudes or phases were flagged. Parallactic angle corrections were applied to phases to correct for feed rotation on the sky at each antenna during the observations, and digital sampler bias corrections were applied to antenna-based amplitude offsets introduced by variations in transition voltages.
Atmospheric delay and instrumental delay and phase offsets were estimated for each IF of each antenna from a fringe fit on a five-minute calibrator scan (0528+134) where all antennas were present, using the task FRING. Due to the coherence time at 86 GHz being relatively short in comparison to the scan length, we looked for solutions every 30 seconds. Channel-averaging the data down to 128 channels also enabled a higher number of solutions found during the fringe search. Fringe solutions were found in all baselines except those to the Mauna Kea (MK) VLBA station, which were consequently flagged. Delay residuals and rates corrections were done using fringe fits on all available calibrator scans. Delay and rate solutions were then copied from the frequency-averaged data and applied to the original dataset.
The amplitude component of the bandpass calibration was estimated using the total-power spectra of the calibrator 0528+134 for each antenna, with the task BPASS, and applied to cross-power spectra for Source I. The phase portion of the bandpass calibration was estimated by fitting a complex polynomial to the cross-power spectra of the same calibrator with the task CPASS. Subsequently, preliminary amplitude calibration was carried out using standard NRAO gain curves for the antennas and system temperatures measured during the observations. Cross-power spectra for Source I were also Doppler-shifted to compensate for the Earth’s motion, using the task CVEL, and establishing a velocity scale in the Local Standard of Rest (LSR).
Next, residual fringe-rates were determined using a bright maser feature in an individual spectral channel as a reference. The solutions obtained in the reference channel were then applied to all spectral channels. Self-calibration was performed on the reference channel of the chosen maser feature first in phase only and then in both amplitude and phase. This was carried out by iteratively self-calibrating the single-channel data, using the task CALIB, and deconvolving interactively using CLEAN in the task IMAGR. The solutions were then applied in two steps, first phase-only and then both amplitude and phase, to the full spectral-line dataset.
An automated imaging and deconvolution of the dataset was executed using the task IMAGR, producing a line cube covering the whole velocity range where a signal was visible in the total-power spectra (from 14.2 to 27.9 km s-1). In order to reduce artifacts associated with strong side-lobes (as expected for an equatorial source with strong emission), the preliminary image cube was then interactively cleaned by carefully placing CLEAN boxes channel by channel. The resulting channel maps were used to replace individual channels in the original preliminary cube using the task MCUBE. All channels were cleaned to a level of 60 mJy beam-1. Imaging was done using a pixel size of 0.05 mas and an image size of 8192 8192 pixels, comparable to the 7mm images by Matthews et al. (2010). The restoring beam used had a size of 0.55 0.19 mas with a position angle of 0.0∘ (from north in an easterly direction). The thermal noise rms in the channels with no line emission ranged from 55 to 60 mJy beam-1 and the rms in the channels with strong line emission ranged from 80 to 90 mJy beam-1. Regional (over specific ranges of RA and Dec) and global (over the whole cube) spectra were extracted from the image cube using the task ISPEC. Individual components of the emission structure were extracted using the task SAD, by searching for emission and fitting two-dimensional ellipsoidal Gaussian models to each channel map of the SiO maser source above a detection threshold varying across channels, depending on the ratio of the strongest feature to the thermal noise rms in that channel (starting at 3 for channels where the ratio is below 10). This was adopted to control for the limited dynamic range of the images. This method identified 120 distinct maser features. The term ‘feature’ here indicates a collection of spectrally and spatially contiguous maser spots. A maser feature is considered real if it is detected in at least five contiguous channels (for a typical SiO line width of 0.3 km s-1), with a position shift of the intensity peak from channel to channel smaller than the FWHM size. Positions of the individual maser features were obtained by taking the intensity-weighted mean of the locations of the corresponding collection of Gaussian fits and radial velocities were determined by taking the intensity-weighted mean velocity (for more details on this method see Goddi & Moscadelli, 2006).
After imaging, the final cube was exported from AIPS and imported into the Common Astronomy Software Applications package (CASA) for moment analysis. The final zeroth (velocity-integrated total intensity) and first (velocity field) moment maps were generated using the CASA task immoments, removing channels with no emission and excluding pixels below the thermal noise rms of channels with no emission. The zeroth and first moments were generated with pixel flux thresholds of 0.1 Jy and 1.2 Jy respectively.
3 Results
We obtained images of the 3mm , 28SiO maser emission observed with the VLBA on January 24, 2011. The following sections describe the resulting images and comparisons with the 7mm and , 28SiO maser emission observed with the VLBA in the monitoring campaign from 2001–2002 (Matthews et al., 2010). We compared the maser emission structures using total intensity images (Section 3.1) and velocity fields (Section 3.2). We additionally characterized individual maser features from the Gaussian fits, measured velocity gradients and estimated spatial offsets between different transitions (Section 3.3). Furthermore, we used the resulting images to extract regional and global VLBI spectral profiles of the 3mm emission and compare them with the two transitions of the 7mm emission as well as with the total-power spectral profiles (Section 3.4).
3.1 The SiO maser emission structure
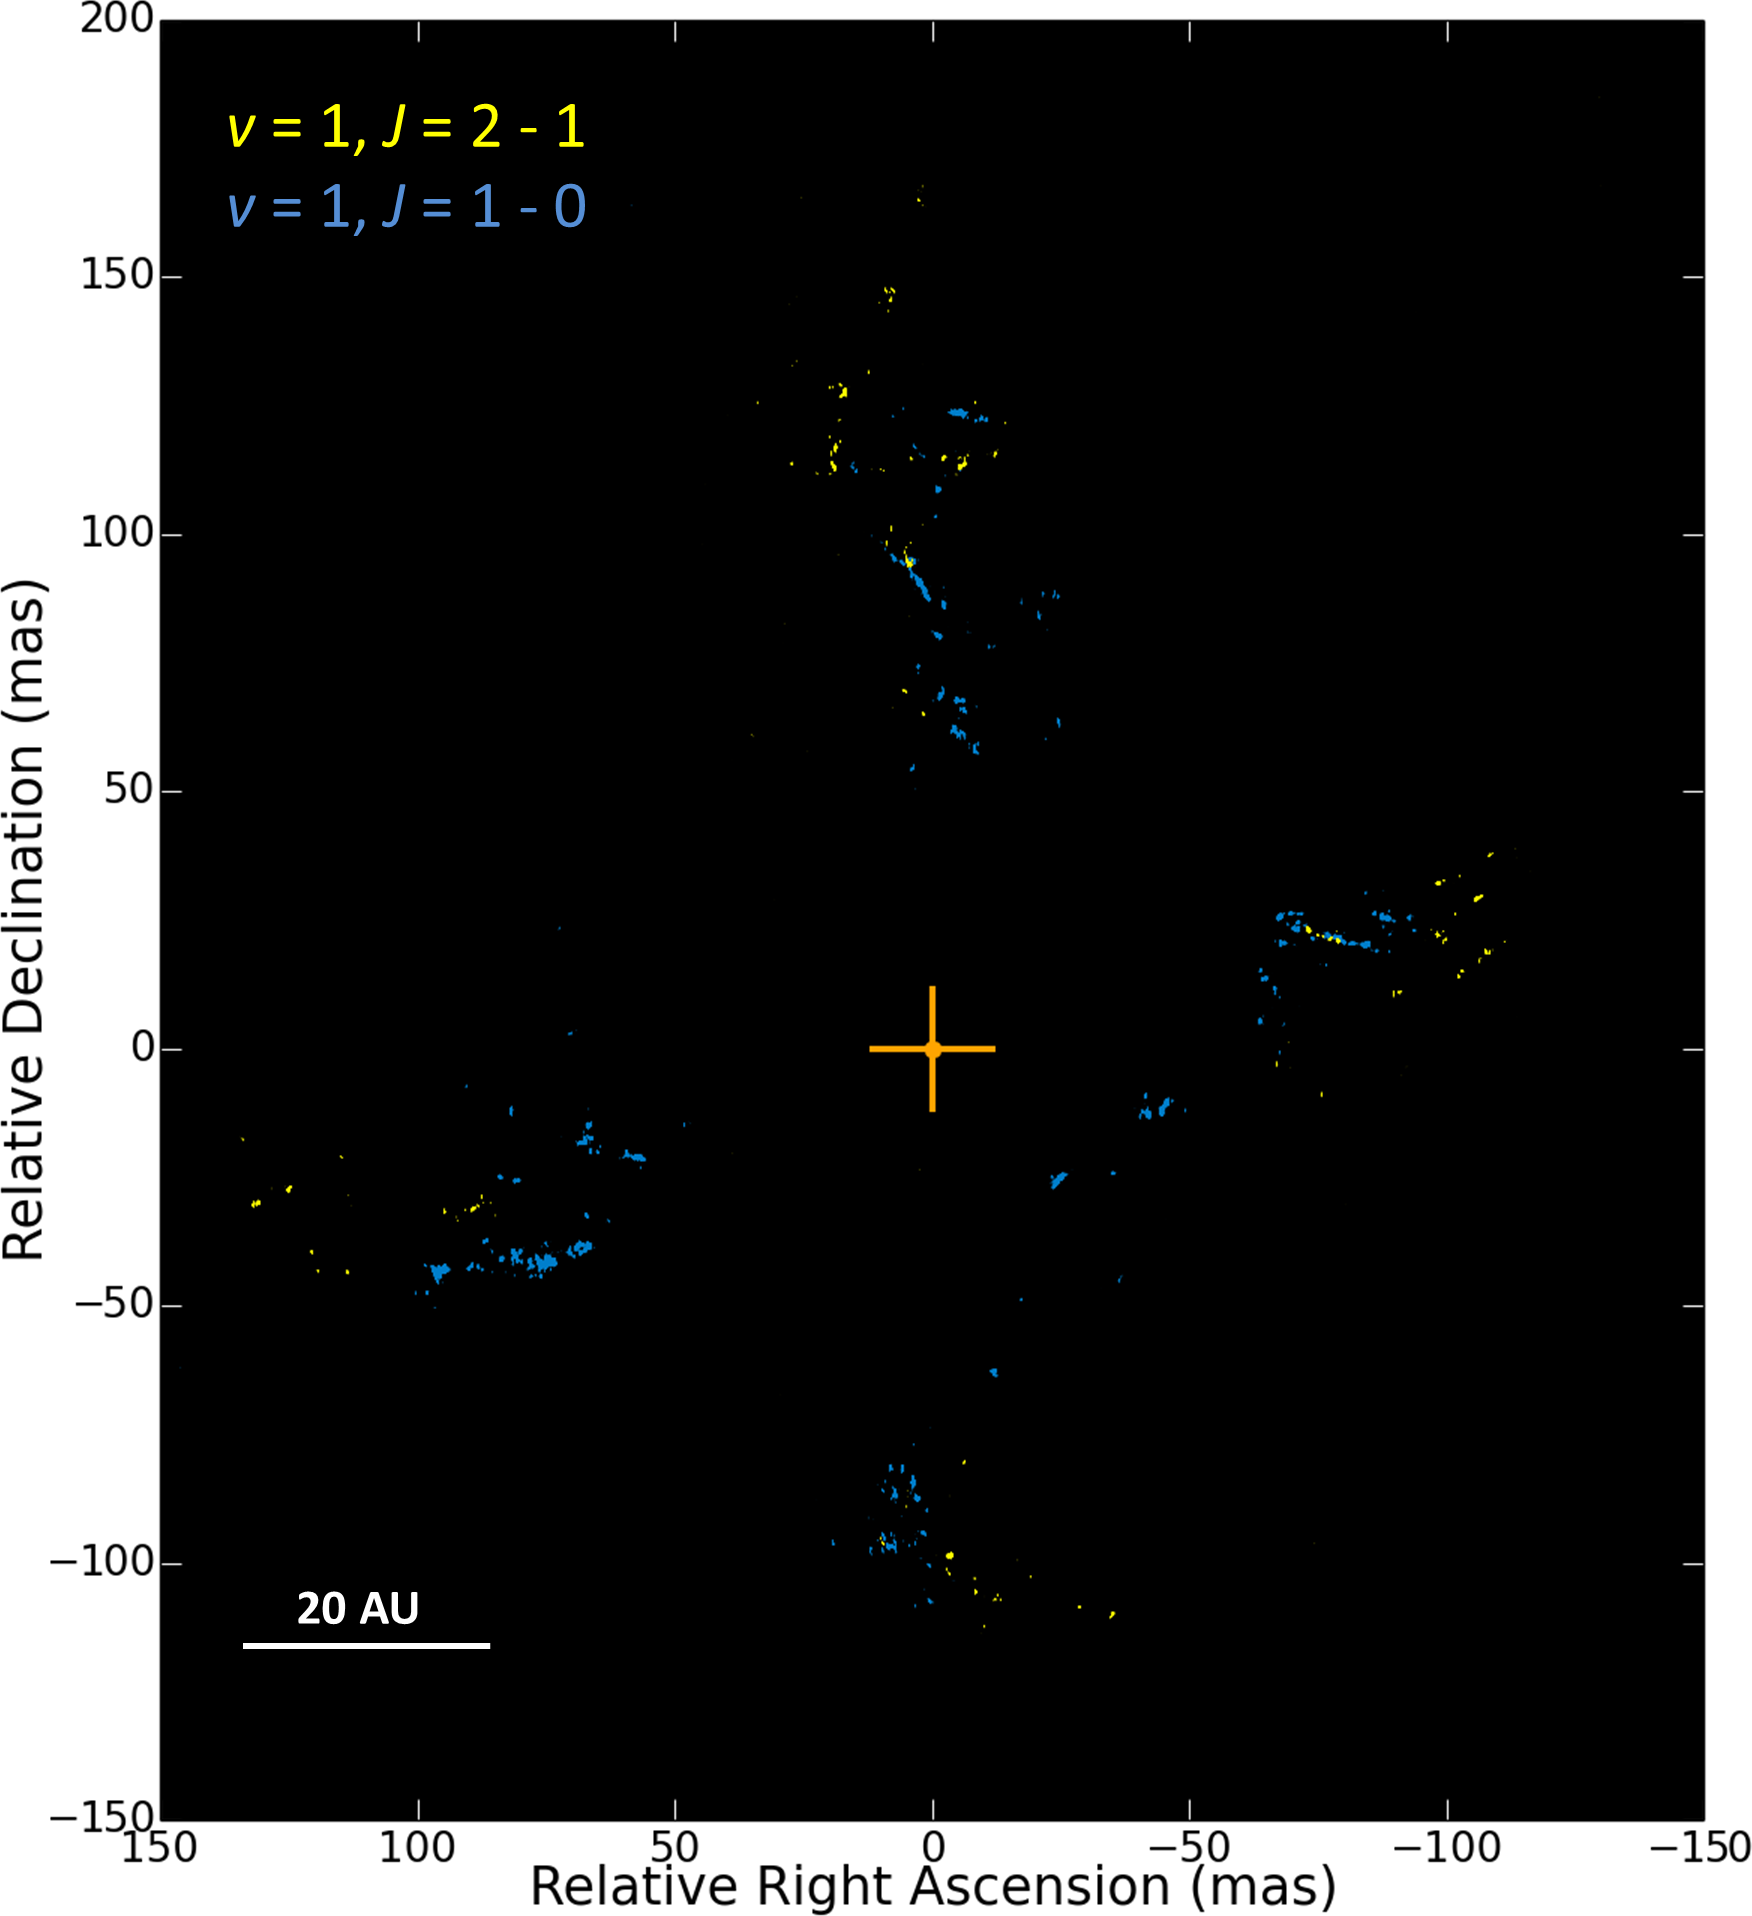
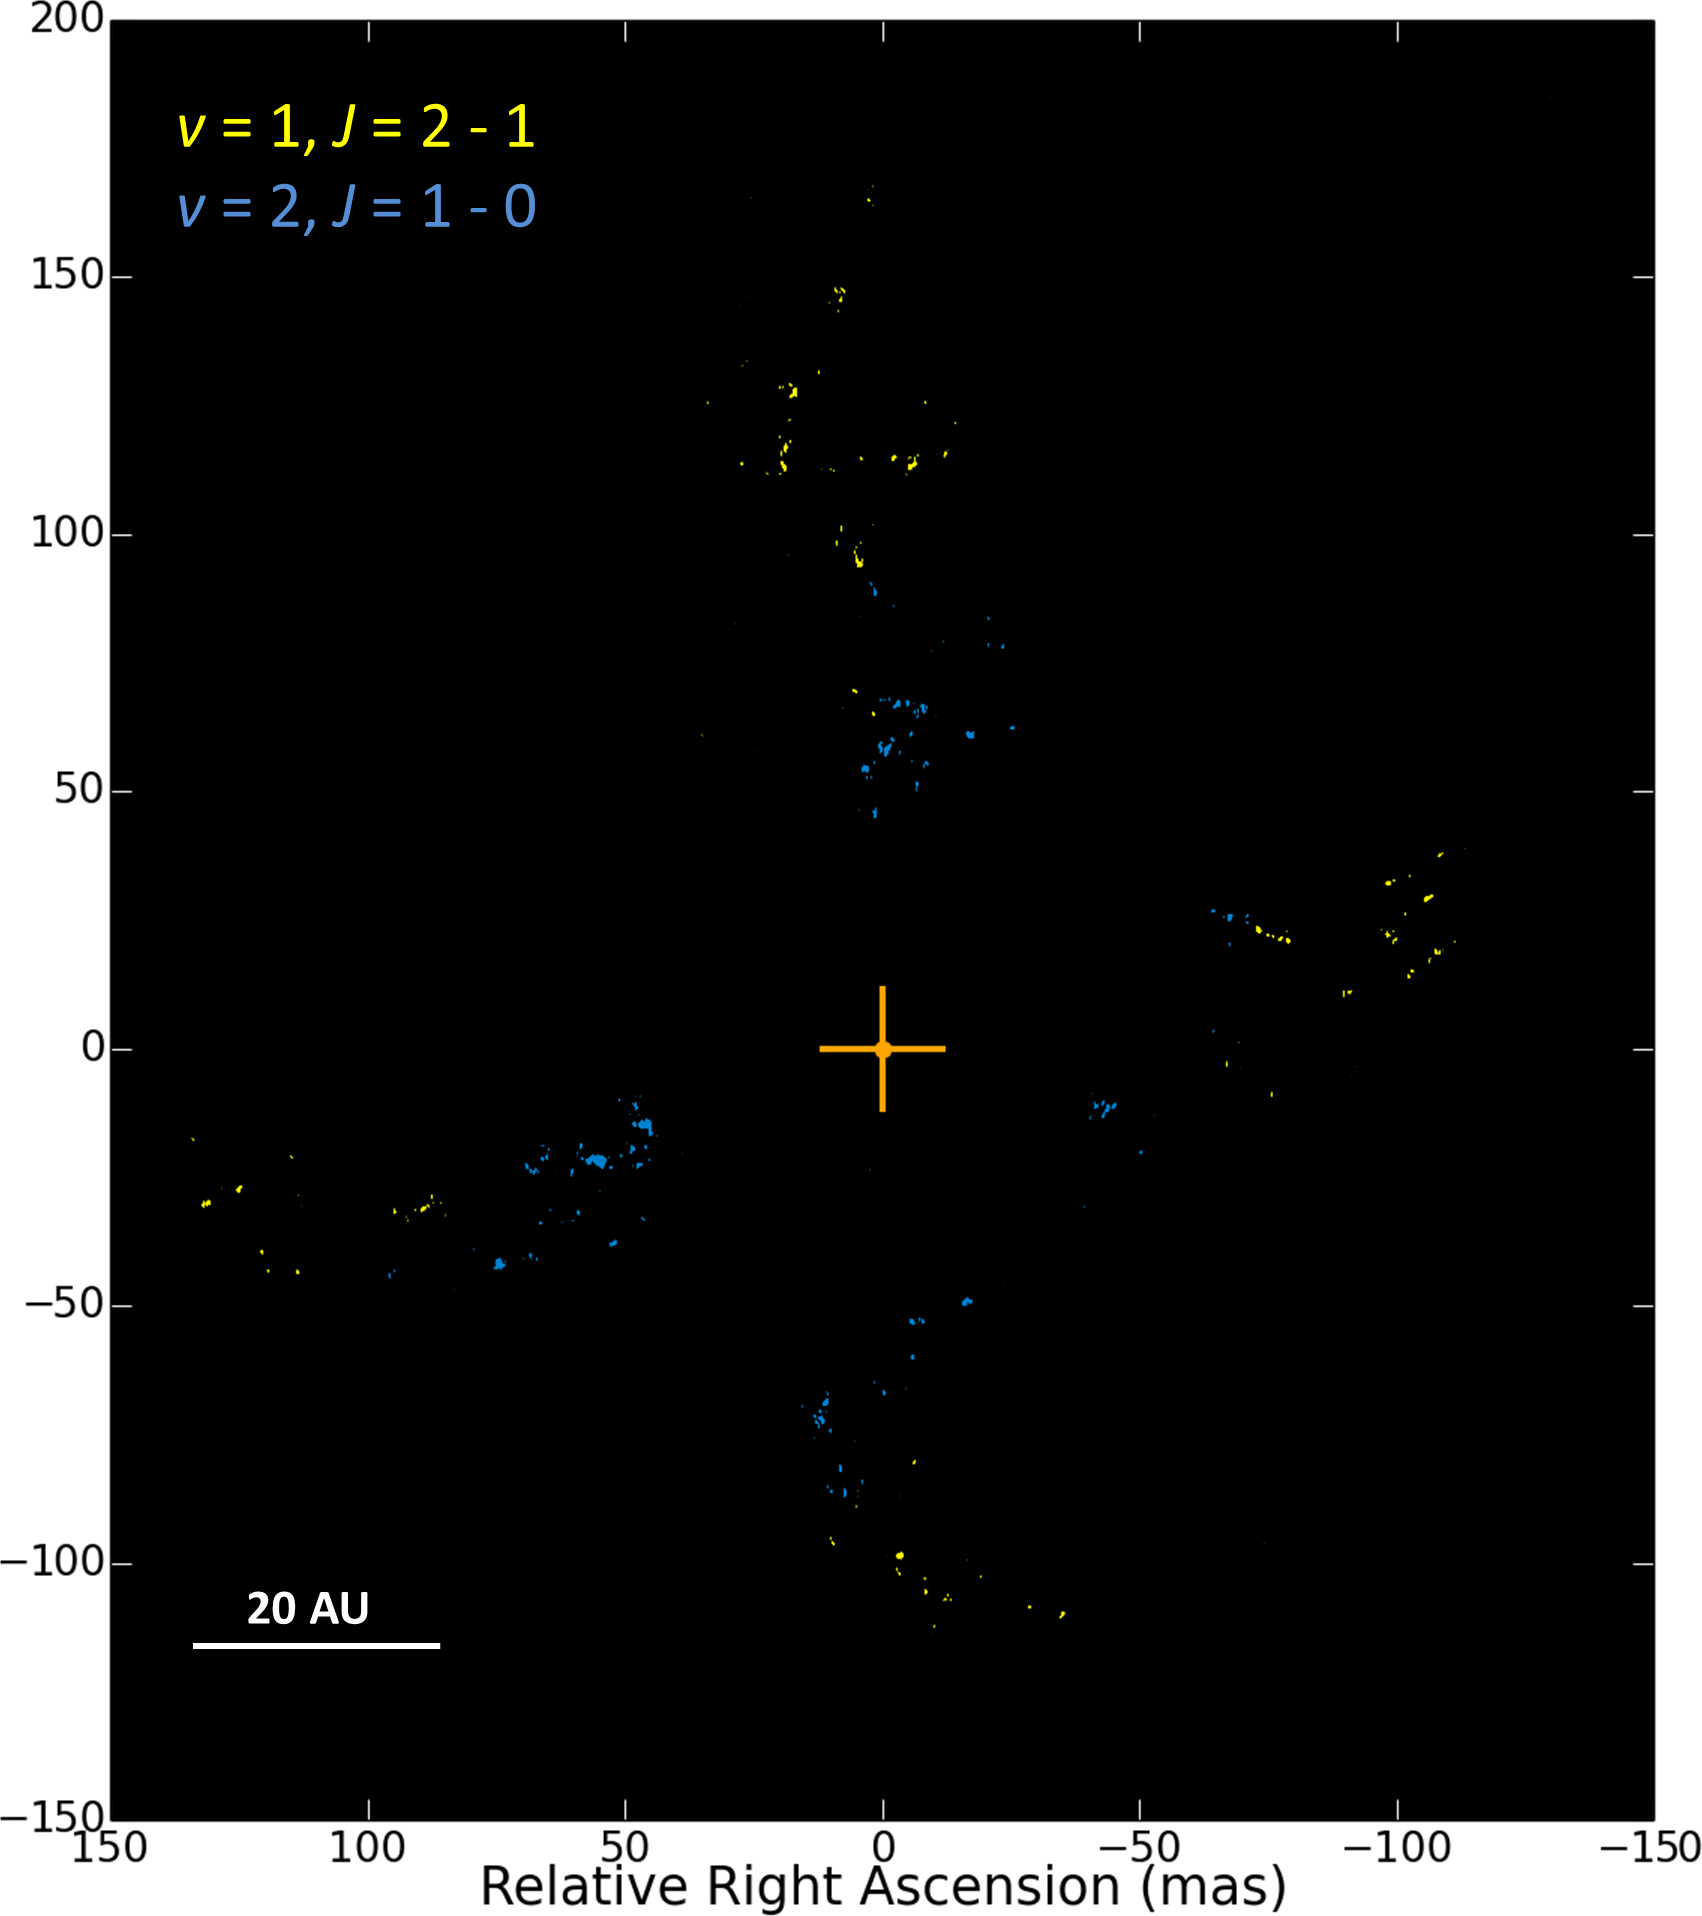
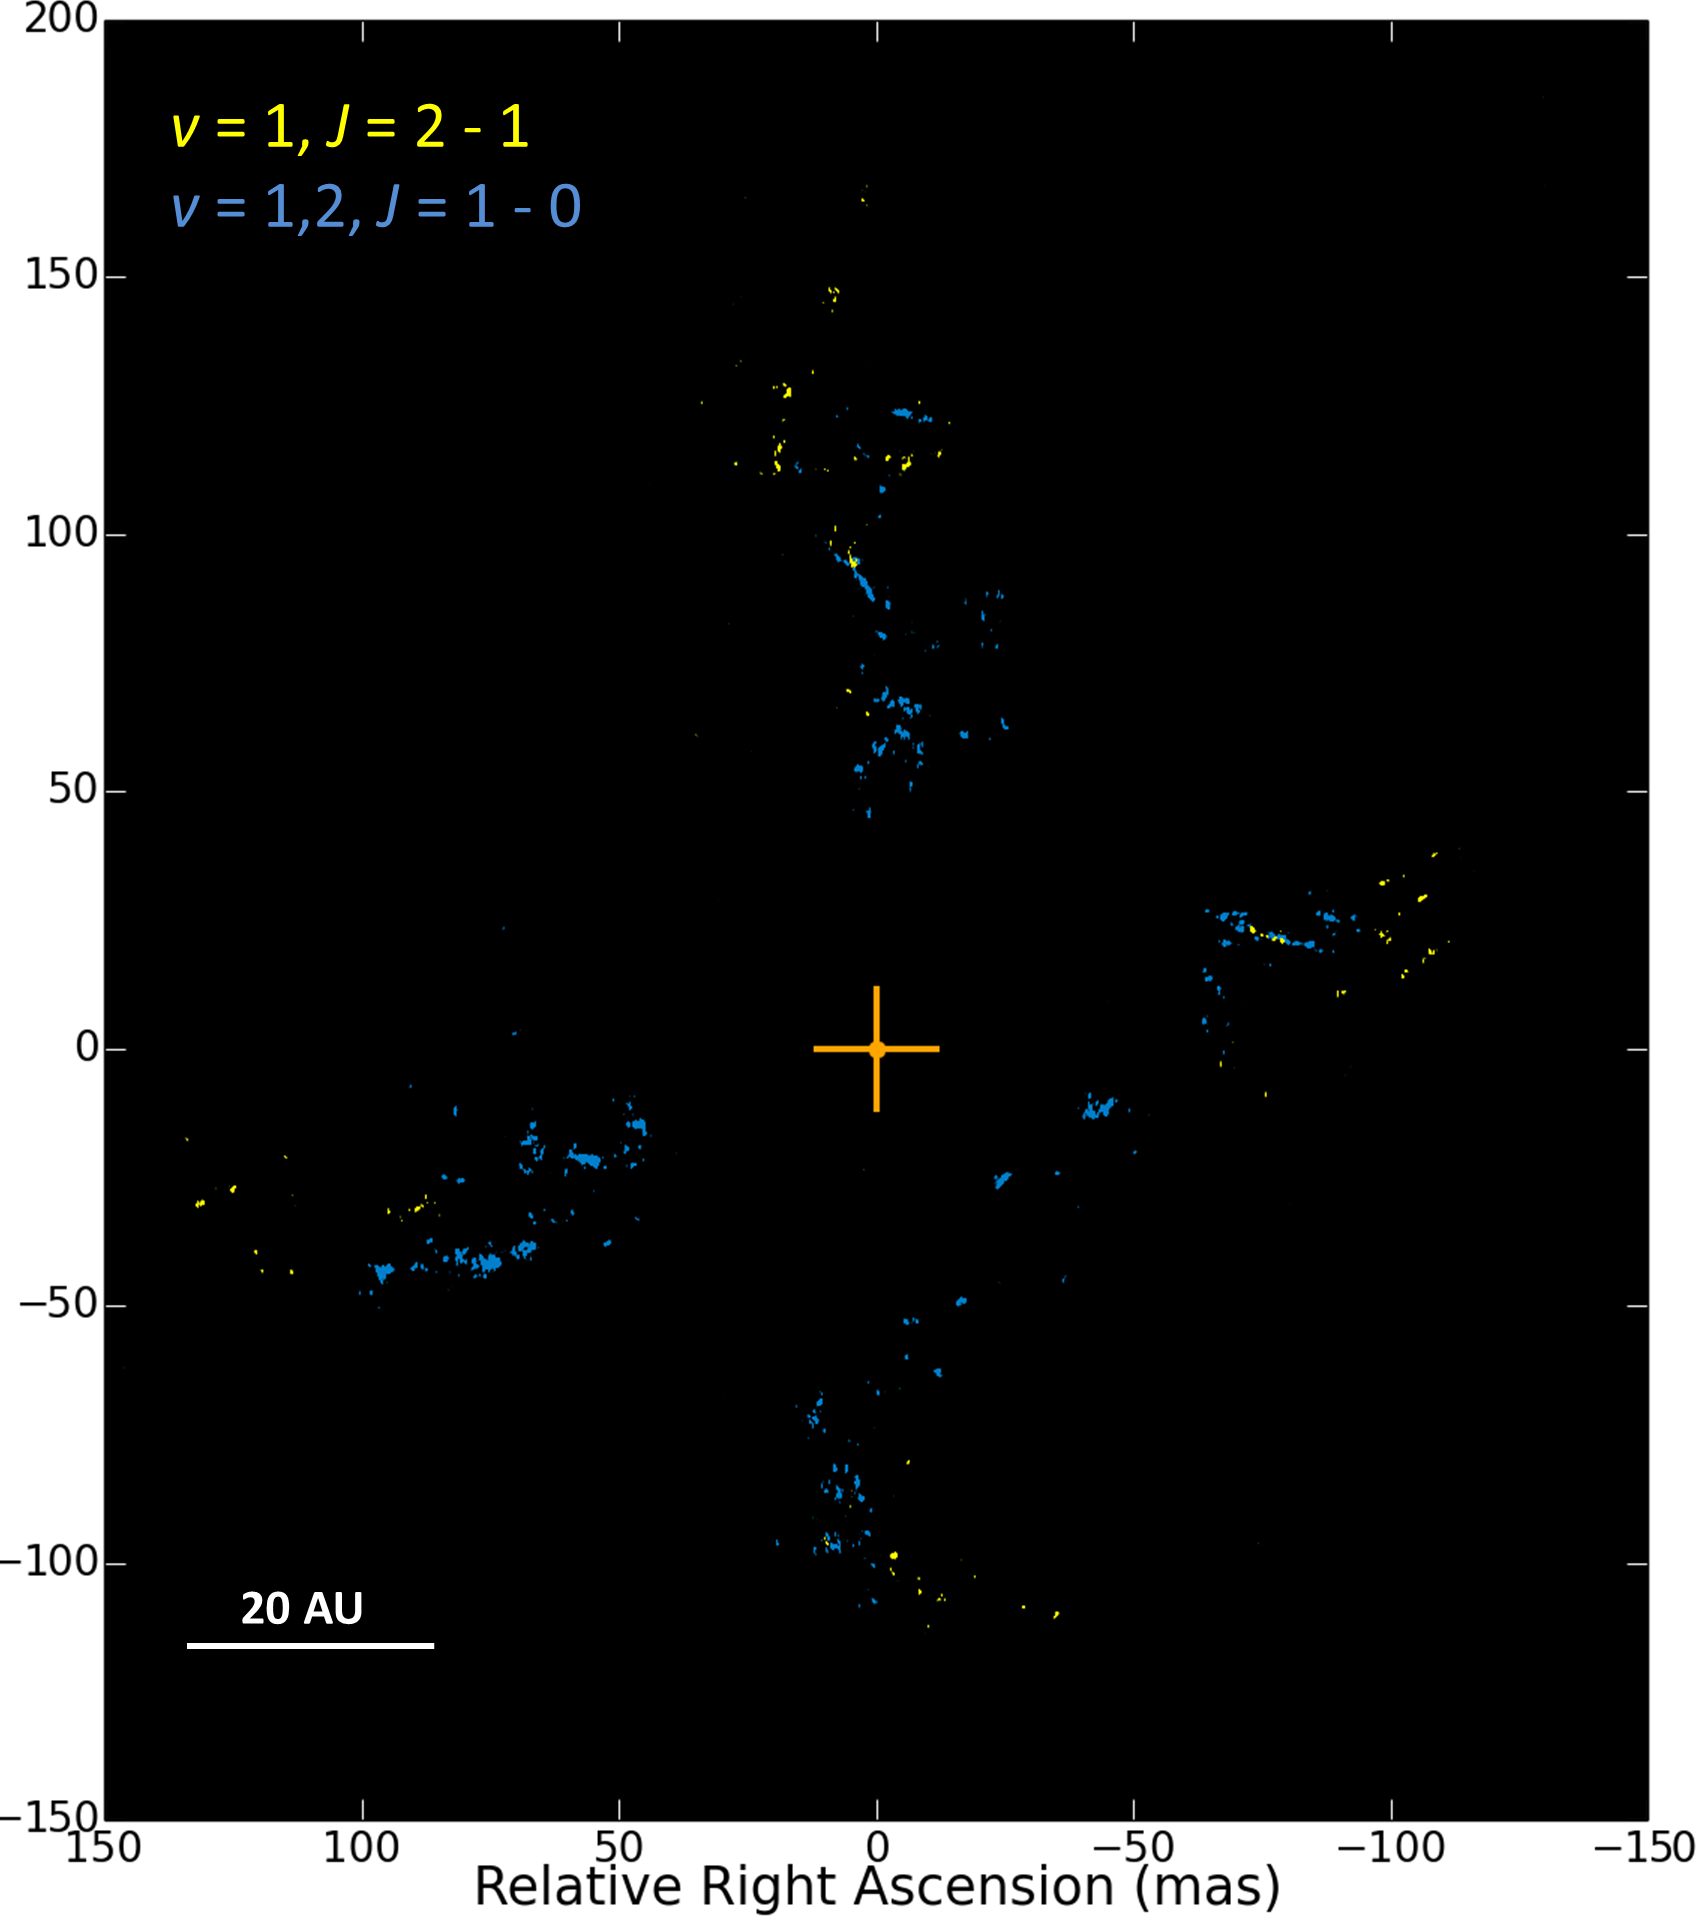
The velocity-integrated total-intensity map of the 28SiO , transition emission at 3mm was registered with velocity-integrated images of two 7mm transitions ( , ) and centered on Source I (shown in Fig. 1). The putative position of Source I (center cross) in the images of individual transitions was estimated using the intersection of linear fits of the north-south and east-west maser regions, using maser emission intensity as weights. For a one-to-one comparison, a single epoch from the 2001–2002 monitoring campaign at 7mm was selected, observed on October 7, 2002 (Matthews et al., 2010).
Based on the overlays shown in Fig. 1, we can assess that the 28SiO 3mm emission has an X-shaped distribution, consistent with that known for 7mm emission. In particular, the 3mm masers lie in four distinct regions, or arms, extending to the north, west, south and east, and centered on Source I. Interestingly, although some overlap is present between the 3mm and 7mm emission in the four arms (Fig. 1, right panel), the 3mm emission appears to systematically prefer larger radii further away from Source I, as first noticed by Doeleman et al. (2004). No 3mm emission is seen in the inner regions, at radii less than 25 AU from the position of Source I, nor in the bridge observed in the 7mm image. Here the bridge refers to the emission connecting the south and west arms at 7mm, and in the model presented in Fig. 2 of Matthews et al. (2010) it traces the limb-brightened edge of a rotating disk.
Regarding individual transitions, the overlay of the 3mm velocity-integrated total-intensity image with that of the 7mm (Fig. 1, center panel) shows significantly less overlap than the overlay with the 7mm image (Fig. 1, left panel). This suggests that there should be regions where the transition at 3mm occurs in similar gas volumes to the transition at 7mm of the same vibrational state, but in different gas volumes to that of a higher vibrational state (). However, due to the overall spatial offset observed between the bulk of the 3mm and the 7mm masers, even rotational transitions in the same vibrational state likely require different ranges of physical conditions for optimal excitation. Based on this finding, it is reasonable to assume that regions with a spatial overlap between the transitions at 3mm and 7mm likely have a set of density and temperature ranges where physical conditions are favorable for both transitions, while regions with no spatial overlap exhibit conditions favorable to only one of the two. In particular, we expect the , and the , transitions to have distinct physical conditions since no overlap is found.
A caveat is that the high-resolution 7mm observations were carried out ten years before these 3mm observations. We thus cannot exclude that variability in the source structure over 10 years may affect a cross-comparison between the two transitions. Nevertheless, the good correspondence between the observed spatial and velocity structures (see also Section 3.2) suggests that time variability does not likely affect the bulk structure of the emission at the two frequencies. Therefore, we are confident that the overlays presented here are a good approximation of the spatial correspondence between the 3mm and 7mm maser emission.
| Region | [AU] | [AU] | [AU] | [AU] | for 3mm | for 3mm |
|---|---|---|---|---|---|---|
| (3mm ) | (3mm ) | (7mm ) | (7mm ) | and 7mm [AU] | and 7mm [AU] | |
| North | 48 8 | 52 2 | 44 8 | 35 7 | 8 | 17 |
| West | 39 6 | 40 9 | 34 6 | 34 6 | 6 | 6 |
| South | 41 5 | 39 2 | 36 5 | 32 5 | 3 | 7 |
| East | 48 8 | 47 9 | 35 7 | 34 7 | 12 | 13 |
3.2 The SiO velocity field
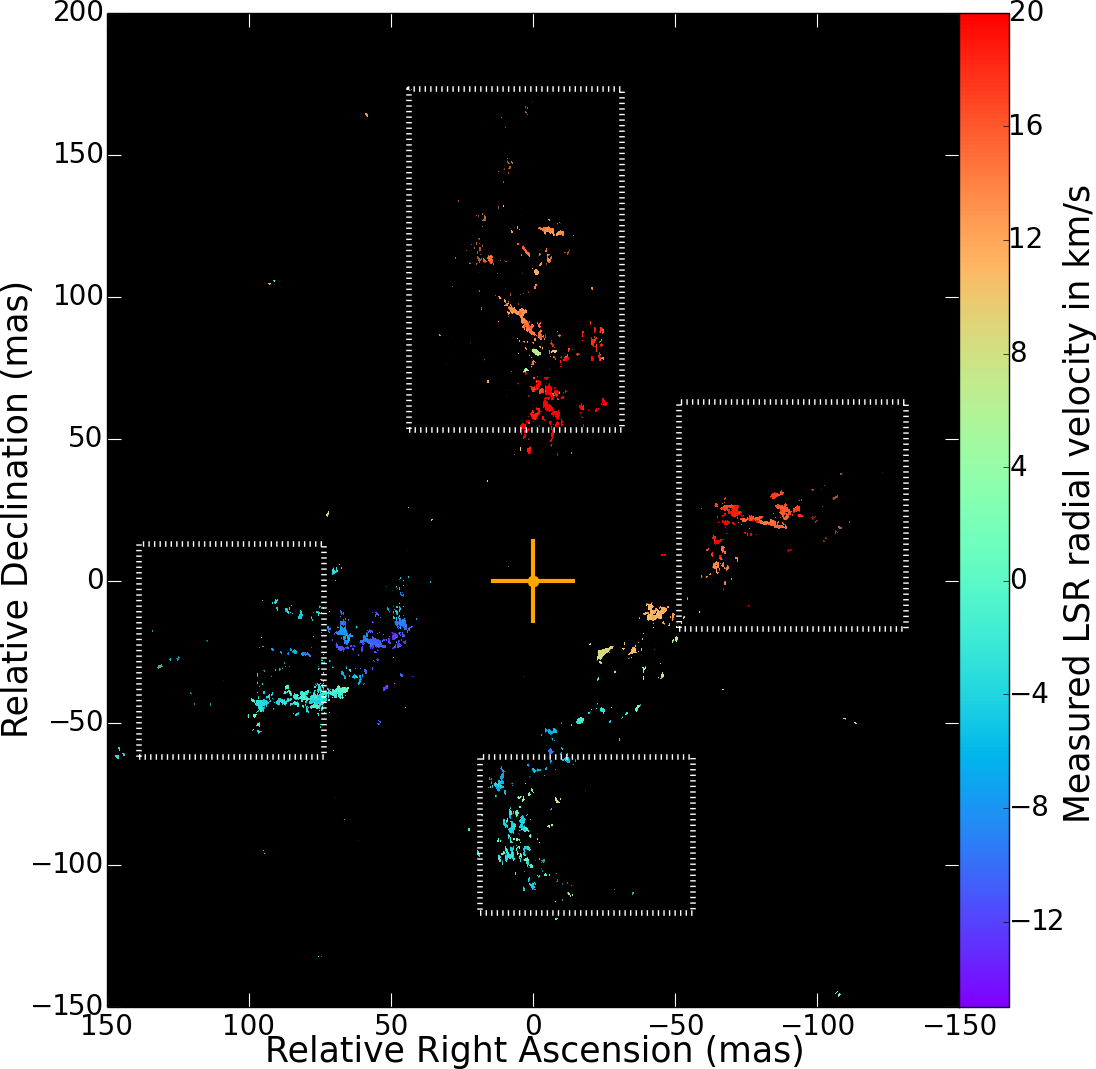
We registered the velocity field map of the 3mm emission with a single epoch 7mm velocity field ( ; Fig. 2). This map clearly shows that the east and south arms are blue-shifted while the north and west arms are red-shifted around a systemic velocity for Source I estimated at km s-1. Moreover, the maser emission at 3mm and 7mm cannot be easily differentiated from each other as they show considerable overlap in position and velocity spread, and show a continuous velocity gradient in all four arms. Nonetheless, the 3mm emission (delimited by the dashed boxes in Fig. 2) has a smaller velocity range (12.3 km s-1 to 25.4 km s-1) than the 7mm emission (14.1 km s-1 to 26.5 km s-1) and lies, on average, at larger projected distances from Source I (as first noticed in § 3.1). This is consistent with a Keplerian rotation velocity profile, where faster rotation occurs closer to the YSO. This strongly supports the hypothesis that both the 3mm and the 7mm SiO maser emission must come from the same wide-angle outflow, undergoing the same Keplerian rotation around a northeast-southwest rotation axis (see full discussion in § 4.1).
3.3 The individual maser features at 3mm
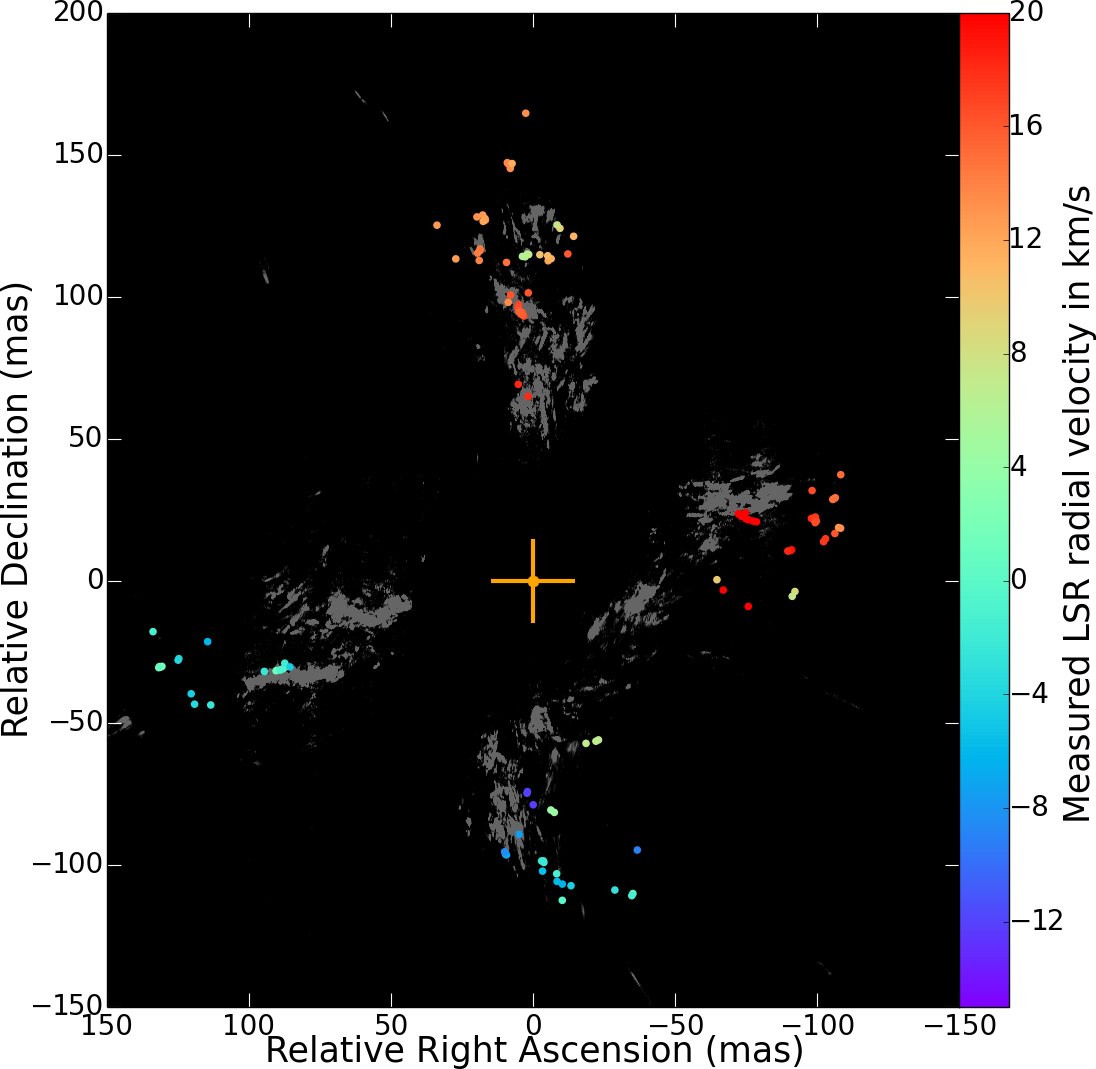
We report positions and LSR velocities of the Gaussian-fitted individual maser features of the 3mm , transition in Fig. 3, where they are overlaid on the velocity-integrated intensity emission at 7mm (Matthews et al., 2010). The 7mm map comprises a combination of 19 epochs of and data spanning 22 months. The Gaussian-fitting technique enabled the recovery of low-intensity features in channels with strong emission and in channels where no emission was found in the moment maps. Weaker features were recovered in the north and south arms and most notably three individual components were extracted in the region between the south and west arms, close to the base of the south arm. These features do not seem to correspond to the broad structure of the south arm and have radial velocities near the systemic velocity. This could possibly be a component of a 3mm bridge, similar to the bright bridge present at 7mm (e.g. Fig. 2). These features do not however possess a 7mm counterpart at a similar velocity nor in the same region. It is thus likely that these new features are sampling a different volume of gas than the bridge emission at 7mm.
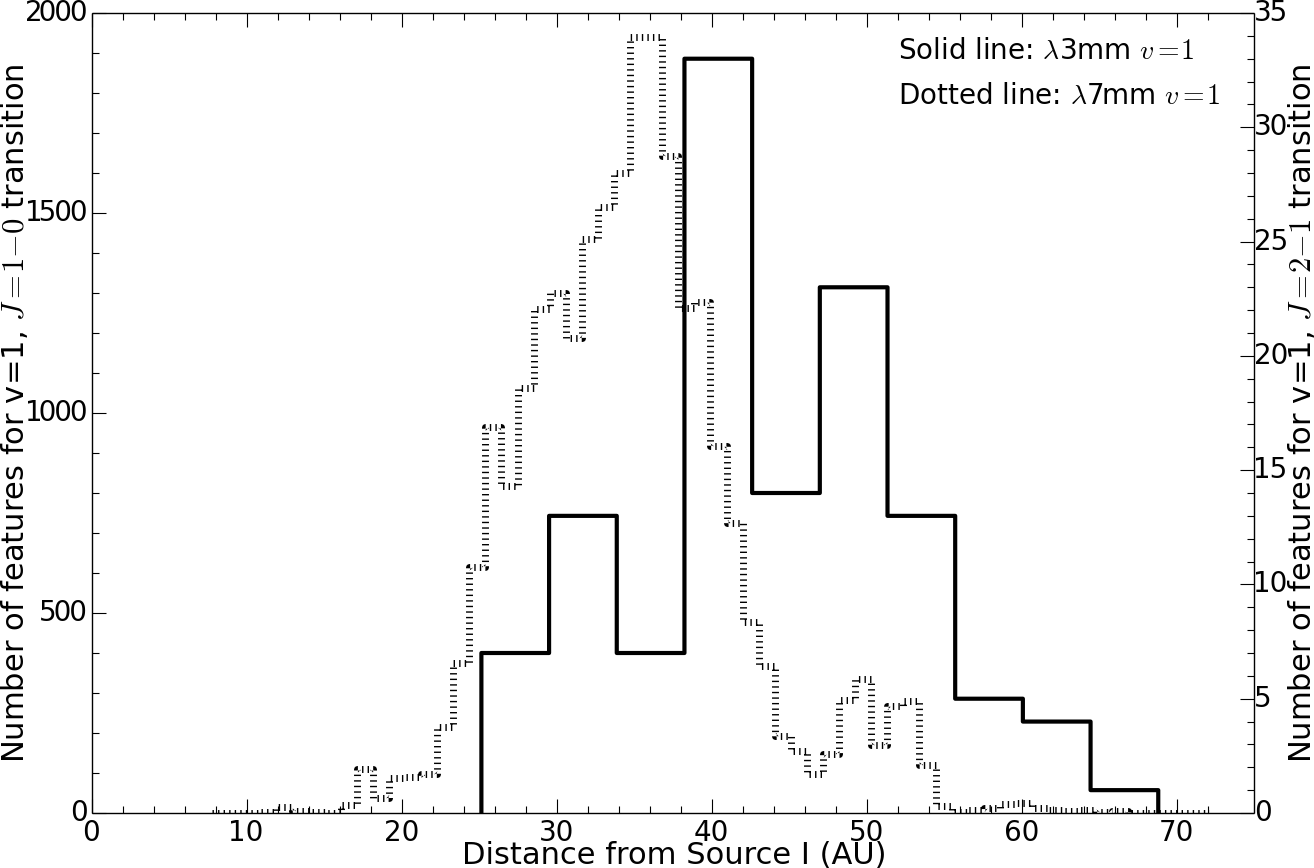
We measured distances of the extracted individual features from the central object Source I at 3mm and we compared the resulting spatial distribution to the 7mm distribution by Matthews et al. (2010), shown in Fig. 4. There is significant overlap between the two distributions, suggesting that the two transitions at may share common radii of excitation from the source. However, the peak of the 3mm distribution is offset from the 7mm peak by 5–15 AU, a result consistent with the position offsets estimated by Doeleman et al. (2004).
We additionally measured centroid distances from Source I in each arm both for individual features and from the velocity-integrated total-intensity map, using maser intensities as weights. These centroid distances are on average 50 AU for the north and east arms and 40 AU for the south and west arms (Table 1), which correspond to the peaks of the 3mm maser feature distribution (Fig. 4). The intensity map technique was also used to measure centroid distances of each arm for the single-epoch 7mm and velocity-integrated intensity maps. Using these estimates, we obtained the spatial offsets between the 3mm and 7mm SiO maser emission, presented in Table 1. This provides a quantitative confirmation of the statement (made in Section 3.1) that the bulk of the 3mm is closer overall to the 7mm emission (7 AU offset) than to the emission (11 AU offset). We also note that the offsets between the 3mm and 7mm emission centroids found with the velocity-integrated intensity map method are consistent with the peak offset determined from the feature distribution histograms in Fig. 4.
Finally, we used the Gaussian-fitted individual maser features to estimate velocity gradients across each arm. Both red-shifted arms (north and west) and the blue-shifted south arm have measurable velocity gradients, consistent with a deceleration as a function of distance from the source. No velocity gradient was observed in the east arm. In particular, the red-shifted north and west arms have individual velocity gradients of 0.170.05 km s-1 AU-1 and 0.40.1 km s-1 AU-1 respectively and the blue-shifted south arm has a velocity gradient of 0.30.2 km s-1 AU-1. These correspond to an overall velocity gradient of 0.30.1 km s-1 AU-1, consistent with the single-arm gradient estimated by Doeleman et al. (2004) and the overall gradient at 7mm measured by Matthews et al. (2010). A single overall gradient for both the 3mm and 7mm SiO maser emission points towards a global property of the outflow, notably a differential rotation with a Keplerian velocity profile, rather than a deceleration due to a localized phenomenon.
3.4 The SiO spectral profiles
3.4.1 The regional spectral profiles at 3mm
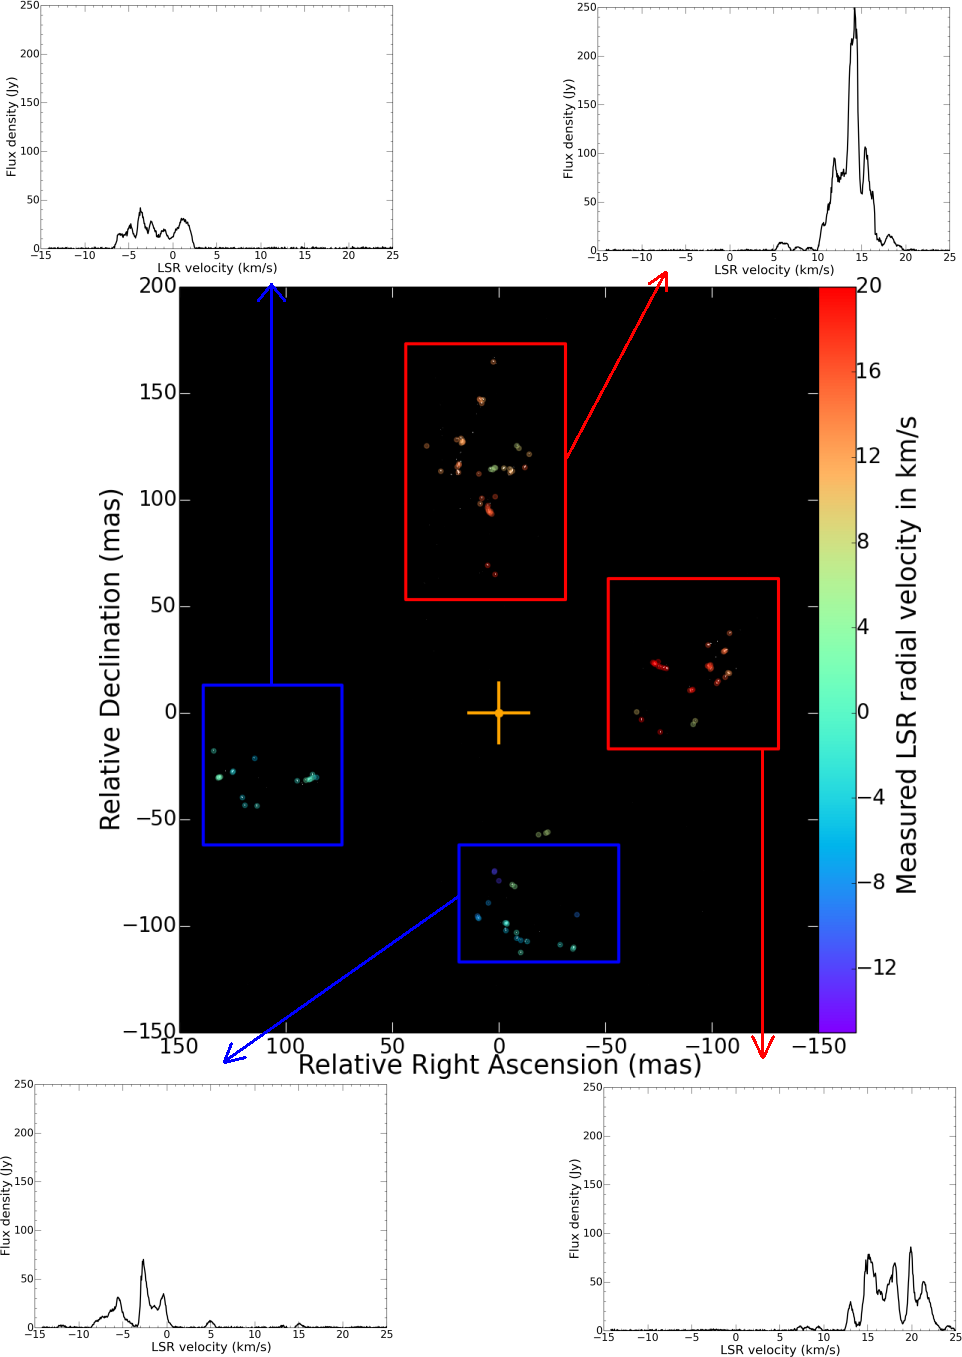
We extracted subsets of spectra from the line cube in different spatial regions, in order to assess the velocity and intensity contributions of each distinct arm to the total 28SiO , emission spectrum around Source I, as illustrated in Figure 5. Individual spectra of emission for the four distinct regions show similar velocity ranges between the two blue-shifted arms (south and east) and the two red-shifted arms (north and west). The velocity ranges of emission in each arm are reported in Table 2, in both the LSR frame and in the reference frame of Source I ( km s-1).
Furthermore, each regional spectrum covers a similar velocity range to previous observations at 3mm (Doeleman et al., 2004), suggesting that there is no obvious long-term evolution of the velocity distribution of the 3mm maser emission over the last 10 years.
| Region | LSR velocity range | Source I velocity range |
|---|---|---|
| [km s-1] | [km s-1] | |
| North arm | 6.2 to 18.4 | 0.7 to 12.9 |
| West arm | 7.2 to 25.4 | 1.7 to 19.9 |
| South arm | 12.3 to 4.7 | 17.8 to 0.8 |
| East arm | 6.1 to 2.4 | 11.6 to 3.1 |
3.4.2 The global integrated spectral profile at 3mm
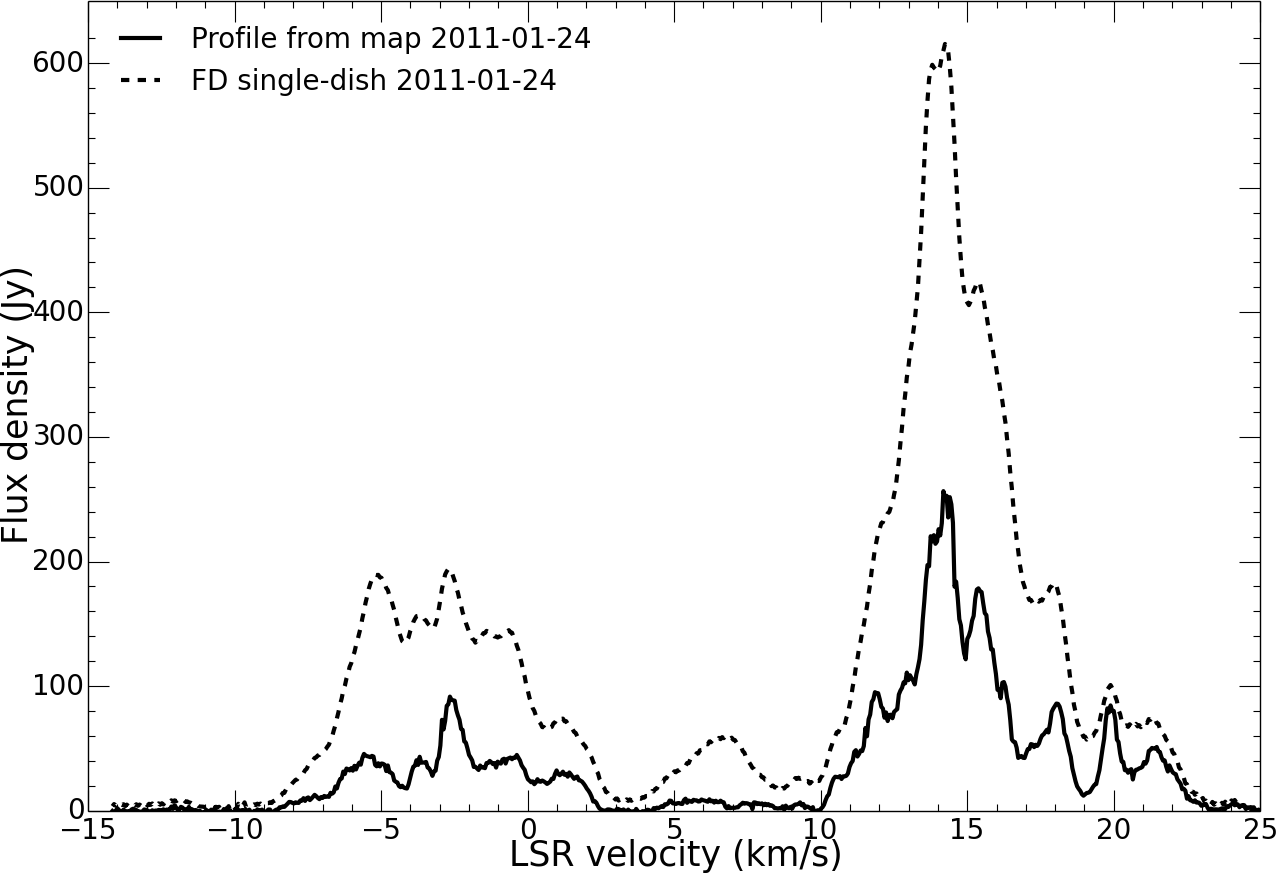
We compared the spectral profiles obtained from the total-power spectrum of the VLBA station Fort Davis and extracted from the line cube of the 3mm , maser emission (Fig. 6). The total flux density recovery with VLBI compared to the total-power spectrum amounts to 33 of the full emission. In fact, data calibration resulted in the loss of two of the eight VLBA antennas observing at 3mm (see Section 2). Additionally, the shortest baseline in the VLBA is roughly 250 km, which likely prevents the recovery of more diffuse emission structures (the 7mm monitoring experiments included a VLA antenna, providing a short baseline to Pie Town of 50 km). This leads to the conclusion that a significant part of the missing flux density must come from extended or diffuse emission that is not sampled by the VLBA.
Despite the difference in flux level, the total-power and the VLBI spectra share similar peak locations and general profiles. Interestingly, there is a significant amount of flux density missing in the VLBI image-extracted spectrum near the systemic velocity, km s-1, possibly corresponding to the bridge regions between the north and east arms and between the south and west arms, where masers near the systemic velocity occur at 7mm (Matthews et al., 2010). In total-power, the intensity of the emission near the systemic velocity ranges from 20 Jy to 60 Jy, which would correspond to fluxes of 6-20 Jy in VLBI, assuming 33 recovery. If the systemic velocity emission consisted of bright compact spots of a few Jansky each, we should still be able to detect them (1 Jy corresponds to roughly 10 in our VLBI maps). Since the spectral peak near the systemic velocity is almost non-existent in the VLBI profile, this suggests that emission near may be composed of more diffuse or extended structures with respect to the blue- and red-shifted arms (larger than 3 mas, corresponding to the resolution on the shortest Pie Town–Los Alamos baseline).
3.4.3 Comparisons of spectral profiles at 3mm and 7mm
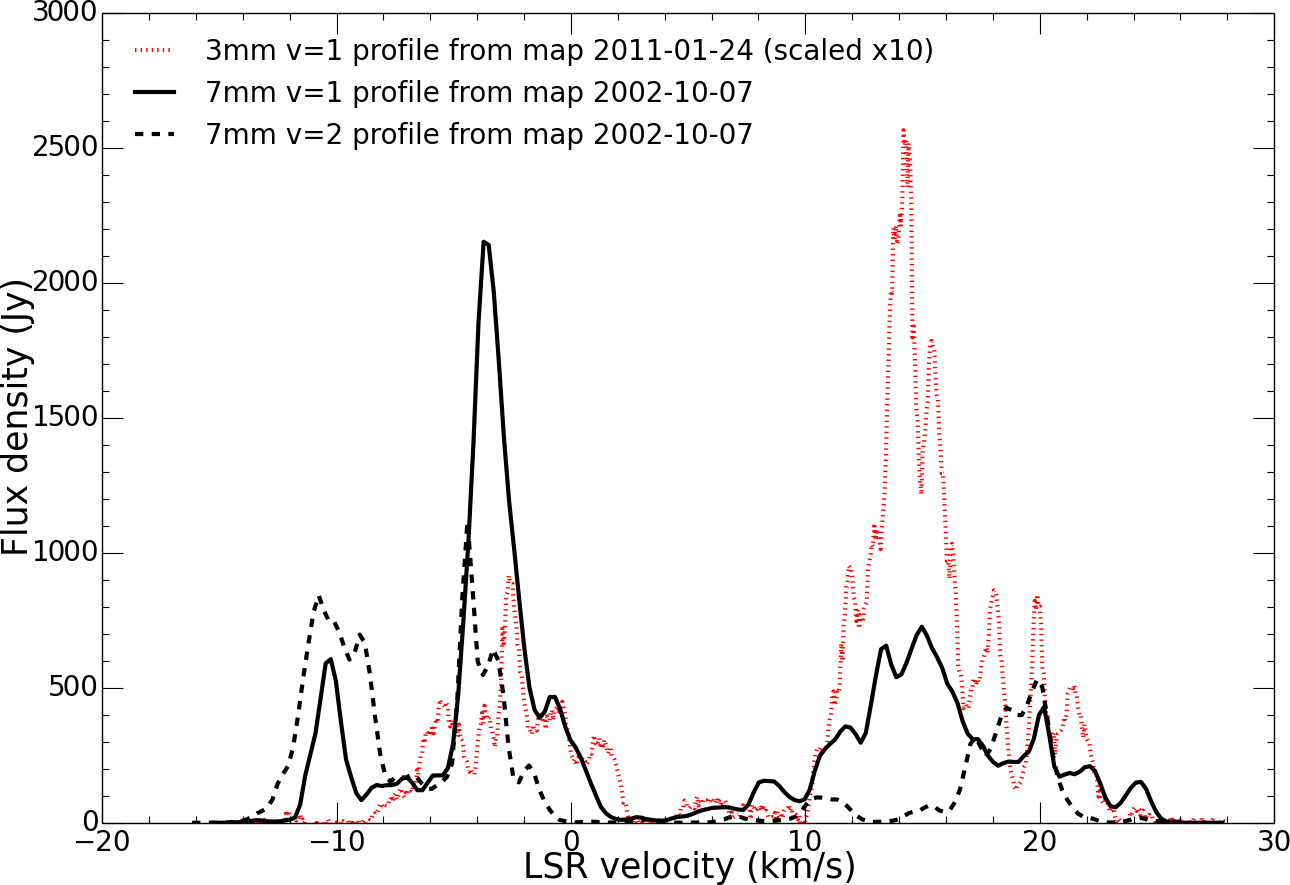
We compared the total VLBI spectral profiles from the line cube for the observations at 3mm to the single-epoch 7mm observations (Fig. 7). The 3mm spectrum is scaled by a factor of ten for a closer comparison to the much stronger emission from the 7mm transitions. The 3mm profile shows the characteristic double-peaked spectrum seen in both transitions at 7mm. However, it is slightly narrower than the spectra at 7mm: the 3mm maser emission does not attain the higher blue-shifted and red-shifted velocities reached by masers at 7mm. The total 3mm velocity range was found to be from 12.3 km s-1 to 25.4 km s-1, which is overall lower than the velocity ranges for the 7mm (14.1 km s-1 to 26.5 km s-1) and (15.3 km s-1 to 25.8 km s-1). Since the 3mm masers are detected on average further from Source I than the 7mm emission, the narrower spectrum is consistent with Keplerian rotation of the gas, as already noticed.
A caveat is in place: the maser emission structure is variable on a timescale of a few weeks (Matthews et al., 2010). We thus expect that variability of the maser emission would cause substantial changes to the spectral profiles over ten years, so a detailed comparison of the spectral profile features at 3mm and 7mm cannot be obtained. Nevertheless, broad features of the spectra can still be compared despite the time-variable aspect of the emission. In particular, previous simultaneous observations at 3mm and 7mm showed differences in the velocity ranges (Snyder & Buhl, 1974; Doeleman et al., 2004, Matthews et al. in prep). Thus source structure variability is unlikely to be the cause of the differences in the observed velocity ranges between the 3mm and the 7mm transitions.
4 Discussion
4.1 The SiO maser kinematics
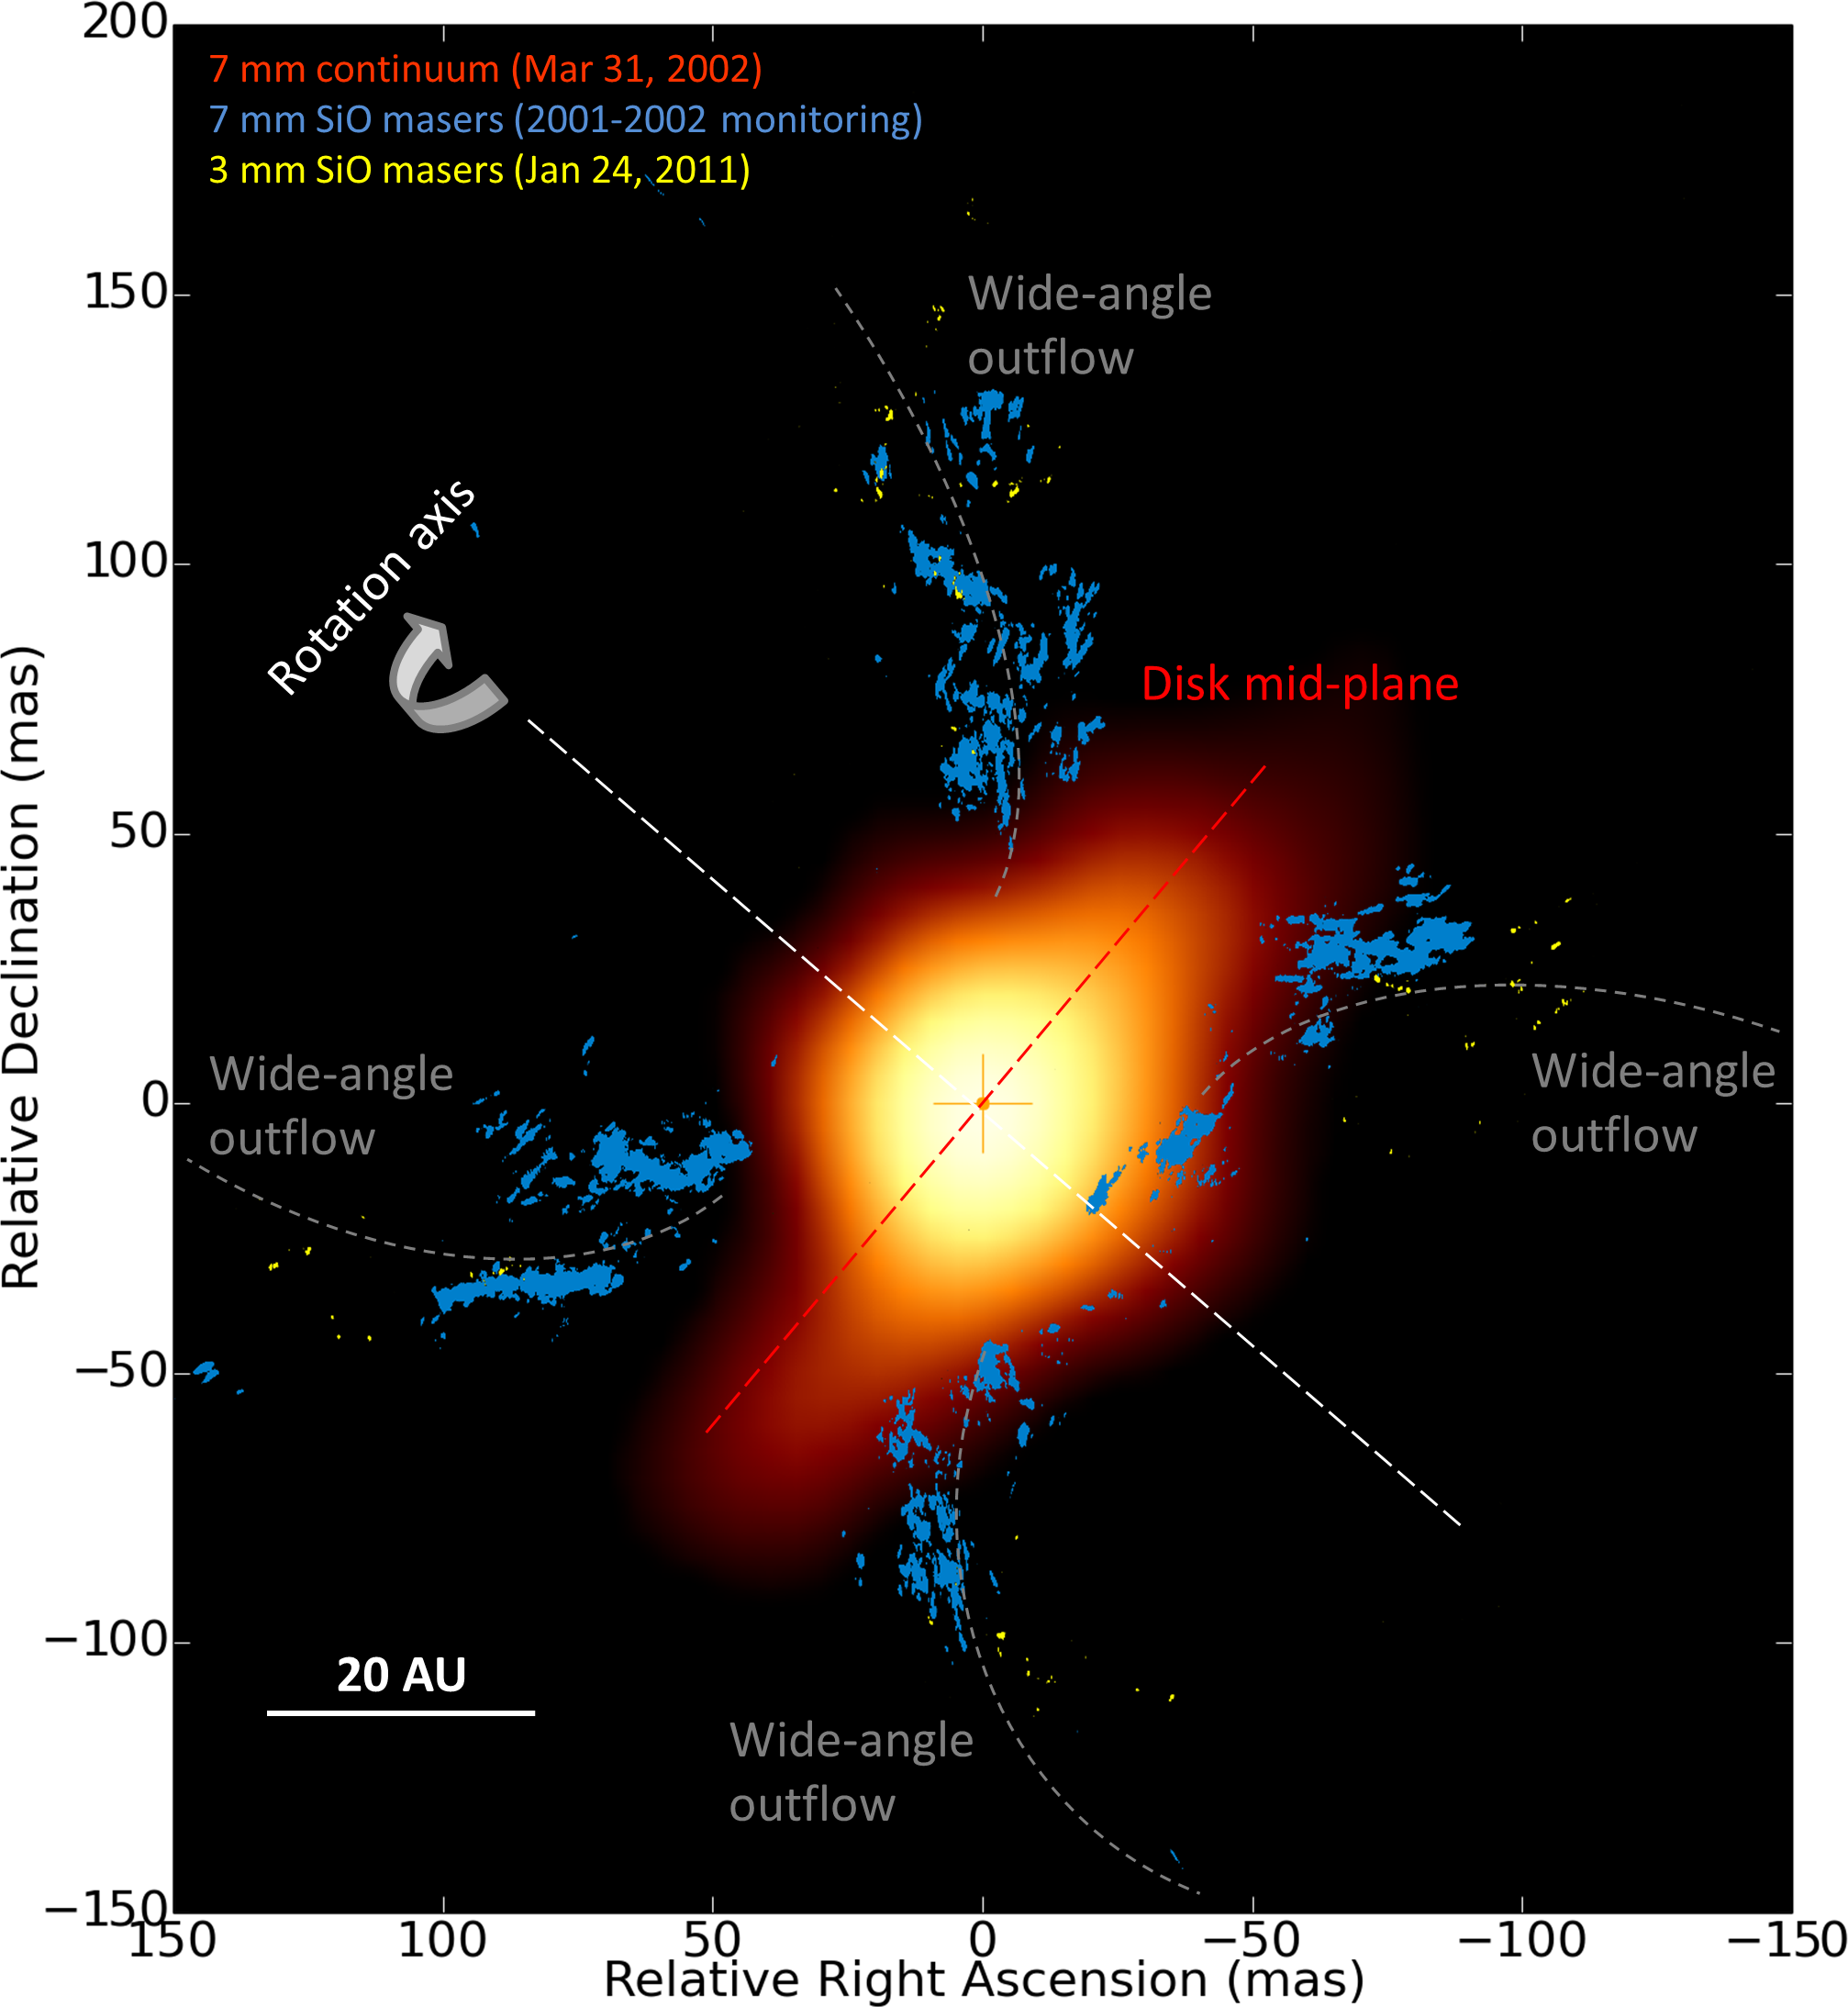
Based on the previous observations of the 28SiO , maser transitions, a disk-wind model has been proposed to explain the gas kinematics around Source I (Greenhill et al., 2004; Kim et al., 2008; Matthews et al., 2010). In this model, illustrated in Fig. 8, the arms of SiO emission outline motions of gas clumps along the limbs of a wide-angle outflow arising from the surface of an edge-on disk rotating about a northeast-southwest axis. Our new observations of the 28SiO , maser transition emission confirm this model. Specifically, this model is supported by the presence of a continuous velocity gradient in the arms traced by both the 3mm and 7mm SiO maser emission, which is indicative of a continuous single wide-angle outflow suggesting differential rotation about a northeast-southwest rotation axis. Additionally, the registrations of the 3mm and 7mm images with respect to the putative location of Source I exhibit a consistency in the shape and bend of the limbs of the outflow, where the 3mm emission appears to fall along the streamlines of the 7mm maser emission.
4.2 Maser pumping
Most available pumping models of SiO masers focus on modeling spherically symmetric evolved AGB stars, due to the more common occurrence of these masers around these objects, and typically include both radiative and collisional pumping mechanisms. The model by Humphreys et al. (2002) was the first to also include effects from hydrodynamic shocks in stellar envelopes, which may play an important role in the context of the wide-angle outflow model for Source I. Simulations of the shock regions from an AGB star showed that the , maser emission occurs at slightly larger radii than the , masers, with a spatial offset of 2. This offset, when applied to the case of Source I, would correspond to a distance shorter than 1 AU, which does not explain the larger offsets observed in our VLBI images (7 AU on average between the 3mm and 7mm transitions).
The spatial offset between the , and 28SiO transitions, although uncommon, has also been observed in evolved stars (e.g. Soria-Ruiz et al., 2004). Soria-Ruiz et al. (2004), and later Desmurs et al. (2014), attempted to explain this phenomenon by including line overlap between H2O and SiO in their modeling, which can bring about the emission further from the star (by about ) than the emission. In the model by Soria-Ruiz et al. (2004), the inclusion of the line overlap with H2O resulted in a promising explanation for the maser distributions around the O-rich late-type star IRC+10011: the , emission lies at radii significantly further away from the star, and the , are spatially coincident close to the star. It is worth noting that this addition to the model did not affect significantly the conditions for the masing of the line, but instead shifted the to lower density requirements, where the , lines are now strongly coupled.
In the case of the model by Desmurs et al. (2014), a similar mechanism takes place, where the , emission is shifted to requiring higher densities and thus appears closer to star. Here as well, the , line is unaffected by the H2O line overlap, and the offset between the two lines in the state is caused by the shifting closer to the star, such that the , are co-spatial at small radii from the star and the , emission lies at larger radii. The inclusion of the line overlap, although creating an offset between the two SiO lines in the vibrational state, fails to explain the observed offset in Source I between the , lines, where the appears closer (by ) to the YSO, at higher temperatures and densities. It also fails to explain the partial spatial overlap for both rotational transitions in the vibrational state observed in Source I.
Another model, by Gray et al. (2009), includes hot dense dust and can also obtain an offset between the , and emission in an evolved star, without the inclusion of the H2O line overlap. In particular, the , emission occurs further away from the star than the , emission (comparable to what is observed for Source I). However, in this particular model, the , transitions are again predicted to be co-spatial and thus sharing the same masing conditions, which is inconsistent with what is observed in Source I.
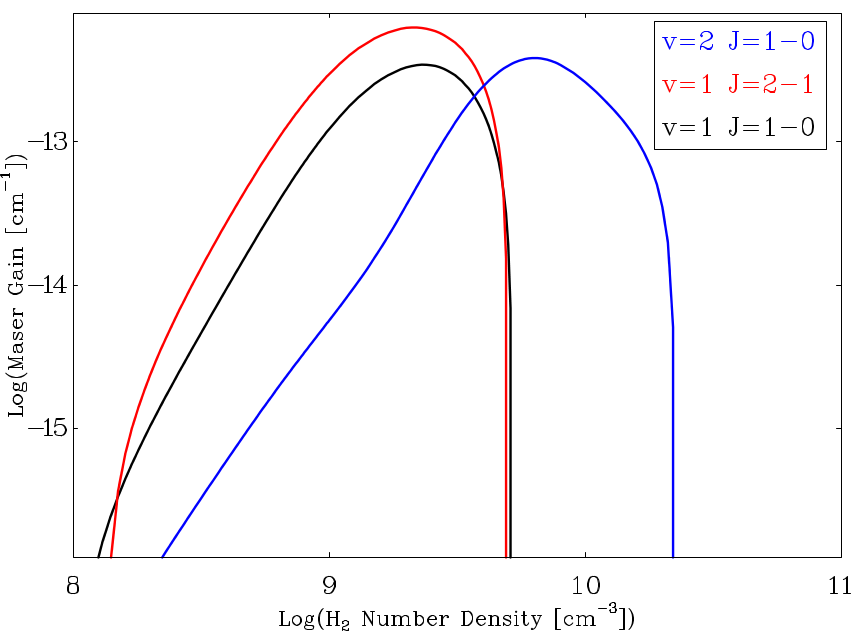
From studies of the physical conditions expected for the stimulation of the , transitions from radiative transfer modeling for a single YSO using a large velocity gradient (LVG) code, it was found that the transition can occur at higher densities and temperatures than the transition, while still maintaining a range of densities and temperatures where both transitions can occur (Goddi et al., 2009, Fig. 9). Matthews et al. (2010) concluded that the model is consistent with observations of the transition arising closer to the YSO, where higher temperatures and densities are expected, but substantial spatial overlap between the and transitions remained, in accordance with model predictions. Similar calculations were done by Cho et al. (2010) for various additional transitions using the same model: most notably, they found that the physical conditions necessary for the 28SiO , transition were not readily differentiable from the conditions for the transition of the same vibrational state, again in contrast with our findings in Source I.
| Model | Type of system | Main feature | , with respect to , | , with respect to , |
|---|---|---|---|---|
| Humphreys et al. (2002) | single evolved star | hydrodynamic shocks | (co-spatial) | further away |
| Soria-Ruiz et al. (2004) | single evolved star | overlaps with H2O absorption lines | (co-spatial) | further away |
| Gray et al. (2009) | single evolved star | hot dense dust | (co-spatial) | further away |
| Goddi et al. (2009) | single YSO | radiative transfer (LVG) | slightly closer in | (co-spatial) |
| Gray et al. (in prep) | binary YSO | full hydrodynamic solution for binary | closer in | further away |
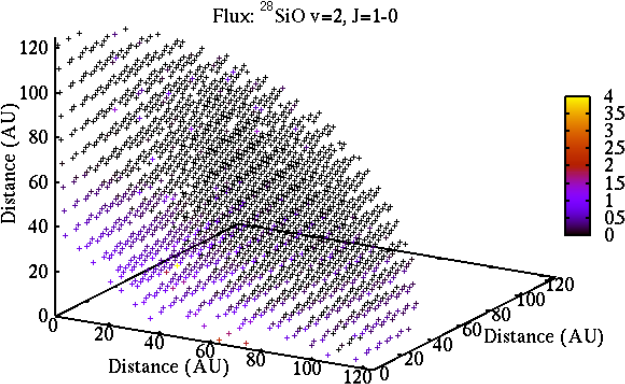
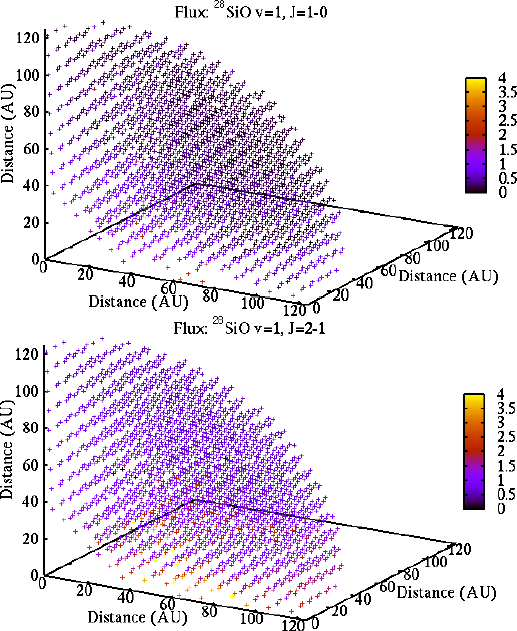
A new model by Gray et al. (in prep) investigates the pumping conditions of SiO masers arising in the disk-midplane of a close massive proto-binary surrounded by a circumbinary disk, using a full hydrodynamic solution by Krumholz et al. (2007). The model uses an accelerated lambda iteration (ALI) radiative transfer model and includes all SiO isotopologues (28SiO, 29SiO, 30SiO) with full line overlap. The masers are represented by point-like “bullet” clouds (as shown in Fig. 10), with positions and physical conditions specified by the grid-nodes within the hydrodynamic model (as in Fig. 1 of Krumholz et al., 2009). A more detailed description will be given in Gray et al. (in prep). This model is potentially more suitable for the case of Source I, which is believed to be a massive proto-binary (Goddi et al., 2011). The resulting physical conditions for the maser transitions differ from those of an evolved single star: the , transition occurs at slightly lower densities: at a mean density of cm-3 and at cm-3 and cm-3 respectively.
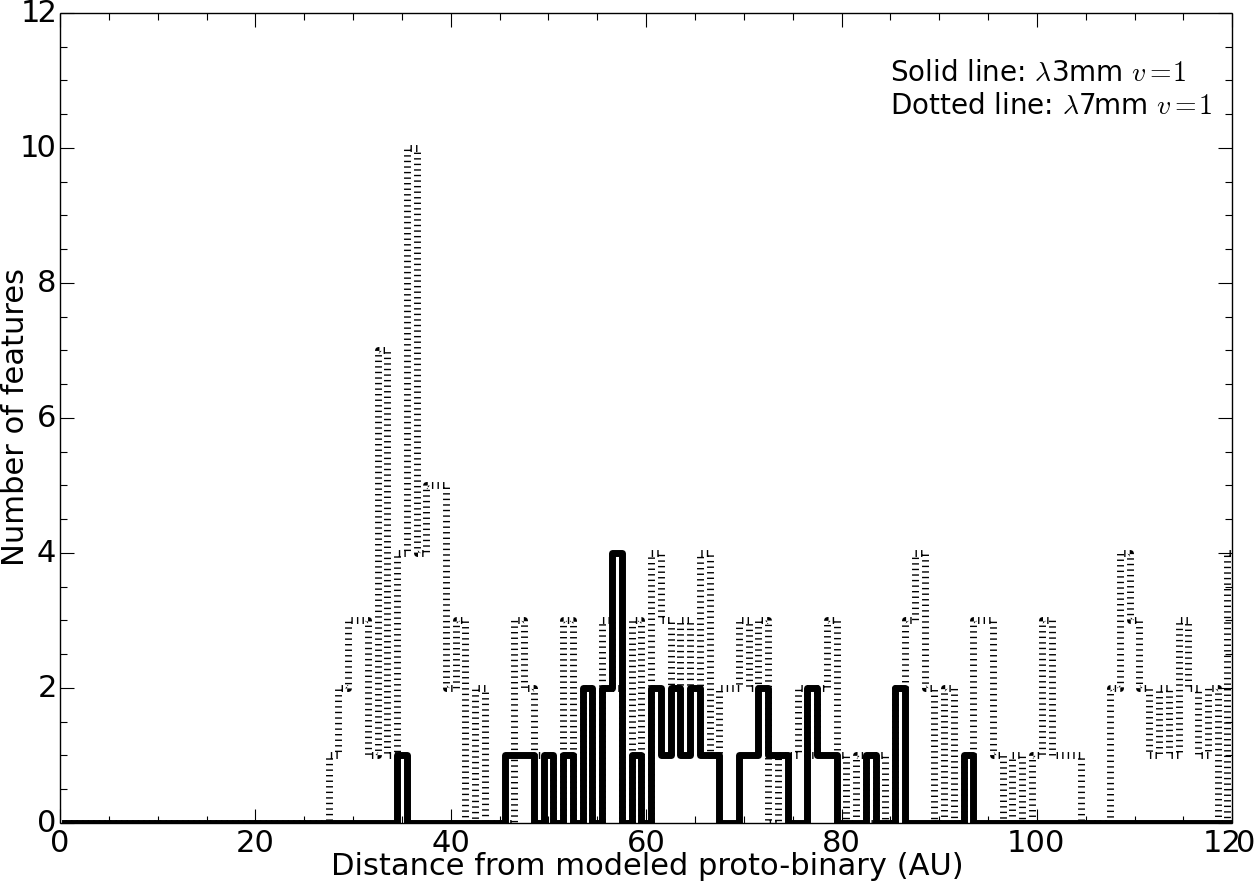
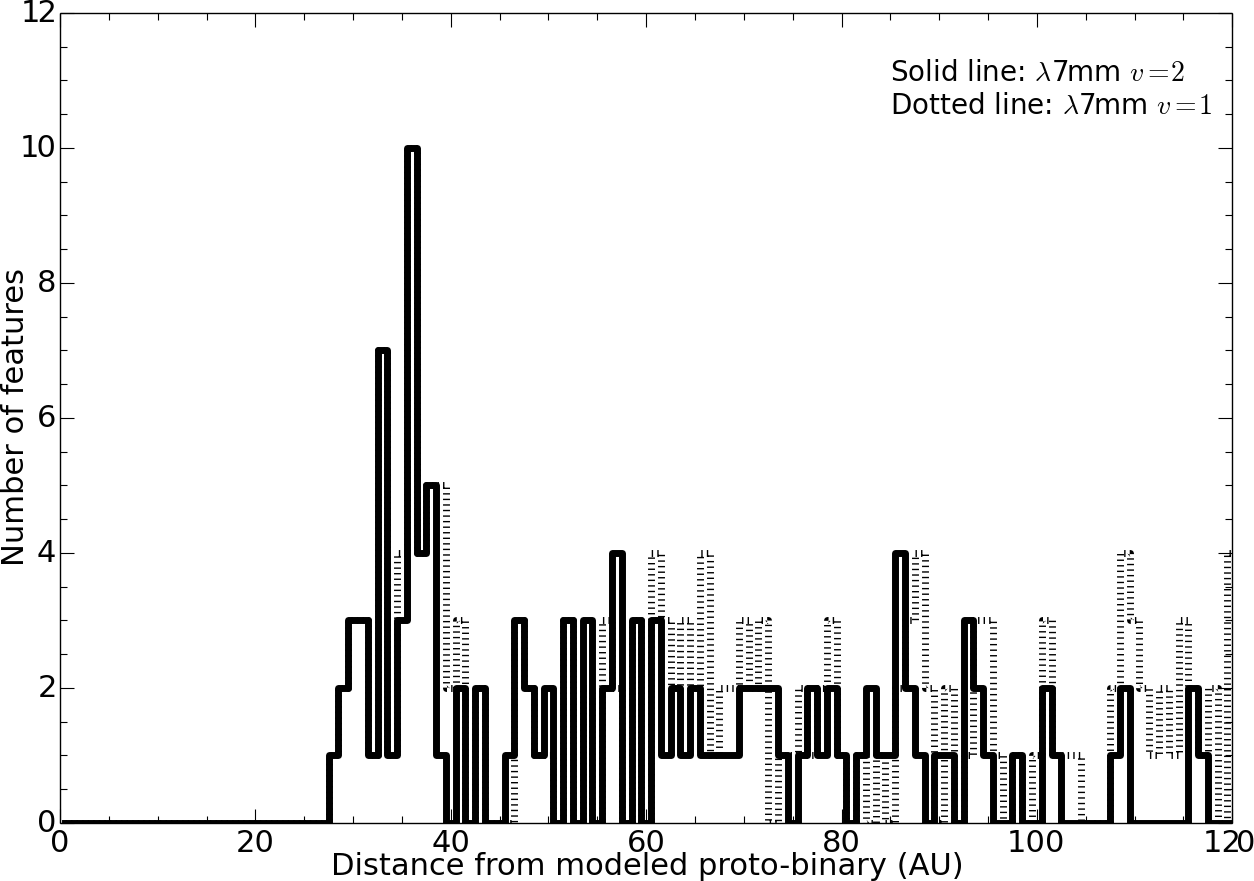
We constructed histograms of the maser spot distributions as a function of distance from the proto-binary as predicted by the new pumping model in order to compare to the observed spatial distributions for the three maser transitions. Since the model gives a spherically symmetric distribution of maser spots, the number of spots increases with radius (Fig. 10). Therefore, in constructing the histograms, we only selected the maser spots of reasonable brightness, within a conservative range of 500–1000 times the brightness of the weakest spots in the distributions. The resulting histograms comparing the , and and the , distributions are presented in Fig. 11 and Fig. 12, respectively.
The mean radii (computed from the histograms) for the , and , are 69 AU, 61 AU and 65 AU respectively. This would imply that the , transition lies at closer () projected distances from the binary than the , transition (Fig. 11), in contrast with our findings in Source I. However, this offset is computed over the full extent of the hydrodynamic solution (up to 120 AU), while we know that no vibrationally-excited maser emission is observed beyond 80 AU in Source I, where it is effectively quenched by the 28SiO emission (Greenhill et al., 2013). In fact, when we apply this observational constraint to the modeled maser distributions, i.e. truncating all maser spots appearing beyond 80 AU, the mean radii for the , and the , are reduced to 52 AU, 50 AU and 62 AU respectively444The truncation of maser spots primarily affects the , distributions, which have tails of features at radii 80–120 AU from the central object (see Figs. 11 and 12). As a result of this truncation, the 3mm masers arise further away, on average, from the central object than the 7mm masers, reproducing the observed offset in our VLBI images. In addition, the 7mm masers have a offset, which is smaller than (but in the same direction of) that observed in Source I ().
In summary, this new pumping model is the only one (to date) able to reproduce the observed 3mm and 7mm offset as well as (to a lesser extent) the 7mm offset (Table 3). Some caveats are however in order. First, the model by Krumholz et al. (2007) describes a binary composed of an 8.3 M⊙ primary and a much smaller secondary, whereas Source I is believed to be an equal-mass binary of a total mass of 20 M⊙ (Goddi et al., 2011). The ratio between the primary and secondary masses is likely to affect the system as a whole and thus modify the pumping conditions of SiO masers arising from the circumbinary disk. Second, the model does not specify an SiO abundance and does not include a dust model, shown by Gray et al. (2009) to affect the masing conditions, or effects from line overlap with the H2O absorption lines (Soria-Ruiz et al., 2004; Desmurs et al., 2014), which could potentially explain our findings in Source I. Third, this model is first and foremost a pumping code for evolved stars adapted for star formation, and thus is not expected to accurately explain observations in a high-mass star formation environment, where strong UV radiation affects the surrounding medium.
5 Summary and Conclusions
We have presented the first images of the 28SiO , maser emission around Source I observed with the VLBA. We found that the 3mm masers lie in an X-shaped locus consisting of four arms, with blue-shifted emission in the south and east arms and red-shifted emission in the north and west arms. Comparisons with previous images of the , transitions, observed by Matthews et al. (2010) in 2001–2002, showed that the bulk of the transition emission follows the streamlines of the emission and exhibits an overall velocity gradient consistent with the gradient at 7mm. We interpret the 3mm and 7mm masers as being part of a single wide-angle outflow arising from the surface of an edge-on disk rotating about a northeast-southwest rotation axis, with a continuous velocity gradient indicative of differential rotation of the gas, consistent with a Keplerian profile.
We find that the , and transitions share spatial overlap, suggestive of a common range of temperatures and densities where physical conditions are favorable for both rotational transitions of a same vibrational state. Despite this overlap, we also find that the bulk of emission at 3mm arises significantly further away from the YSO than the 7mm emission (average offset 9 AU). The observed spatial offset indicates different ranges of temperatures and densities for optimal excitation of the different rotational maser transitions.
We have discussed several existing pumping models for SiO masers, which however fail in reproducing the observed offsets. This is not a surprising result, as most available pumping models of SiO masers are built for spherically symmetric evolved AGB stars (where SiO masers commonly occur), and are not expected to faithfully describe a high-mass star formation environment. We present here a promising new model by Gray et al. (in prep) using a full hydrodynamic solution of a close massive proto-binary (Krumholz et al., 2007), to assess the pumping conditions of SiO masers in the circumbinary disk-midplane. Given the binary YSO nature of Source I (Goddi et al., 2011), this model is potentially more suitable than AGB models. In fact, we were able to reproduce the offset between the 3mm and 7mm masers observed in Source I () and an additional offset () for the 7mm masers, although smaller than found in Source I.
Future models may need to include additional physical mechanisms known to be at work in high-mass star-forming environments such as the effects of a disk-wind, uv-radiation, and/or magnetic fields, in order to reproduce and explain the spatial offsets for all three maser transitions simultaneously. In addition, owing to variability of the SiO maser emission, simultaneous VLBI observations of the 3mm and 7mm transitions will be required for a more detailed comparative study of the maser structures and kinematics between these transitions.
Acknowledgements.
The data presented here were part of the NRAO program BG205.References
- Beltrán & de Wit (2016) Beltrán, M. T. & de Wit, W. J. 2016, A&A Rev., 24, 6
- Beuther et al. (2007) Beuther, H., Churchwell, E. B., McKee, C. F., & Tan, J. C. 2007, Protostars and Planets V, 165
- Cho et al. (2010) Cho, S.-H., Kim, H.-G., Chung, H.-S., et al. 2010, AJ, 139, 302
- Cho et al. (2016) Cho, S.-H., Yun, Y., Kim, J., et al. 2016, ApJ, 826, 157
- Cragg et al. (2005) Cragg, D. M., Sobolev, A. M., & Godfrey, P. D. 2005, MNRAS, 360, 533
- Desmurs et al. (2014) Desmurs, J.-F., Bujarrabal, V., Lindqvist, M., et al. 2014, A&A, 565, A127
- Doeleman et al. (2004) Doeleman, S. S., Lonsdale, C. J., Kondratko, P. T., & Predmore, C. R. 2004, ApJ, 607, 361
- Doeleman et al. (1999) Doeleman, S. S., Lonsdale, C. J., & Pelkey, S. 1999, ApJ, 510, L55
- Eisner et al. (2002) Eisner, J. A., Greenhill, L. J., Herrnstein, J. R., Moran, J. M., & Menten, K. M. 2002, ApJ, 569, 334
- Elitzur (1992) Elitzur, M., ed. 1992, Astrophysics and Space Science Library, Vol. 170, Astronomical masers
- Ginsburg et al. (2015) Ginsburg, A., Walsh, A., Henkel, C., et al. 2015, A&A, 584, L7
- Goddi et al. (2009) Goddi, C., Greenhill, L. J., Chandler, C. J., et al. 2009, ApJ, 698, 1165
- Goddi et al. (2011) Goddi, C., Humphreys, E. M. L., Greenhill, L. J., Chandler, C. J., & Matthews, L. D. 2011, ApJ, 728, 15
- Goddi & Moscadelli (2006) Goddi, C. & Moscadelli, L. 2006, A&A, 447, 577
- Goddi et al. (2005) Goddi, C., Moscadelli, L., Alef, W., et al. 2005, A&A, 432, 161
- Gray et al. (2009) Gray, M. D., Wittkowski, M., Scholz, M., et al. 2009, MNRAS, 394, 51
- Greenhill et al. (2013) Greenhill, L. J., Goddi, C., Chandler, C. J., Matthews, L. D., & Humphreys, E. M. L. 2013, ApJ, 770, L32
- Greenhill et al. (1998) Greenhill, L. J., Gwinn, C. R., Schwartz, C., Moran, J. M., & Diamond, P. J. 1998, Nature, 396, 650
- Greenhill et al. (2004) Greenhill, L. J., Reid, M. J., Chandler, C. J., Diamond, P. J., & Elitzur, M. 2004, in IAU Symposium, Vol. 221, Star Formation at High Angular Resolution, ed. M. G. Burton, R. Jayawardhana, & T. L. Bourke, 155
- Hasegawa et al. (1986) Hasegawa, T., Morita, K., Okumura, S., et al. 1986, in Masers, Molecules, and Mass Outflows in Star Formation Regions, ed. A. D. Haschick, 275
- Higuchi et al. (2015) Higuchi, A. E., Hasegawa, T., Saigo, K., Sanhueza, P., & Chibueze, J. O. 2015, ApJ, 815, 106
- Hollenbach et al. (2013) Hollenbach, D., Elitzur, M., & McKee, C. F. 2013, ApJ, 773, 70
- Humphreys et al. (2002) Humphreys, E. M. L., Gray, M. D., Yates, J. A., et al. 2002, A&A, 386, 256
- Kim et al. (2008) Kim, M. K., Hirota, T., Honma, M., et al. 2008, PASJ, 60, 991
- Krumholz et al. (2007) Krumholz, M. R., Klein, R. I., & McKee, C. F. 2007, ApJ, 656, 959
- Krumholz et al. (2009) Krumholz, M. R., Klein, R. I., McKee, C. F., Offner, S. S. R., & Cunningham, A. J. 2009, Science, 323, 754
- Matthews et al. (2010) Matthews, L. D., Greenhill, L. J., Goddi, C., et al. 2010, ApJ, 708, 80
- Menten & Reid (1995) Menten, K. M. & Reid, M. J. 1995, ApJ, 445, L157
- Menten et al. (2007) Menten, K. M., Reid, M. J., Forbrich, J., & Brunthaler, A. 2007, A&A, 474, 515
- Moscadelli et al. (2016) Moscadelli, L., Sánchez-Monge, Á., Goddi, C., et al. 2016, A&A, 585, A71
- Plambeck & Wright (2016) Plambeck, R. L. & Wright, M. C. H. 2016, ApJ, 833, 219
- Reid et al. (2007) Reid, M. J., Menten, K. M., Greenhill, L. J., & Chandler, C. J. 2007, ApJ, 664, 950
- Sanna et al. (2010) Sanna, A., Moscadelli, L., Cesaroni, R., et al. 2010, A&A, 517, A71
- Snyder & Buhl (1974) Snyder, L. E. & Buhl, D. 1974, ApJ, 189, L31
- Soria-Ruiz et al. (2004) Soria-Ruiz, R., Alcolea, J., Colomer, F., et al. 2004, A&A, 426, 131
- Torrelles et al. (2001) Torrelles, J. M., Patel, N. A., Gómez, J. F., et al. 2001, ApJ, 560, 853
- Zapata et al. (2009) Zapata, L. A., Menten, K., Reid, M., & Beuther, H. 2009, ApJ, 691, 332
- Zinnecker & Yorke (2007) Zinnecker, H. & Yorke, H. W. 2007, ARA&A, 45, 481