Molecular near-infrared transitions determined with sub-kHz accuracy
Abstract
Precise molecular transition frequencies are needed in various studies including the test of fundamental physics. Two well isolated ro-vibrational transitions of 12C16O at 1.57 m, R(9) and R(10) in the second overtone band, were measured by a comb-locked cavity ring-down spectrometer. Despite the weakness of the lines (Einstein coefficient s-1), Lamb-dip spectra were recorded with a signal-to-noise ratio over 1000, and the line positions were determined to be 191 360 212 761.1 and 191 440 612 662.2 kHz respectively, with an uncertainty of 0.5 kHz (). The present work demonstrates the possibility to explore extensive molecular lines in the near-infrared with sub-kHz accuracy.
Rotation-resolved molecular transitions are convenient natural frequency grids used in spectroscopy, communication Hong et al. (2003), metrology Foreman et al. (2005) and astrophysics Smith et al. (2009). Their precise positions are also concerned in fundamental physics, being used to determine physical constants, either the values Biesheuvel et al. (2016) or the space-time variation Hudson et al. (2006); Shelkovnikov et al. (2008); Ubachs et al. (2016), to find parity-violation effects Daussy et al. (1999), and even to search new physics beyond the Standard Model Salumbides et al. (2013). Accuracy is crucial in these measurements. For example, a fractional uncertainty of to is needed Quack et al. (2008); Tokunaga et al. (2013) to detect parity-violation effects in chiral molecules.
Absorption spectroscopy is the most frequently employed method to derive molecular line parameters used in miscellaneous applications, but often lacks precision and sensitivity. By putting sample gases in an optical resonant cavity of high finesse, the sensitivity can be enhanced by orders of magnitude to detect extremely weak transitions Kassi and Campargue (2012); Tan et al. (2014). Meanwhile, the resonance effect also considerably enhances the intra-cavity light intensity, which allows saturation spectroscopy measurements using low-power continuous-wave lasers Giusfredi et al. (2010); Gatti et al. (2016); Wang et al. (2017). In recent years, considerable efforts Gatti et al. (2016); Wang et al. (2017); Truong et al. (2013a); Santamaria et al. (2016); Spaun et al. (2016); Burkart et al. (2015) have been carried out to pursue both high sensitivity and high precision by combining resonant cavities and frequency combs. The method has been applied to determine absolute infra-red line positions from Lamb-dip measurements of several molecules Gambetta et al. (2010); Hong et al. (2003); Balling et al. (2005); Edwards et al. (2005); Wang et al. (2017); Madej et al. (2006); Twagirayezu et al. (2015); Gatti et al. (2016); Czajkowski et al. (2009); Burkart et al. (2015); Giusfredi et al. (2010); Amy-Klein et al. (2004); Okubo et al. (2011); Ting et al. (2014). Most of the reported molecular line positions have an uncertainty at the kHz level (fractional accuracy ), including the C2H2 line positions near 1.54 m recommended by Bureau International des Poids et Mesures for practical realization of the metre and secondary representations of the second.
Here we present a method that enables Lamb-dip absorption spectroscopy of weak molecular transitions with a frequency accuracy of sub-kHz and a sensitivity of cm-1 as well. The positions of two ro-vibrational transitions of 12C16O at 1.57 m, with Einstein coefficients of about 8 mHz, were determined with an accuracy of 0.5 kHz (). To the best of our knowledge, it is the first time that near infrared (NIR) transitions of molecules have been determined with sub-kHz accuracy. The CO molecule was chosen here because it is one of the most extensively studied and prototype diatomic molecule. As the second most abundant neutral molecule in the universe only after the molecular hydrogen, CO plays a key role in the gas-phase chemistry in the interstellar medium. The spectroscopic parameters of CO are also of great needs in astrophysical studies Gang et al. (2015). These two well-isolated transitions, R(9) and R(10) lines in the 3-0 band, were also selected Cheng et al. (2015) for the optical determination of the Boltzmann constant Daussy et al. (2007); Sun et al. (2011), where both precision and sensitivity are critical. The method can be applied in various studies, for example, to improve the frequency standards in the near-infrared, and to determine the proton-electron mass ratio from the ro-vibrational spectroscopy of the HD molecule.
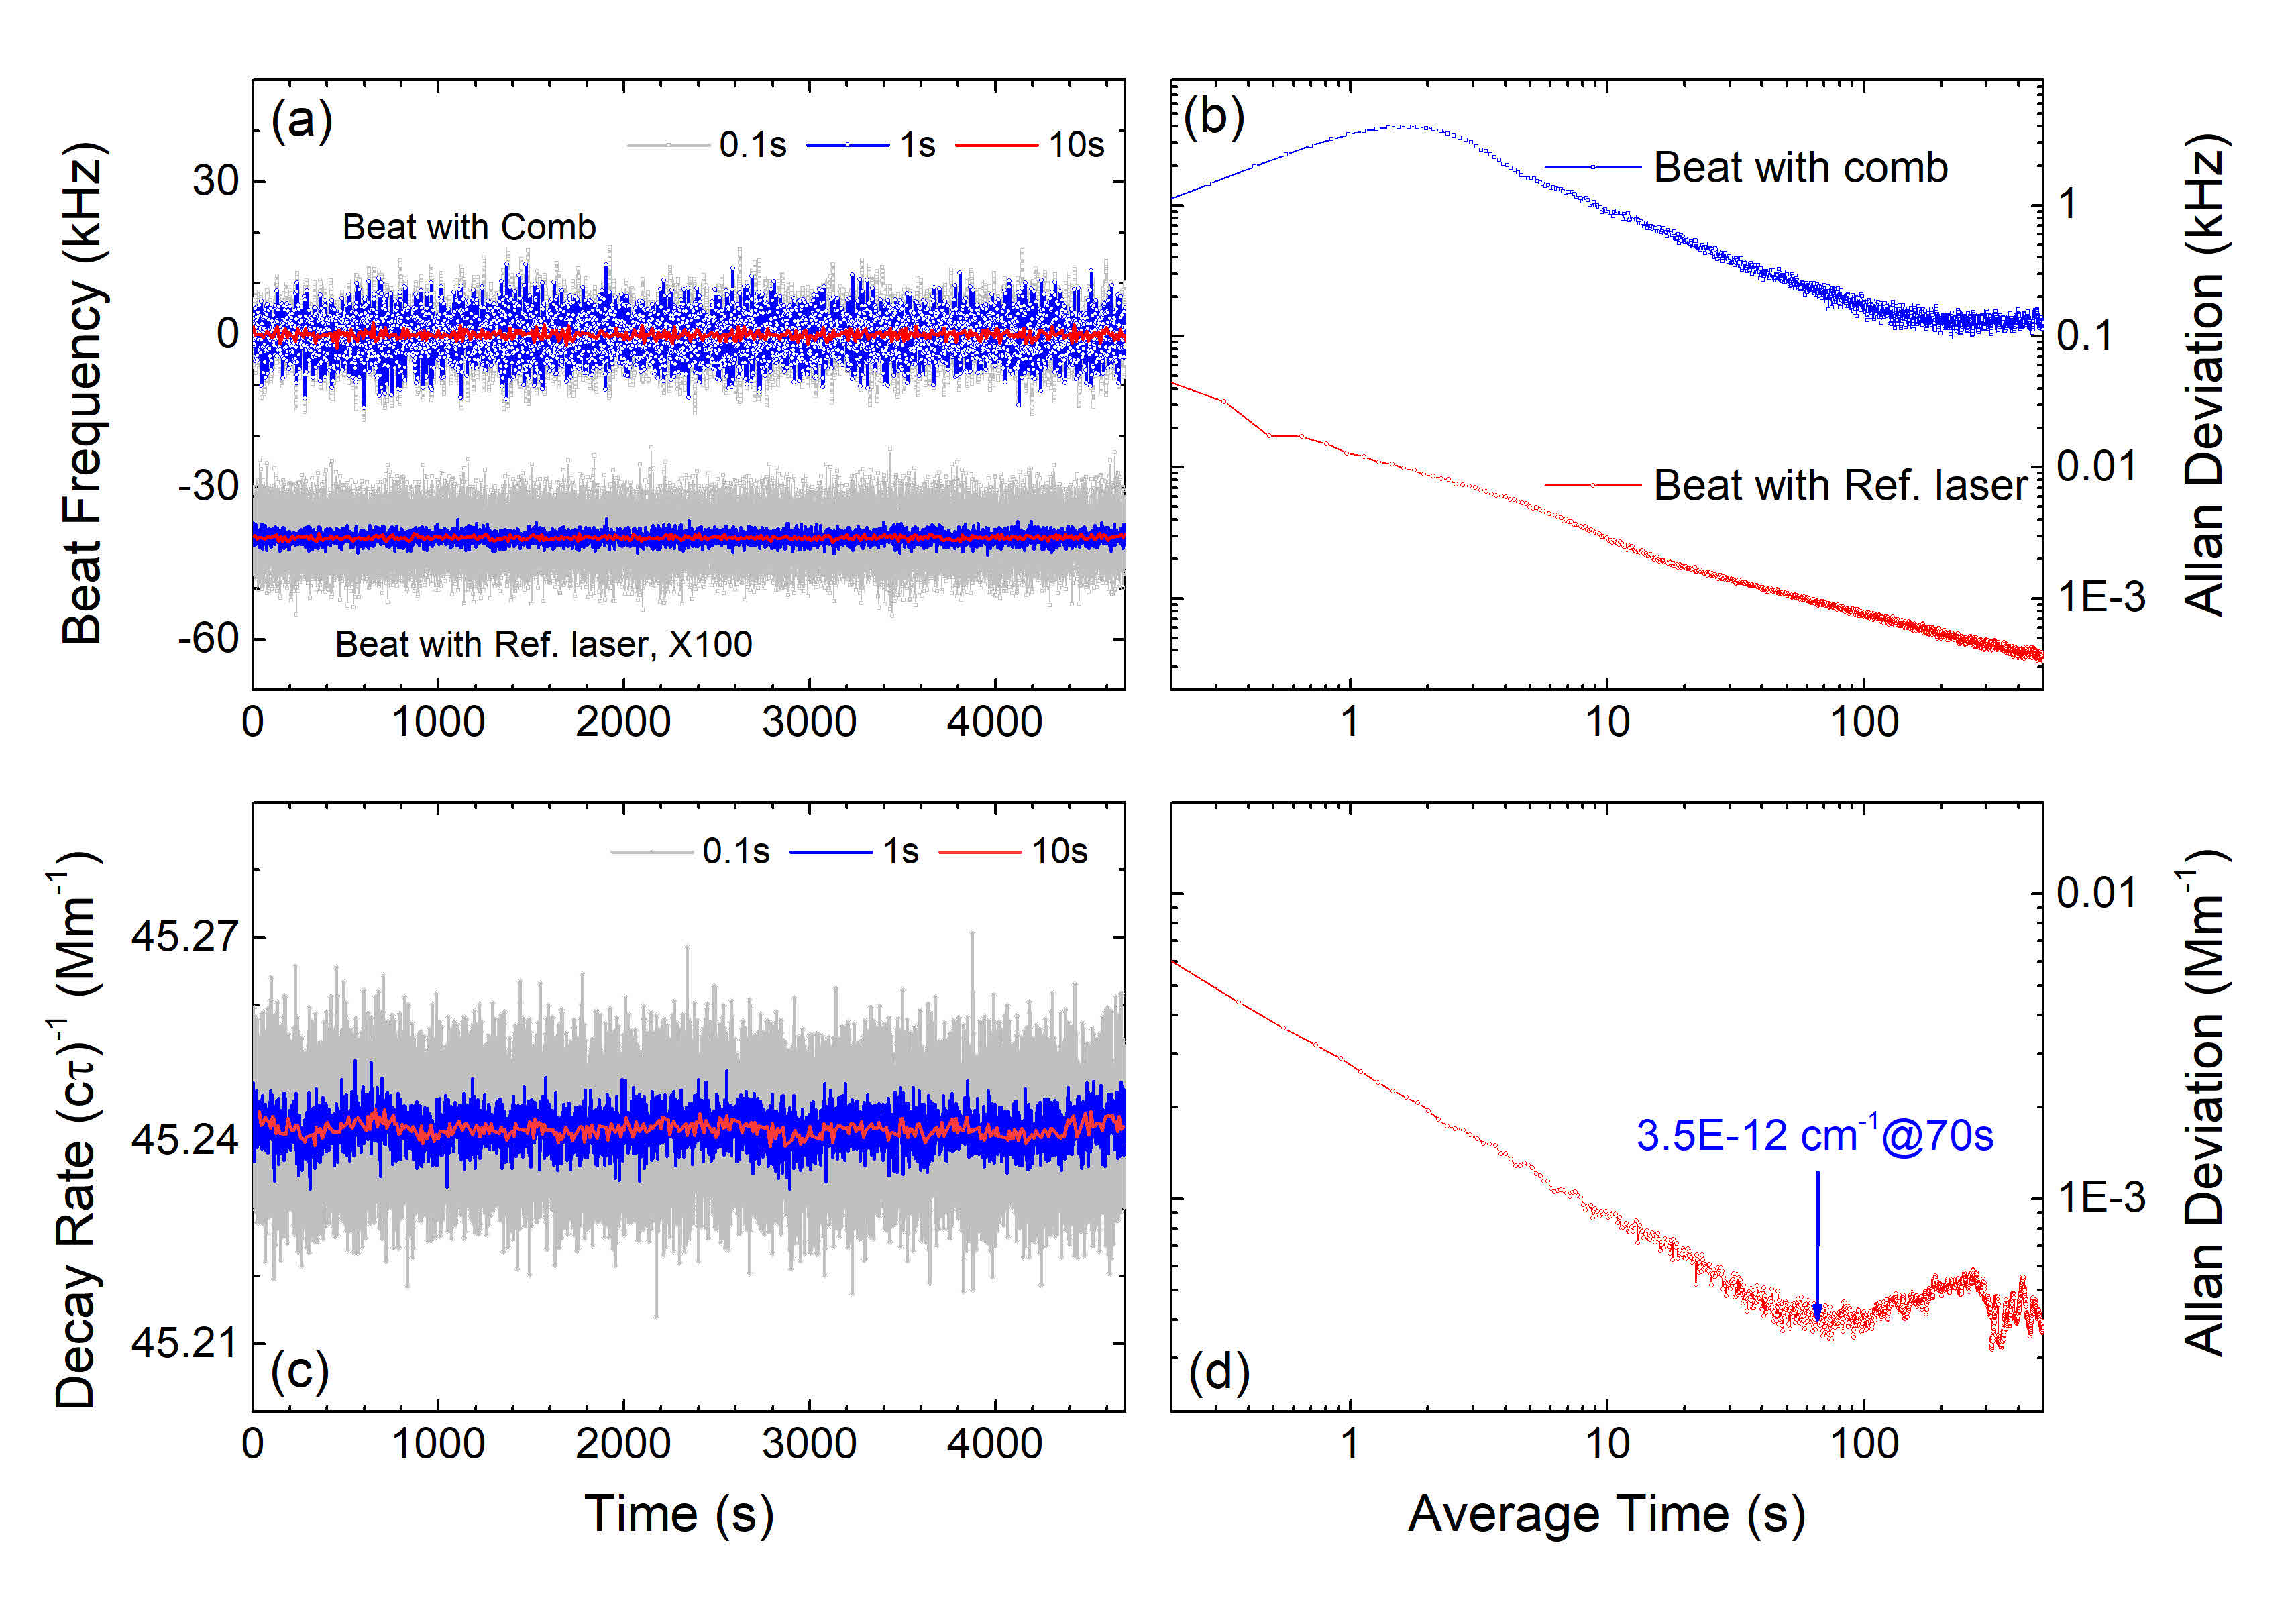
The configuration of the experimental setup is presented in Fig. 1. The probe laser (Koheras NKT E15) is locked to a ring-down (RD) cavity using the Pound-Drever-Hall (PDH) method. The RD cavity has a finesse of and a free-spectral-range (FSR) of 336 MHz. The 50 cm-long RD cavity is installed in a stainless-steel vacuum chamber and its temperature is stabilized at 0∘C with a fluctuation below 1 mK, detected by two calibrated thermal sensors attached on two sides of the cavity. Owing to the thermo-stability of the cavity, the day-to-day drift of the FSR value is below 10 Hz, much less than the linewidth of the cavity mode (2.2 kHz). The cavity length is stabilized through a piezo actuator (PZT) driven by a phase-lock circuit based on the beat signal between the probe laser and a reference laser. The reference laser is locked to a Fabry-Pérot interferometer made of ultra-low-expansion glass, Gao et al. (2010) and its absolute frequency is calibrated by a frequency comb which is synthesized by a Er:fiber oscillator operated at 1.56 m. The repetition frequency ( MHz) and carrier offset frequency () of the comb are locked to precise radio-frequency sources, both referenced to a GPS-disciplined rubidium clock (SRS FS725). The beat signals among the probe laser, the reference laser, and the comb were recorded by a frequency counter (Agilent 53181A), and they are illustrated in Fig. 2. We can see that the probe laser frequency follows well with the reference laser. The fast fluctuation of the beat signal between the probe laser and the comb comes mainly from the line width of the comb tooth, while the long-term drift is due to the slow drift (2 kHz/hr) of the reference laser.
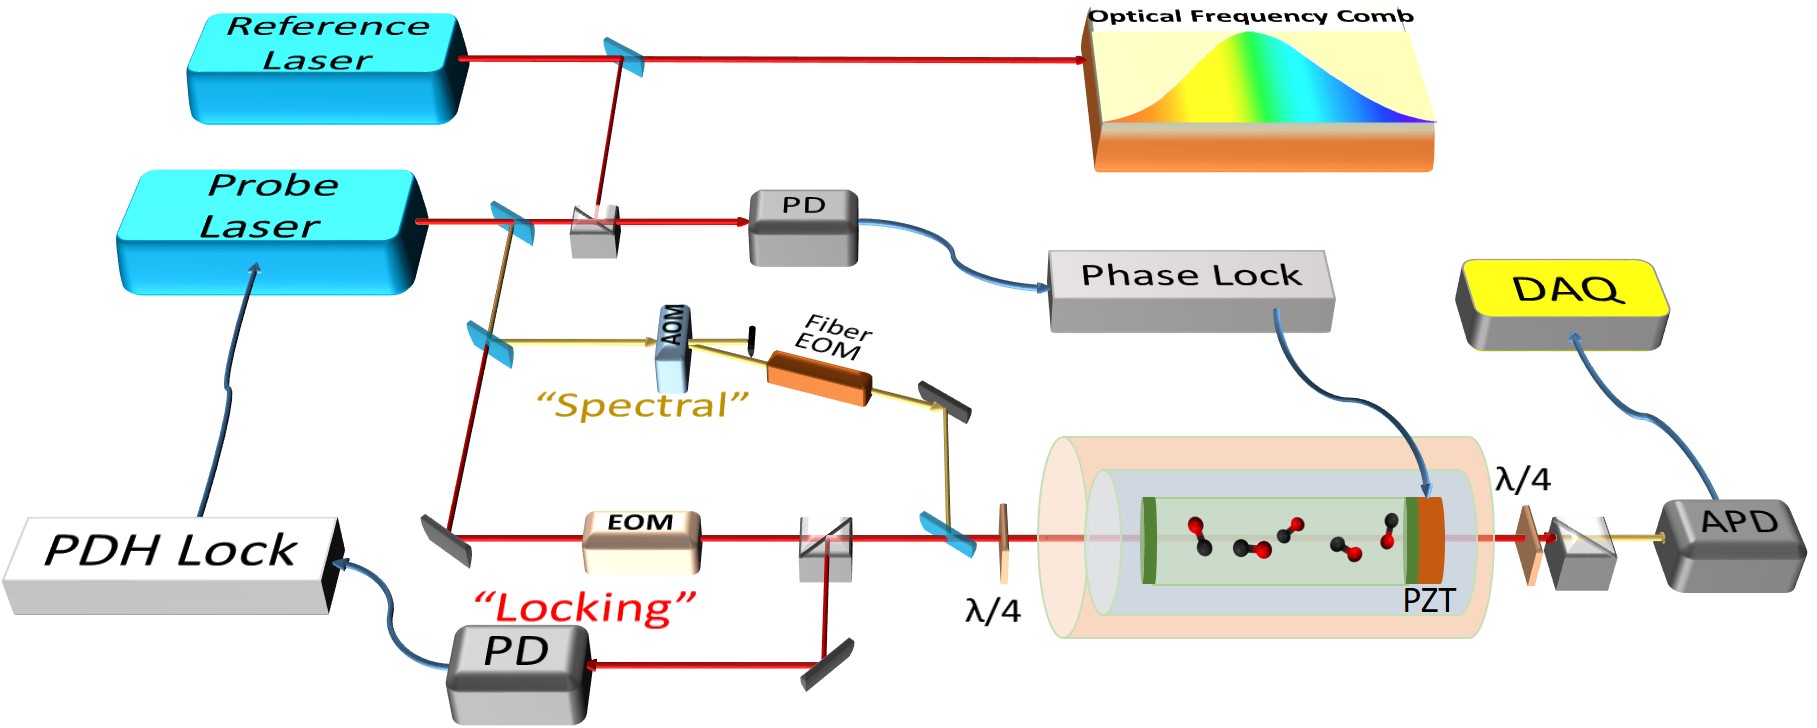
A separated beam from the probe laser, which passes an acousto-optic modulator (AOM) and a fiber electro-optic modulator (EOM), is used to produce the ring-down signal. The input laser power to the fiber EOM is about 3 mW, and about 1/3 of the power is delivered to one of the 1st-order sidebands. The laser light transmitted from the cavity is detected by an avalanche photodiode detector (APD). The transmittance of an empty cavity is about 3 %, leading to Ma et al. (1999); Wang et al. (2017) an intra-cavity laser power of about 8 W. A combination of polarizing waveplates and Glan-Tylor prisms was used to separate the two beams for frequency locking and spectral probing. In addition, because of the significant frequency difference, the beat signal between the two beams is out of the bandwidth of the detectors. Finally, the interference between the frequency locking and RD detection signals has been reduced to a negligible level. The frequency used to drive AOM is fixed at 80.0009 MHz and the frequency used to drive EOM is tuned to fulfill the equation: , where is the frequency of the cavity mode which the probe laser is locked with, is the frequency of a nearby cavity mode with value of about 3. In this case, only one 1st-order sideband in the beam is on resonance and passes the cavity, while the carrier and other sidebands are completely reflected. In this way, the frequency of the laser beam for CRDS detecting is set to be: .
The acousto-optic modulator is also used to periodically chop the spectral beam to initiate ring-down events. The ring-down curve is fit by an exponential decay function to derive the decay time , and the sample absorption coefficient is determined according to the equation: , where is the speed of light, and is the decay time of an empty cavity. Fig. 2(c) shows the recorded values of the empty cavity, and the corresponding Allan deviation is given in Fig. 2(d). The limit of detection, presented as the minimum detectable absorption coefficient, reaches about cm-1 at an averaging time of about 70 seconds, being comparable to those best records obtained by cavity enhanced absorption spectroscopy Truong et al. (2013b); Foltynowicz et al. (2011); Burkart et al. (2014). Compared to our previous method Wang et al. (2017), the frequency lock is kept when we chop the spectral beam for ring-down measurements, resulting with an improved frequency lock. Precise temperature control of the cavity is also essential to maintain a satisfactory frequency stability during the scan. Moreover, the present method allows us to synchronize ring-down events to an external trigger source. It is very useful when the sample molecule is short-lived species, such as transient species produced in photolysis. When a stable gas samples is used, an advantage is to maximize the repetition rate of the RD events, which is only limited by the decay and build-up time of each ring-down curve. In this study, the repetition rate is about 1.5 kHz, over one order of magnitude higher than that obtained in our previous study, leading to a considerably improved sensitivity.
Natural carbon monoxide sample gas was used in the measurement. As given in the HITRAN database Rothman et al. (2013), R(9) and R(10) lines in the overtone band of 12C16O are located at 6383.09 cm-1 and 6385.77 cm-1, with intensities of cm/molecule and cm/molecule, respectively. The saturation power is estimated to be about 1.5 kW cm-2, according to the formulas given by Giusfredi et al. Giusfredi et al. (2010) Note that the intra-cavity power also decays during a RD event, which reduces the saturation effect and leads to an non-exponential decay Giusfredi et al. (2010). Since the main purpose of the present study is to determine the precise line position instead of the profile of the saturation spectrum, we simply applied a single exponential decay function to fit the RD curve. Only data within the beginning 50 s of each RD curve were included in the fit, while the ring-down time was about 30 s at a sample pressure of 1 Pa. The intra-cavity light intensity was estimated to be from 3 W to 0.5 W during this period. Taking into account a laser beam waist radius of 0.76 mm, we estimated that the saturation parameter was below 10%. The spectral scan was accomplished by tuning the frequency . At each frequency point, about 3000 RD events were recorded within 2 seconds. Each scan took about 100 seconds when a typical frequency step of 50 kHz around the line center was applied. We also tried with finer frequency steps but did not see notable differences. Spectra were recorded with sample pressures in the range between 0.2 Pa and 1.5 Pa, and some of them are shown in Fig. 3(a). Each spectrum shown in the figure is an average of 20 scans and the signal-to-noise ratio reaches over 1000.
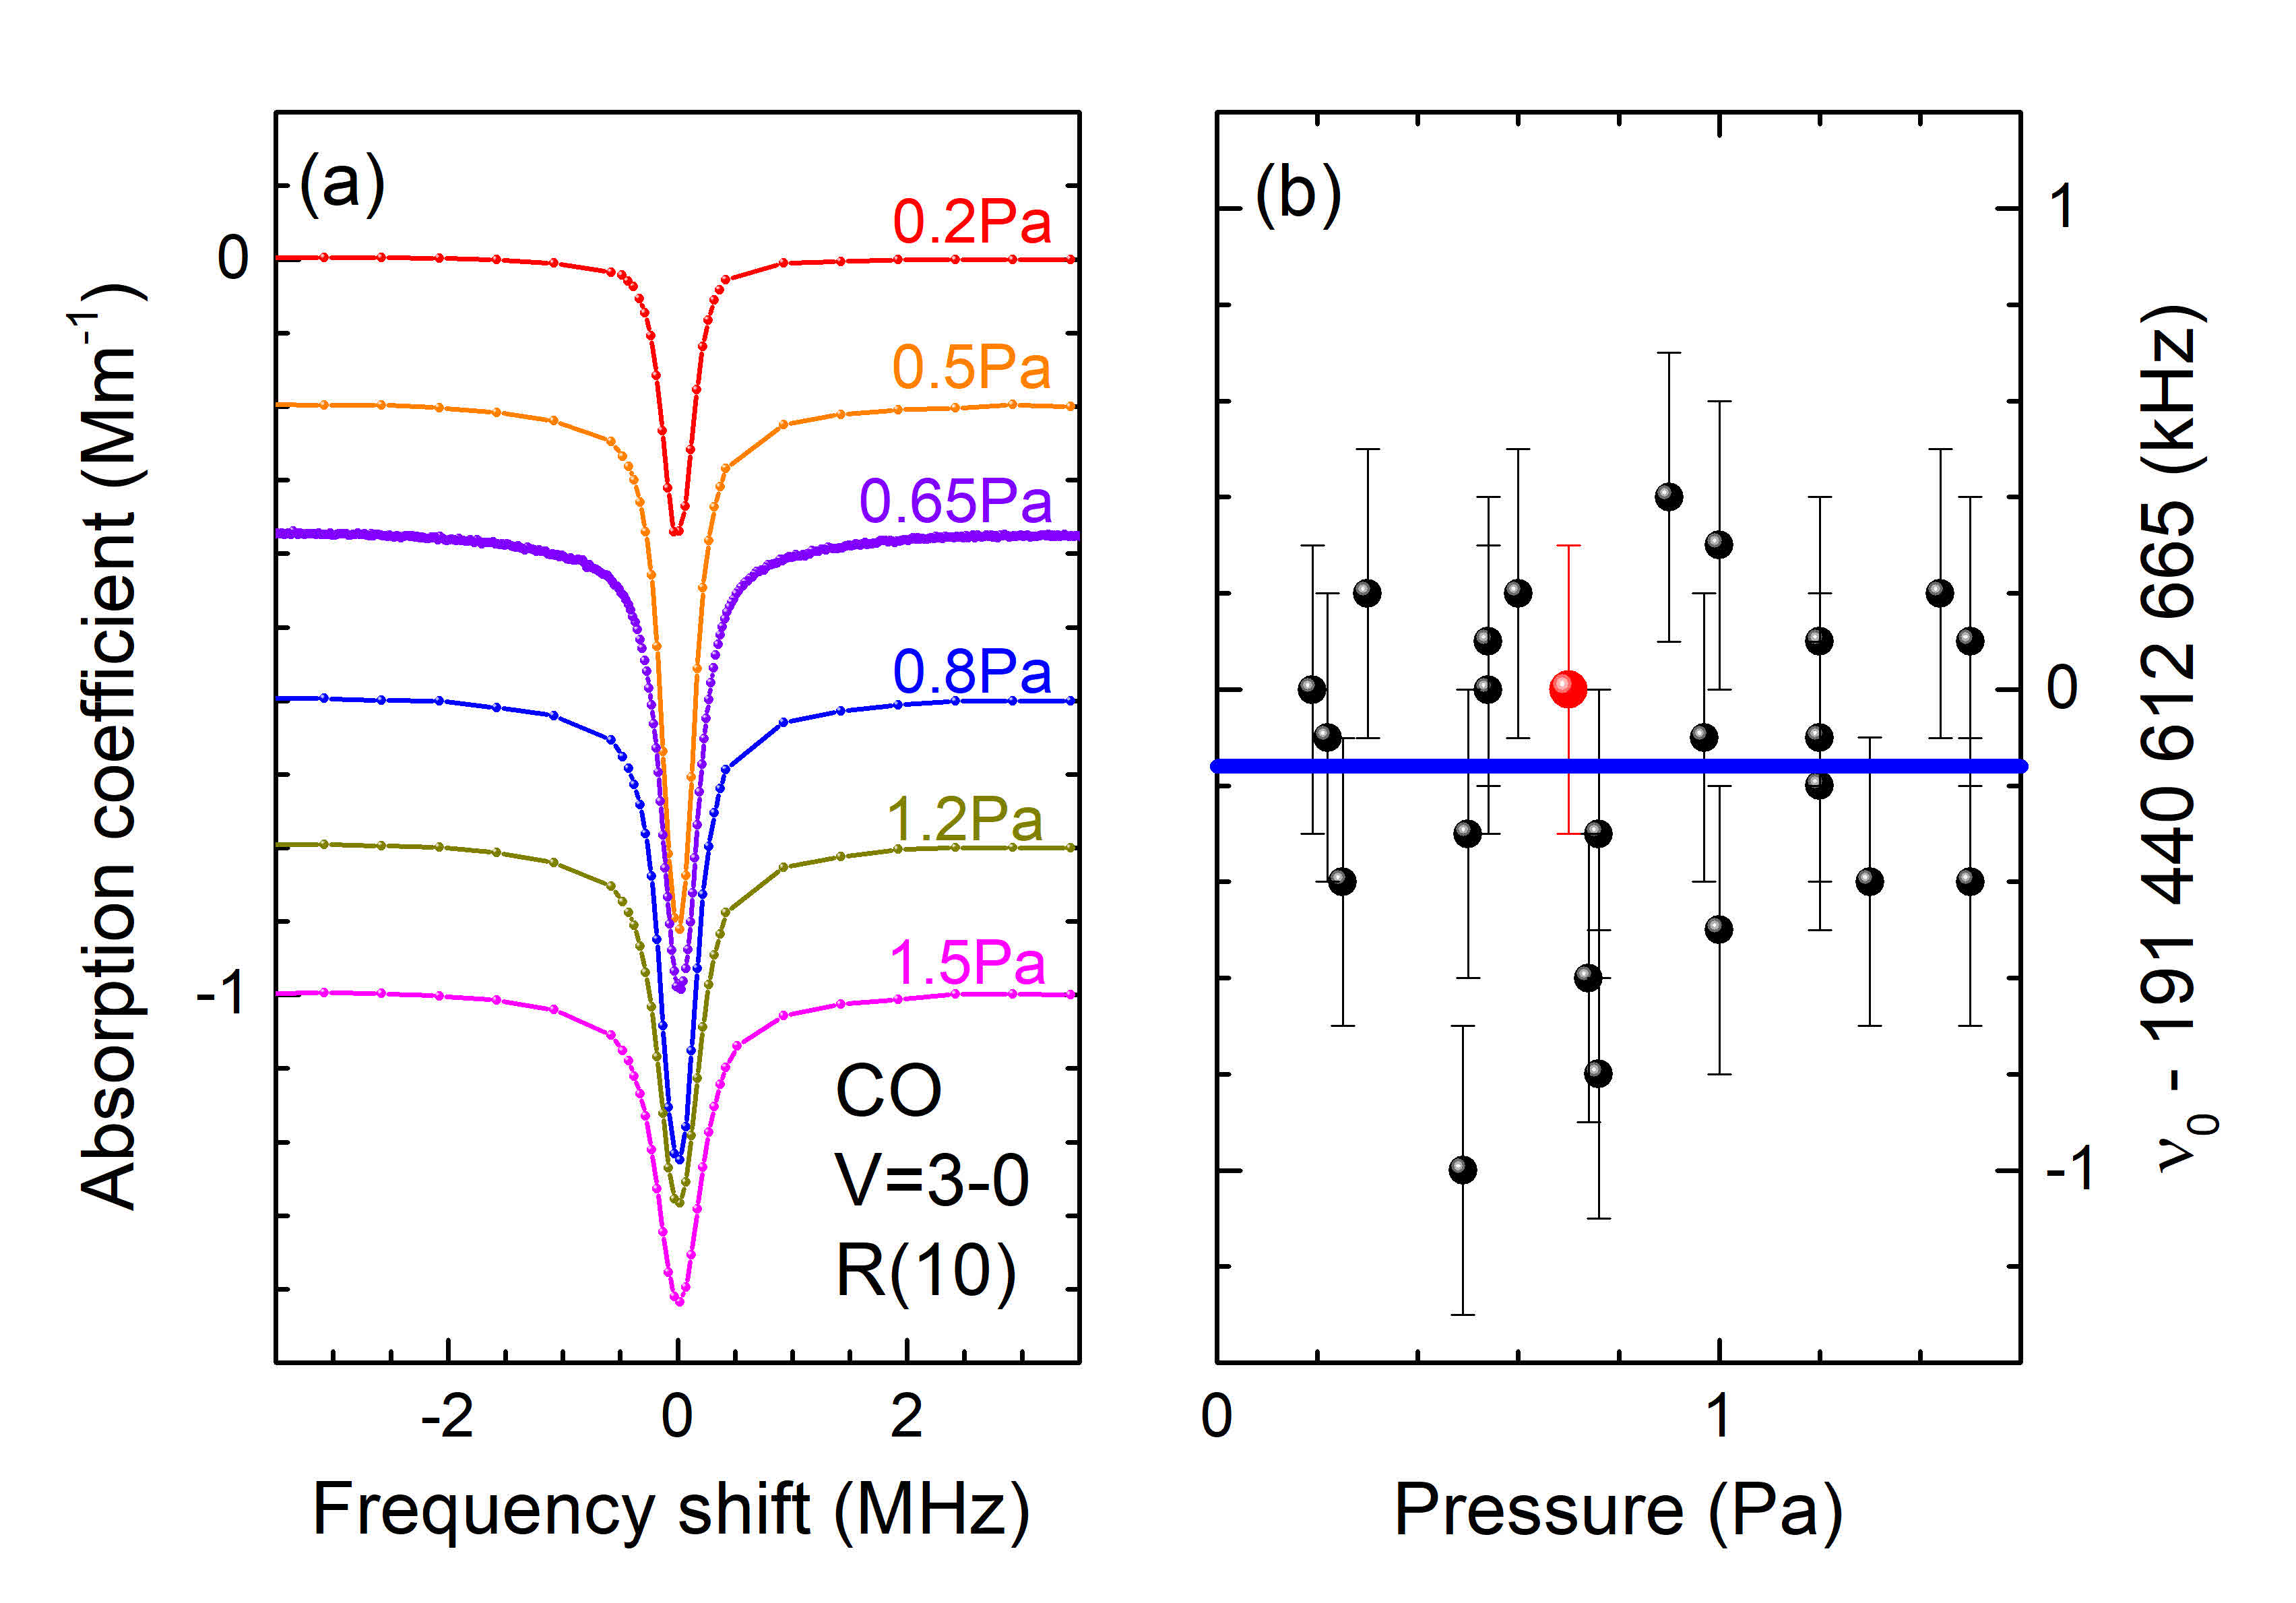
The line parameters, position, depth, and width, are derived by fitting the spectra. For simplicity, the Lorentzian function was used in the fit, although deviation from the Lorentzian profile has been found in saturation spectra Bordé et al. (1976); Chardonnet et al. (1994). The derived line width (full width at half maximum) is about 0.2 MHz, being consistent with the transit-time broadening width of 0.13 MHz estimated from the mean velocity of the CO molecules and the laser beam waist. Fig. 3(b) shows the R(10) line positions obtained at different pressures, and each data point stands for an averaged value derived from about 30 scans. The red point in Fig. 3(b) is the result from the measurement taken half a year after other measurements (black points). The excellent agreement indicates the long-term stability of the measurements. The horizontal line shown in Fig. 3(b) gives the weighted average of the line positions obtained at different pressures and the statistical uncertainty is 0.1 kHz. Other contributions to the uncertainty have been investigated, described below.
If we use a linear fit to the data shown in Fig. 3(b), we can get a coefficient of kHz/Pa. However, a self-pressure induced shift of -189 MHz/atm (1.9 kHz/Pa) has been reported Picqué and Guelachvili (1997) based on the Doppler-broadened spectra of CO recorded under normal pressures ( Pa). There is a considerable difference between the line shift obtained from saturation spectra and that from conventional Doppler-limited spectra. Similar results Bordé et al. (1976); Chardonnet et al. (1994); Ma et al. (1999) have been reported before, but it has not yet been well interpreted. Here we simply use the value averaged from the positions obtained from spectra recorded at different pressures, but an uncertainty of 0.2 kHz is left for possible contribution from the pressure-induced shift which needs further investigation. We also include an uncertainty of 0.2 kHz due to the model of the line profile, although we did not observe any asymmetry above the noise level.
The spectral laser frequency is determined by the reference laser frequency , the beat frequency , and the radio frequencies applied on AOM and EOM. The reference laser frequency is calibrated by the frequency comb and eventually by the GPS-disciplined rubidium clock. The rubidium clock has a stated frequency stability of at 10 s and the absolute frequency accuracy is (0.4 kHz at 1.57 m) when disciplined by the GPS signal. The beat frequency is monitored by a frequency counter which shows a fluctuation well below 50 Hz (Fig. 2). The RF frequency applied on the AOM has a fluctuation below 50 Hz, mainly due to the drift of the room temperature. The EOM driven frequency is also referenced to the rubidium clock, and the accuracy is better than 1 Hz. Taking a root-square mean velocity of 493 m/s of the CO molecule at 273 K, we estimate that the shift due to the second order Doppler effect is -258 Hz and the related uncertainty is below 10 Hz. Under a laser power of 3 W inside the cavity, the AC Stark shift is negligible for these two CO transitions. We have also used a different input laser power in the measurement, but found no difference in the line position within the experimental uncertainty.
The overall uncertainty budget is given in Table 1. The positions for lines R(9) and R(10) are determined to be 191 360 212 761.1 kHz and 191 440 612 662.2 kHz respectively, with an overall uncertainty of 0.5 kHz. The R(9) line position agrees with the value of 191 306 212 770(7) kHz from our previous study Wang et al. (2017), but the accuracy has been improved by an order of magnitude. Note that a recoil shift of -2.9 kHz has been included in this work but not in our previous study. The results also agree with the line positions reported by Mondelain et al Mondelain et al. (2015) from Doppler-limited CRDS study, which were 191 360 212.54 MHz and 191 440 612.43 MHz with an uncertainty of 0.3 MHz.
| Source | Frequency | Uncertainty |
|---|---|---|
| Statistical | 191 360 212 763.7 (R9) | 0.1 |
| 191 440 612 664.8 (R10) | 0.1 | |
| Comb frequency | 0.4 | |
| Locking servo | 0.05 | |
| EOM frequency | 0.001 | |
| AOM frequency | 0.05 | |
| Pressure shift | 0.2 | |
| Line profile asymmetry | 0.2 | |
| 2nd order Doppler | +0.26 | 0.01 |
| Recoil shift | -2.9 | - |
| Total | 191 360 212 761.1 (R9) | 0.5 |
| 191 440 612 662.2 (R10) | 0.5 |
In conclusion, a laser-locked cavity ring-down spectrometer, with both the probe laser and the high-finesse cavity locked and referenced to an optical frequency comb, was constructed and used to record the Lamb-dip spectra of the R(9) and R(10) lines in the band of CO. The present work demonstrates an accuracy of 0.5 kHz and also a sensitivity of cm-1. Note that the accuracy is currently limited by the rubidium clock, the line profile model, and the collision effect, while the statistical uncertainty is only 0.1 kHz. By using a more accurate clock (like a hydrogen maser or a fountain clock), and taking further analysis on the Lamb-dip line profile, we expect to pursue an accuracy of 0.1 kHz or better. There are an enormous amount of molecular transitions in the near infrared with a transition rate higher than the CO lines studied here, and their positions can be determined with the same method, which could considerably enlarge and improve the near-infrared frequency standards. We are also using the method to detect the saturation spectrum of the HD molecule. The strongest absorption line of HD accessible by a NIR diode laser is the R(1) line in the first overtone, located at 7241 cm-1, with a saturation power of W cm-2. Using an external-cavity diode laser with several tens of milli-Watt, we would be able to detect the Lamb-dip at a sensitivity of cm-1 and expect to determine the line position with a fractional accuracy of . Combined with the progress on the theoretical calculation Puchalski et al. (2016) of this two-electron molecule, such a measurement will provide an independent determination of the proton-electron mass ratio.
The authors are indebted to Dr. P. Wcisło from Nicolaus Copernicus University for helpful discussions. This work is jointly supported by CAS (XDB21020100), by NSFC (21688102, 91436209, 21427804, 21225314), and by NBRPC (2013CB834602).
References
- Hong et al. (2003) F. L. Hong, A. Onae, J. Jiang, R. X. Guo, H. Inaba, K. Minoshima, T. R. Schibli, H. Matsumoto, and K. Nakagawa, Opt. Lett. 28, 2324 (2003).
- Foreman et al. (2005) S. M. Foreman, A. Marian, J. Ye, E. A. Petrukhin, M. A. Gubin, O. D. Mucke, F. N. C. Wong, E. P. Ippen, and F. X. Kartner, Opt. Lett. 30, 570 (2005).
- Smith et al. (2009) R. L. Smith, K. M. Pontoppidan, E. D. Young, M. R. Morris, and E. F. van Dishoeck, Astrophys. J. 701, 163 (2009).
- Biesheuvel et al. (2016) J. Biesheuvel, J. P. Karr, L. Hilico, K. S. E. Eikema, W. Ubachs, and J. C. J. Koelemeij, Nat. Comm. 7, 10385 (2016).
- Hudson et al. (2006) E. R. Hudson, H. J. Lewandowski, B. C. Sawyer, and J. Ye, Phys. Rev. Lett. 96, 143004 (2006).
- Shelkovnikov et al. (2008) A. Shelkovnikov, R. J. Butcher, C. Chardonnet, and A. Amy-Klein, Phys. Rev. Lett. 100, 150801 (2008).
- Ubachs et al. (2016) W. Ubachs, J. Bagdonaite, E. J. Salumbides, M. T. Murphy, and L. Kaper, Rev. Mod. Phys. 88, 021003 (2016).
- Daussy et al. (1999) C. Daussy, T. Marrel, A. Amy-Klein, C. T. Nguyen, C. J. Borde, and C. Chardonnet, Phys. Rev. Lett. 83, 1554 (1999).
- Salumbides et al. (2013) E. J. Salumbides, J. C. J. Koelemeij, J. Komasa, K. Pachucki, K. S. E. Eikema, and W. Ubachs, Phys. Rev. D 87, 112008 (2013).
- Quack et al. (2008) M. Quack, J. Stohner, and M. Willeke, “High-resolution spectroscopic studies and theory of parity violation in chiral molecules,” in Annual Review of Physical Chemistry, Vol. 59 (2008) pp. 741–769.
- Tokunaga et al. (2013) S. K. Tokunaga, C. Stoeffler, F. Auguste, A. Shelkovnikov, C. Daussy, A. Amy-Klein, C. Chardonnet, and B. Darquié, Mol. Phys. 111, 2363 (2013).
- Kassi and Campargue (2012) S. Kassi and A. Campargue, J. Chem. Phys. 137, 234201 (2012).
- Tan et al. (2014) Y. Tan, J. Wang, C.-F. Cheng, X.-Q. Zhao, A.-W. Liu, and S.-M. Hu, J. Mol. Spectrosc. 300, 60 (2014).
- Giusfredi et al. (2010) G. Giusfredi, S. Bartalini, S. Borri, P. Cancio, I. Galli, D. Mazzotti, and P. De Natale, Phys. Rev. Lett. 104, 110801 (2010).
- Gatti et al. (2016) D. Gatti, R. Gotti, A. Gambetta, M. Belmonte, G. Galzerano, P. Laporta, and M. Marangoni, Sci. Rep. 6, 27183 (2016).
- Wang et al. (2017) J. Wang, Y. R. Sun, L.-G. Tao, A.-W. Liu, T.-P. Hua, F. Meng, and S.-M. Hu, Rev. Sci. Instrum. 88, 043108 (2017).
- Truong et al. (2013a) G. W. Truong, D. A. Long, A. Cygan, D. Lisak, R. D. van Zee, and J. T. Hodges, J. Chem. Phys. 138, 094201 (2013a).
- Santamaria et al. (2016) L. Santamaria, V. Di Sarno, P. De Natale, M. De Rosa, M. Inguscio, S. Mosca, I. Ricciardi, D. Calonico, F. Levi, and P. Maddaloni, Phys. Chem. Chem. Phys. 18, 16715 (2016).
- Spaun et al. (2016) B. Spaun, P. B. Changala, D. Patterson, B. J. Bjork, O. H. Heckl, J. M. Doyle, and J. Ye, Nature 533, 517 (2016).
- Burkart et al. (2015) J. Burkart, T. Sala, D. Romanini, M. Marangoni, A. Campargue, and S. Kassi, J. Chem. Phys. 142, 191103 (2015).
- Gambetta et al. (2010) A. Gambetta, E. Fasci, A. Castrillo, M. Marangoni, G. Galzerano, G. Casa, P. Laporta, and L. Gianfrani, New J. Phys. 12, 103006 (2010).
- Balling et al. (2005) P. Balling, M. Fischer, P. Kubina, and R. Holzwarth, Opt. Expr. 13, 9196 (2005).
- Edwards et al. (2005) C. S. Edwards, H. S. Margolis, G. P. Barwood, S. N. Lea, P. Gill, and W. R. C. Rowley, Appl. Phys. B 80, 977 (2005).
- Madej et al. (2006) A. A. Madej, J. E. Bernard, A. J. Alcock, A. Czajkowski, and S. Chepurov, J. Opt. Soc. Am. B 23, 741 (2006).
- Twagirayezu et al. (2015) S. Twagirayezu, M. J. Cich, T. J. Sears, C. P. McRaven, and G. E. Hall, J. Mol. Spectrosc. 316, 64 (2015).
- Czajkowski et al. (2009) A. Czajkowski, A. J. Alcock, J. E. Bernard, A. A. Madej, M. Corrigan, and S. Chepurov, Opt. Expr. 17, 9258 (2009).
- Amy-Klein et al. (2004) A. Amy-Klein, H. Vigue, and C. Chardonnet, J. Mol. Spectrosc. 228, 206 (2004).
- Okubo et al. (2011) S. Okubo, H. Nakayama, K. Iwakuni, H. Inaba, and H. Sasada, Opt. Expr. 19, 23878 (2011).
- Ting et al. (2014) W.-J. Ting, C.-H. Chang, S.-E. Chen, H.-C. Chen, J.-T. Shy, B. J. Drouin, and A. M. Daly, J. Opt. Soc. Am. B 31, 1954 (2014).
- Gang et al. (2015) L. Gang, E. G. Iouli, S. R. Laurence, T. Yan, S.-M. Hu, K. Samir, C. Alain, and S. M. Emile, Astrophys. J. Supp. Ser. 216, 15 (2015).
- Cheng et al. (2015) C. F. Cheng, J. Wang, Y. R. Sun, Y. Tan, P. Kang, and S. M. Hu, Metrologia 52, S385 (2015).
- Daussy et al. (2007) C. Daussy, M. Guinet, A. Amy-Klein, K. Djerroud, Y. Hermier, S. Briaudeau, C. J. Bordé, and C. Chardonnet, Phys. Rev. Lett. 98, 250801 (2007).
- Sun et al. (2011) Y. R. Sun, H. Pan, C.-F. Cheng, A.-W. Liu, J.-T. Zhang, and S.-M. Hu, Opt. Expr. 19, 19993 (2011).
- Gao et al. (2010) B. Gao, W. Jiang, A.-W. Liu, Y. Lu, C.-F. Cheng, G.-S. Cheng, and S.-M. Hu, Rev. Sci. Instrum. 81, 043105 (2010).
- Ma et al. (1999) L. S. Ma, J. Ye, P. Dube, and J. L. Hall, J. Opt. Soc. Am. B 16, 2255 (1999).
- Truong et al. (2013b) G. W. Truong, K. O. Douglass, S. E. Maxwell, R. D. van Zee, D. F. Plusquellic, J. T. Hodges, and D. A. Long, Nat. Photon. 7, 532 (2013b).
- Foltynowicz et al. (2011) A. Foltynowicz, T. Ban, P. Masłowski, F. Adler, and J. Ye, Phys. Rev. Lett. 107, 233002 (2011).
- Burkart et al. (2014) J. Burkart, D. Romanini, and S. Kassi, Opt. Lett. 39, 4695 (2014).
- Rothman et al. (2013) L. S. Rothman, I. E. Gordon, Y. Babikov, A. Barbe, D. Chris Benner, P. F. Bernath, M. Birk, L. Bizzocchi, V. Boudon, L. R. Brown, A. Campargue, K. Chance, E. A. Cohen, L. H. Coudert, V. M. Devi, B. J. Drouin, A. Fayt, J. M. Flaud, R. R. Gamache, J. J. Harrison, J. M. Hartmann, C. Hill, J. T. Hodges, D. Jacquemart, A. Jolly, J. Lamouroux, R. J. Le Roy, G. Li, D. A. Long, O. M. Lyulin, C. J. Mackie, S. T. Massie, S. Mikhailenko, H. S. P. Müller, O. V. Naumenko, A. V. Nikitin, J. Orphal, V. Perevalov, A. Perrin, E. R. Polovtseva, C. Richard, M. A. H. Smith, E. Starikova, K. Sung, S. Tashkun, J. Tennyson, G. C. Toon, V. G. Tyuterev, and G. Wagner, J. Quant. Spectrosc. Radiat. Transf. 130, 4 (2013).
- Bordé et al. (1976) C. J. Bordé, J. L. Hall, C. V. Kunasz, and D. G. Hummer, Phys. Rev. A 14, 236 (1976).
- Chardonnet et al. (1994) C. Chardonnet, F. Guernet, G. Charton, and C. J. Bordé, Appl. Phys. B 59, 333 (1994).
- Picqué and Guelachvili (1997) N. Picqué and G. Guelachvili, J. Mol. Spectrosc. 185, 244 (1997).
- Mondelain et al. (2015) D. Mondelain, T. Sala, S. Kassi, D. Romanini, M. Marangoni, and A. Campargue, J. Quant. Spectrosc. Radiat. Transf. 154, 35 (2015).
- Puchalski et al. (2016) M. Puchalski, J. Komasa, P. Czachorowski, and K. Pachucki, Phys. Rev. Lett. 117, 263002 (2016).