VLA Observations of the disk around the young brown dwarf 2MASS J044427+2512
Abstract
We present multi-wavelength radio observations obtained with the VLA of the protoplanetary disk surrounding the young brown dwarf 2MASS J04442713+2512164 (2M0444) in the Taurus star forming region. 2M0444 is the brightest known brown dwarf disk at millimeter wavelengths, making this an ideal target to probe radio emission from a young brown dwarf. Thermal emission from dust in the disk is detected at 6.8 and 9.1 mm, whereas the 1.36 cm measured flux is dominated by ionized gas emission. We combine these data with previous observations at shorter sub-mm and mm wavelengths to test the predictions of dust evolution models in gas-rich disks after adapting their parameters to the case of 2M0444. These models show that the radial drift mechanism affecting solids in a gaseous environment has to be either completely made inefficient, or significantly slowed down by very strong gas pressure bumps in order to explain the presence of mm/cm-sized grains in the outer regions of the 2M0444 disk. We also discuss the possible mechanisms for the origin of the ionized gas emission detected at 1.36 cm. The inferred radio luminosity for this emission is in line with the relation between radio and bolometric luminosity valid for for more massive and luminous young stellar objects, and extrapolated down to the very low luminosity of the 2M0444 brown dwarf.
Subject headings:
circumstellar matter — stars: individual (2M1207) — planets and satellites: formation — submillimeter: stars1. Introduction
Young pre-Main Sequence (PMS) stars and brown dwarfs (BDs) are orbited by disks which are the cradles of planets (see Andrews, 2015, for a recent review). According to the core accretion scenario, planets are formed via the growth of solid particles in these young circumstellar disks (e.g., Mordasini et al., 2010). Studying the properties and growth of dust particles in these disks is therefore crucial to understand the process of planet formation. In particular, the radial drift problem for pebbles in the outer disk regions and larger rocks in the inner disk is one of the most compelling impediments to our understanding of the formation of planetesimals (Weidenschilling, 1977), and significant efforts are being made on both observational and theoretical grounds (e.g., Testi et al., 2014; Johansen et al., 2014).
Because of their low-density and temperature, BD disks are particularly interesting as they allow to test the models of dust evolution in borderline environments (Pinilla et al., 2013; Meru et al., 2013). Several disks around young BDs, with masses between those of stars and planets, have been characterized at infrared and sub-millimeter wavelengths (e.g. Natta & Testi, 2001; Klein et al., 2003; Scholz et al., 2006; Morrow et al., 2008; Furlan et al., 2011; Harvey et al., 2012; Alves de Oliveira et al., 2013; Ricci et al., 2014; van der Plas et al., 2016; Testi et al., 2016; Ricci et al., 2017). The study of BD disks is particularly relevant also to investigate the potential of finding exoplanets around more evolved BDs (Payne & Lodato, 2007; Ricci et al., 2014).
Here we present Karl G. Jansky Very Large Array (VLA) observations of the 2MASS J04442713+2512164 (henceforth 2M0444) system, made of a young BD (M7.25-spectral type, sub-stellar luminosity , effective temperature K, and mass , Luhman, 2004), surrounded by a disk first detected in the infrared (Kenyon et al., 1994; Hartmann et al., 2005; Luhman et al., 2006; Guieu et al., 2007; Bouy et al., 2008). 2M0444 is a member of the Taurus star forming region, with an estimated age of Myr, and a distance of about 140 pc (Loinard et al., 2007; Torres et al., 2009, 2012).
The 2M0444 disk is the brightest BD disk from the single-dish survey in Taurus by Scholz et al. (2006) at a wavelength of 1.3 millimeter. Thanks to its relatively high flux density ( mJy) and large disk (outer radius au), this was the first BD disk to be spatially resolved at mm-wavelengths (Ricci et al., 2013, using the Combined Array for Research in Millimeter-wave Astronomy, CARMA).
Subsequent observations with the Atacama Large Millimeter/submillimeter Array (ALMA) revealed a low value of the spectral index between 0.89 and 3.2 mm, (, Ricci et al., 2014). The inferred value of the spectral index of the dust opacity () at these wavelenghts indicates the presence of mm-sized grains in the outer regions of this BD disk, similarly to what is found in circumstellar disks (Testi et al., 2014).
Our new VLA observations for the continuum emission of 2M0444 at 6.8, 9.1 mm and 1.36 cm, allow us to probe dust thermal emission at wavelengths longer than 3 mm for the first time in a BD disk. This lets us study dust particles that are larger than can be probed with ALMA. Furthermore, observations at these long wavelengths can pick up emission from non-dust emission processes, and related to the activity of the young central object (e.g., Shirley et al., 2007).
2. VLA Observations and Data Reduction
We observed the 2M0444 young brown dwarf with the VLA in bands Q (effective wavelength of 6.8 mm), Ka (9.1 mm), and K (1.36 cm). The VLA correlator was configured to record dual polarization with 64 separate spectral windows, each with a total bandwidth of 128 MHz.
Observations were performed during the month of March 2013 (see Table 1), when the VLA was in the D array configuration with 27 available antennas. Baseline lengths ranged between about 35 m and 1.0 km.
The visibility datasets were calibrated with the VLA Calibration Pipeline111https://science.nrao.edu/facilities/vla/data-processing/pipeline developed by the National Radio Astronomy Observatory (NRAO) within the CASA software package (McMullin et al., 2007). During the observations, the quasars J03194130, J04312037, and J05424951 were used to calibrate the frequency-dependent bandpass, gain terms and absolute flux scale, respectively. Observations for each band were repeated twice.
For imaging the interferometric visibilities we used the clean algorithm in CASA. Since the VLA D array configuration does not allow us to spatially resolve the emission from the 2M0444 disk, we performed the imaging using a natural weighting, which maximizes sensitivity. The flux values extracted in the two days were generally found to be consistent within 10. We adopt this value as the uncertainty on the absolute flux calibration. The observations were then combined to produce a single final image for each band. The inferred rms and flux density values are listed in Table 1. The flux density values were extracted by integrating the disk surface brightness over circular apertures with radii of centered on the location of 2M0444.
| Band | [] | [ | [ | Observing days |
|---|---|---|---|---|
| Q | 6.8 | 6.0 | 159 | 2013 March 11, 13 |
| Ka | 9.1 | 2.8 | 71 | 2013 March 30, 31 |
| K | 13.6 | 2.9 | 64 | 2013 March 10, 12 |
3. Results
The 2M0444 disk was detected at all the three VLA bands. The signal-to-noise ratios are at mm, respectively (Table 1).
Figure 1 displays the disk SED at sub-mm to cm wavelengths after combining the new VLA detections presented here at 6.8, 9.1 mm and 1.36 cm with previous detections with ALMA at 0.89 and 3.2 mm (Ricci et al., 2014) and CARMA at 1.3 mm (Ricci et al., 2013). We do not include here the fluxes measured at very similar wavelengths by Scholz et al. (2006) and Bouy et al. (2008) because of the much lower signal-to-noise ratios than the ALMA and CARMA detections.
This figure shows an apparent steepening of the disk SED at longer wavelengths, with evidence of excess emission at 1.36 cm over a power-law derived fitting the flux densities measured at shorter wavelengths. When fitting all the flux densities measured between 0.89 and 9.1 mm with a single power-law, we infer a spectral index (). However, the slope at mm is steeper than at shorter wavelengths. If fitting separately the flux densities at mm and at mm, we get , and , respectively.
The extrapolated flux density at 1.36 cm from the power-law derived between 3.2 and 9.1 mm is Jy. The measured flux density of 2M0444 at this wavelength is222The reported uncertainty includes both the statistical uncertainty given by the rms noise and the systematic uncertainty on the absolute flux scale (Section 2), these terms added in quadrature. Jy, which is above the power-law extrapolated value.
4. Analysis
4.1. The steepening of the SED at long wavelengths
Because of the decrease of the dust opacity with wavelength (e.g., Draine, 2006), the dust thermal emission from young disks around PMS stars and brown dwarfs is found to be mostly optically thin at wavelengths close to 1 mm, and longer (e.g., Testi et al., 2003; Rodmann et al., 2006; Ricci et al., 2012, 2013; Testi et al., 2014). In the optically thin regime, the disk flux density depends on frequency via , where is the Planck function associated to the dust emission. Therefore, the spectral index of the flux density , where and are the spectral indices of the dust opacity and Planck function, respectively.
Ricci et al. (2014) constrained the structure of the 2M0444 disk by modeling the interferometric visibilities obtained with ALMA at 0.89 mm and the measured spectral index of between 0.89 and 3.2 mm. From this analysis, they inferred values of and . The value of indicates that the mm-wave emission is dominated by dust that is cold enough to depart from the Rayleigh-Jeans regime of the emission. In particular, the Ricci et al. (2014) models predict a temperature radial profile decreasing with the distance from the 2M0444 brown dwarf, with values of K between 40 au and the outer radius of the disk at au. In these models, the dust temperature in the disk outer regions is dominated by external heating due to the interstellar radiation impinging on the disk. A value of K was assumed based on the temperature inferred for the regions of protostellar cores directly illuminated by the interstellar radiation in the Taurus region. In the appendix of the current paper we provide the results of physical radiative transfer models that support this assumption.
As shown in Figure 2, at a given temperature, the spectral index of the Planck function increases at longer wavelengths. For the range given above for the outer regions of the 2M0444 disk, i.e. K, between 3.2 and 9.1 mm. Hence, within the uncertainties on the inferred value of the SED spectral index (Section 3), the steepening of the SED of the 2M0444 disk can be explained by the steepening of the Planck function at longer wavelengths as due to the low dust temperatures in the disk outer regions according to the Ricci et al. (2014) models.
Note that this is under the assumptions that i) the emission is optically thin, and ii) the spectral index of the dust opacity does not vary significantly between 0.89 and 9.1 mm. The low optical depth of the dust emission at 0.89 mm, and therefore also at longer wavelengths due to the decrease of the dust opacity with wavelength, has been confirmed by the modeling presented in Ricci et al. (2014). Regarding the variation of the dust opacity with wavelength, dust models with different assumptions on the chemical composition and grain size distribution show that can vary with wavelength in the spectral interval discussed here (e.g., see upper panels in Figures 3-5 and Fig. 6 in Draine, 2006; Miyake & Nakagawa, 1993). In the vast majority of cases, increases with wavelength, in line with the steepening of the SED of the 2M0444 disk, but there are exceptions (Draine, 2006).
To summarize, although the observed steepening of the SED of the 2M0444 disk can be explained solely by the steepening of the Planck function at long wavelengths for dust thermal emission at K (Ricci et al., 2014), the predictions of dust models suggest that some contribution is likely due also to a steepening of the spectral index of the dust opacity at 1 mm.
4.2. Models of dust evolution in the 2M0444 disk
The measured values of the spectral index of the disk SED at sub-mm/mm wavelengths imply333From the relation , in order to reproduce the measured value of between 3.2 and 9.1 mm with would require , given by unreasonably cold dust ( K, Fig. 2, see also the appendix, Fig. 5). , which can be obtained only by invoking dust grains as large as mm, or larger, in the outer regions of the 2M0444 disk (Draine, 2006; Testi et al., 2014).
We compare this result with the predictions of dust evolution models that compute the dynamics of dust particles simultaneously with their growth, erosion, and fragmentation, as presented in Birnstiel et al. (2010). For this comparison, we adopted the (sub-)stellar properties constrained for 2M0444, i.e. a bolometric luminosity , effective temperature K (Luhman, 2004), mass of obtained using the Baraffe et al. (2003) evolutionary models, and similar to the value of inferred by Bouy et al. (2008). For the disk, we adopted the surface density radial profile constrained by the Ricci et al. (2014) modeling of the ALMA visibilities, i.e. a power-law function with an exponent , truncated at an outer radius of 139 au, and with a total disk mass (gasdust) of 1.3 (gas-to-dust mass ratio of 100). The temperature radial profile is also taken by Ricci et al. (2014). We assume an -disk viscosity, with a value of (Pringle, 1981).
In our numerical models we assume that the initial grain size is 1 m in the entire disk and with an initially constant dust-to-gas mass ratio of 0.01. In these models, particles can stick when the relative velocities are below a velocity threshold, otherwise the collision leads to erosion or complete fragmentation of particles. The relative velocities are calculated according to the radial drift, dust settling, Brownian and turbulent motions. The velocity threshold, or fragmentation velocity , is assumed to be 10 and 30 m s-1, in agreement with laboratory experiments and numerical simulations of collisions of icy grains (Blum & Wurm, 2008; Gundlach et al., 2011). For the dust dynamics, we consider radial drift, gas drag, and turbulence; all of these mechanisms depend on the grain size and hence the importance of modeling grain growth and dust dynamics simultaneously. We calculate the evolution up to 5 Myr.
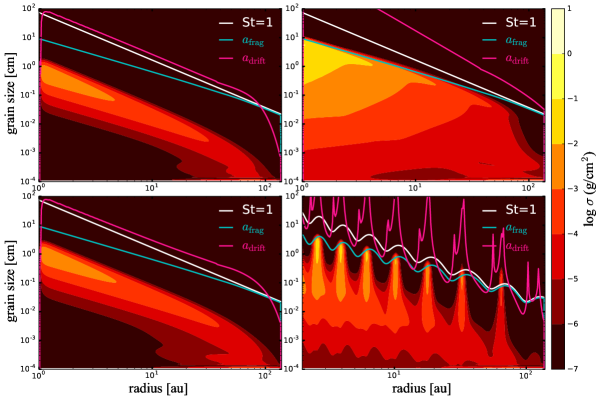
Pinilla et al. (2013) demonstrated that, for disks with gas surface densities monotonically decreasing with stellocentric radius, the timescale of radial drift for mm-sized grains is shorter around stars with lower mass, and it can be a severe problem to explain mm-grains in the outer regions of BD disks. For this reason, we assume in some of these models that either the radial drift is completely neglected or reduced by a given factor (, with ). In addition, we also consider models where the the gas surface density is perturbed by a sinusoidal function with certain amplitude and frequency, to mimic bumps in the pressure radial profile (Pinilla et al., 2012a) which can be produced by different physical mechanisms (e.g. zonal flows, dead zones, or planet-disk interaction, see Johansen et al., 2009; Uribe et al., 2011; Pinilla et al., 2012b). For the sinusoidal perturbation, we consider two values for the amplitude ( and 0.6) and a wavelength equal to the disk local scale height. These values are known to cause a slowing down or even halting locally the radial motion of mm-sized solids in the disk outer regions (Pinilla et al., 2013).
The results of our calculations are shown in Fig. 3, which represents the grain size distribution of particles across the disk for a snapshot taken at Myr from the beginning of our simulations. First, in the models where the radial drift is included (top left panel), without any kind of reduction or pressure bumps, no mm-sized grains are found at au from the star because of the radial drift of these particles. The effects of the radial drift mechanism are evident in the comparison with the model in which radial drift was neglected (top right panel). In this case, grains grow to sizes of mm all the way to about 100 au. At this time, at any given distance from the brown dwarf within 100 au, the size of the largest grains is defined by the fragmentation barrier (Birnstiel et al., 2010), as grains do not drift radially. In this regime, even larger grains would be obtained in disk regions with lower viscosity and higher fragmentation velocities than those considered in Fig. 3, as .
Relative to the model with unimpeded drift, reducing the radial drift by 40 or 60% (the latter case shown in the bottom left panel in Fig. 3) does not show significant differences in the dust density distribution at Myr. In the models with strong sinusoidal bumps (, bottom right panel), particles with mm-cm sizes are instead efficiently trapped up to radii of about 100 au.
To summarize the main results of our calculations, disk models in which the radial drift mechanism has been either completely made inefficient, or significantly slowed down by the presence of strong gas pressure bumps are necessary to explain the presence of mm-sized grains in the outer regions of the 2M0444 disk.
4.3. The excess emission at 1.36 cm
As described in Section 3, the measured flux density at 1.36 cm indicates the presence of ionized gas emission in excess of the dust thermal emission. This excess emission at cm wavelengths has been observed in several disks around young PMS stars (Rodmann et al., 2006; Ubach et al., 2012; Pascucci et al., 2014; Ubach et al., 2017). For these disks, the spectral indices measured at cm wavelengths indicate free-free emission from a wind or jet, and chromospheric emission associated with stellar activity as the physical mechanisms responsible for this excess. In the case of young brown dwarfs, ionizing UV radiation can be produced by hot shocked gas accreting on the brown dwarf. Herczeg & Hillenbrand (2008) derived a temperature of K for the shocked accreting gas by fitting the Balmer continuum observed from 2M0444.
Figure 4 shows the relation between radio luminosity at 3.6 cm and bolometric luminosity for Young Stellar Objects (YSOs), Very Low Luminosity Objects (VeLLOs) and young BDs, spanning about 6 orders of magnitude in luminosity. The median of the spectral index measured between 3 and 6 cm for protostars is (Shirley et al., 2007), in line with partially optically thick free-free emission from a wind or jet with a density gradient (Panagia & Felli, 1975; Wright & Barlow, 1975; Reynolds, 1986). This correlation likely reflects the fact that more luminous protostars drive more powerful ionizing winds and jets, and are likely surrounded by more massive circumstellar material, especially for the youngest Class 0/I YSOs which are still embedded in their parental envelope (Curiel et al., 1987, 1989; Hsieh et al., 2016).
This relation has been recently extended to very low luminosities, , via cm-wave observations of very young Class 0/I proto-BDs (Morata et al., 2015; Forbrich et al., 2015) and one Class II BD disk, FU Tau A (Rodriguez et al., 2017), although a mass above the hydrogen burning limit has been proposed for this object using models of magnetic stars to explain its observed high luminosity (Stelzer et al., 2013).
In order to add 2M0444 to the plot in Fig. 4, we extrapolated to 3.6 cm the excess emission measured at 1.36 cm. We adopted a range for the cm-wave spectral index between (valid for optically thin free-free emission) and (free-free emission from a wind or jet with a density structure), which includes the values measured for nearly all the more massive YSOs (Shirley et al., 2007).
Fig. 4 shows that the radio emission of the 2M0444 disk lies on the relation inferred by Shirley et al. (2007) for YSOs. Simultaneous observations at longer wavelengths are necessary to confirm that the 1.36 cm excess emission is indeed due to free-free emission, rather than, e.g., synchrotron emission from electrons accelerated by the sub-stellar magnetic field. If so, the fact that 2M0444 lies so close to the relation derived for more massive young stars would be a further indication in favor of the scale down stellar-like scenario for the formation of this brown dwarf. Furthermore, being the inferred radio luminosity for 2M0444 almost an order of magnitude higher than for the only other Class II BD disk detected at cm wavelengths, FU Tau A, our observations show that young brown dwarfs can be very active also at this early stage of their evolution.
5. Conclusions
We presented new VLA observations for the dust continuum emission at 6.8, 9.1 mm and 1.36 cm for the young brown dwarf 2M0444. The main results are as follows.
-
•
Dust thermal emission from the 2M0444 disk was detected at 6.8 and 9.1 mm, representing the first detection of dust emission from a young BD disk at these long wavelengths. The low value of the spectral index, , indicates that particles even larger than those invoked by the results of previous ALMA observations (Ricci et al., 2014) are present in the outer regions of the 2M0444 disk;
-
•
The disk sub-mm/mm SED shows a steepening at longer wavelengths. This feature of the SED can be explained solely by the steepening of the Planck function at long wavelengths for dust thermal emission at temperatures K, in line with the disk model proposed by Ricci et al. (2014). However, the predictions of dust models suggest that some contribution is likely also due to a steepening of the spectral index of the dust opacity at wavelengths longer than mm;
-
•
Models of dust evolution show that the radial drift mechanism affecting solids in a gaseous environment has to be either completely made inefficient, or significantly slowed down by strong gas pressure bumps in order to explain the presence of mm/cm-sized grains in the outer regions of the 2M0444 disk. If this is done by radial gas pressure bumps, the amplitude of the bumps relative to the unperturbed gas structure has to be of at least . The same models show also that the fragmentation barrier lies above sizes of mm in the outer disk regions;
-
•
The flux measured at 1.36 cm is dominated by ionized gas emission. The inferred radio luminosity for this emission is in line with the relation between radio and bolometric luminosity valid for YSOs (Shirley et al., 2007), and extrapolated down to the very low luminosity of the 2M0444 brown dwarf.
Future observations at high angular resolution () at sub-mm and mm wavelengths with ALMA and the VLA will allow an in-depth investigation of the spatial distribution of the mm/cm-sized particles in the 2M0444 disk. In the case of the model with radial pressure bumps presented in Section 4.2 (Fig. 3, bottom right panel), annular rings would have radial separations au, or at the distance of 2M0444, in the disk outer regions.
Finally, follow-up multi-epoch observations at wavelengths longer than 1.36 cm will constrain the spectral index of the cm-wave emission as well as its time variability, and determine its physical nature. According to the models by Reiners & Christensen (2010), magnetic fields kG are expected for brown dwarfs with the mass and age of 2M0444. This level of magnetic field can be detected via modeling of the profile of spectral lines in high resolution spectra at NIR wavelengths (e.g., Reiners et al., 2009).
Given the low luminosity of brown dwarfs, heating in the outer regions of their disks can be dominated by the diffuse radiation field from the interstellar medium (ISM), rather than by the radiation from the brown dwarf itself. In this Appendix we present a physical model that attempts to quantify the impact of this external heating in the case of the 2M0444 disk, for different values of the interstellar radiation flux.
For this calculation, we use the radiative transfer and ray tracing modules of the DALI code (Bruderer et al., 2012, 2013). For the surface density we consider two different parametrizations, both consistent with the CARMA and ALMA interferometric visibilities of the 2M0444 disk (Ricci et al., 2013; Testi et al., 2014). The first one is the power-law model described in Section 4.2, i.e. a surface density radial profile with an exponent , truncated at an outer radius of 139 au, and with a total disk mass (gasdust) of 1.3 (gas-to-dust mass ratio of 100).
The second parametrization is the self-similar radial profile (Pringle, 1981):
| (1) |
For both parametrizations, at any given radius the total dust density is divided into two populations of dust particles with the same radial dependence, , but different grain sizes and vertical distributions to account for the vertical settling mechanism. Following (Testi et al., 2014), we adopt values of , au. For our reference model, the mass ratio between the two populations is set to , i.e. at any location in the disk of the dust mass is in the large population. The small population is made of particles with sizes ranging between and m, whereas the large one of particles with sizes ranging between m and mm. Both the populations assume a slope of for the grain size distribution, , similar to the value constrained for the ISM (Mathis et al., 1977).
The density structure of the small grains assumes hydrostatic equilibrium and vertical isothermality, leading to:
| (2) |
where is the scale-height of the disk. As for the large grains, we account for vertical settling reducing the scale-height of the second population by a factor :
| (3) |
The scale-height of the disk scales as , with at , as derived by Ricci et al. (2014) under the assumption of vertical hydrostatic equilibrium and after subtracting the spatially constant term (see Section 4 in Ricci et al., 2014). The 2D spatial grid consists of 150 grid points in the radial direction, logarithmically sampled between AU and AU, and of 80 grid points in the vertical direction, sampled linearly between the disk mid-plane and 8 scale-heights above it.
The dust opacities of the two populations are computed using a standard ISM dust composition following Weingartner & Draine (2001). The mass extinction coefficients are calculated using Mie theory with the miex code (Wolf & Voshchinnikov, 2004) and optical constants by Draine (2003) for graphite and Weingartner & Draine (2001) for silicates. The input sub-stellar spectrum is set by the observed stellar properties, in particular effective temperature, luminosity (see Section 1) and mass accretion rate ( yr-1, Herczeg & Hillenbrand, 2008), as constrained for the 2M0444 brown dwarf.
The external UV field is presented in units of , where erg s-1 cm-2 is the average UV interstellar radiation field between and (Draine, 1978). In star forming regions, the environmental UV field can range between a few in low mass regions, up to in the proximity of O stars in massive clusters as in the Orion Nebula Cluster (e.g. Fatuzzo & Adams, 2008). As an example for low mass forming regions, Cleeves et al. (2016) estimated an external field of from thermo-chemical models of gas observations in IM Lup, then corroborated by hydro-dynamical models of external photoevaporation (Haworth et al., 2017).
The number of photon packages used in the radiative transfer is both for the photons from the central star and for the photons from the environment, which are emitted from a virtual sphere.
Figure 5 shows the radial profiles of the dust temperature in the disk midplane for different values of the flux of the external UV field (lines with different colors). Deviations in the temperature profiles for the power-law (solid lines) and self-similar (dotted) models are confined to K at the same radius. The temperature profiles obtained for low-to-moderate values of resemble very closely the temperature profile from the Ricci et al. (2014) model for 2M0444. Only for stronger UV fields, with , the dust temperature shows an inverted trend: the temperature rises further from the central object because of the dominant heating from the external radiation field.
In this plot we also test the variation of temperature with the dust opacity. We do this by considering a disk with the same structure as described above, but with different dust opacities obtained by a rather extreme choice of a top-heavy grain size distribution, with a slope and a ratio . Compared with the reference model, the temperature is lower by just a couple of degrees, and remains always above 8 K even with a very low flux of for the external UV field.
References
- Alves de Oliveira et al. (2013) Alves de Oliveira, C., Abraham, P., Marton, G., Pinte, C., Kiss, Cs., Kun, M., Kospal, A., Andre, P., & Konyves, V. 2013, A&A 559,126
- Andre et al. (1999) Andre, P., Motte, F., & Bacmann, A. 1999, ApJL 513, 57
- Andrews (2015) Andrews, S. M. 2015, PASP in print, (preprint arXiv:1507.04758)
- Andrews et al. (2013) Andrews, S. M., Rosenfeld, K. A., Kraus, A. L., & Wilner, D. J. 2013, ApJ 771, 129
- Anglada (1995) Anglada, G. 1995, RMxAC 1, 67
- Baraffe et al. (2003) Baraffe, I., Chabrier, G., Barman, T. S., Allard, F., & Hauschildt, P. H. 2003, A&A 402, 701
- Birnstiel et al. (2012) Birnstiel, T., Klahr, H., & Ercolano, B. 2012, A&A 539, 148
- Birnstiel et al. (2010) Birnstiel, T., Dullemond C. P., & Brauer, F. 2010, A&A 513, 79
- Blum & Wurm (2008) Blum J., & Wurm, G. 2008, ARA&A 46, 21
- Bouy et al. (2008) Bouy, H., Huélamo, N., Pinte, C., Olofsson, J., Barrado Y Navascués, D., Mart n, E. L., Pantin, E., & Monin, J.-L. et al. 2008, A&A 486, 877
- Bruderer et al. (2013) Bruderer, S. 2013, A&A 559, 46
- Bruderer et al. (2012) Bruderer, S., van Dishoeck, E. F., Doty, S. D., & Herczeg, G. J. 2012, A&A 541, 91
- Cleeves et al. (2016) Cleeves, L. I., Oberg, K. I., Wilner, D. J., Huang, J., Loomis, R. A., Andrews, S. M., & Czekala, I. 2016, ApJ 832, 110
- Curiel et al. (1989) Curiel, S., Rodriguez, L. F., Bohigas, J., Roth, M., Canto, J., & Torrelles, J. M. 1989, ApL&C 27, 299
- Curiel et al. (1987) Curiel, S., Canto, J., & Rodriguez, L. F. 1987, RMxAA 14, 595
- Draine (2006) Draine, B. T. 2006, ApJ, 636, 1114
- Draine (2003) Draine, B. T. 2003, ApJ, 598, 1017
- Draine (1978) Draine, B. T. 1978, ApJS 36, 595
- Fatuzzo & Adams (2008) Fatuzzo, M., & Adams, F. C. 2008, ApJ 675, 1361
- Forbrich et al. (2015) Forbrich, J., Rodr guez, L. F., Palau, A., Zapata, L. A., Muzerolle, J., & Gutermuth, R. A. 2015, ApJ 814, 15
- Furlan et al. (2011) Furlan, E., Luhman, K. L., Espaillat, C., & D’Alessio, P. 2011, ApJS 195, 3
- Furuya et al. (2003) Furuya, R. S., Kitamura, Y., Wootten, A., Claussen, M. J., & Kawabe, R. 2003, ApJS 144, 71
- Guieu et al. (2007) Guieu, S., Pinte, C., Monin, J.-L., Ménard, F., Fukagawa, M., Padgett, D. L., Noriega-Crespo, A., Carey, S. J., Rebull, L. M., Huard, T., & Guedel, M. 2007, A&A 465, 855
- Gundlach et al. (2011) Gundlach, B., Kilias, S., Beitz, E., & Blum, J. 2011, Icarus 214, 717
- Hartmann et al. (2005) Hartmann, L., Megeath, S. T., Allen, L., Luhman, K., Calvet, N., D’Alessio, P., Franco-Hernandez, R., & Fazio, G. 2005, ApJ 629, 881
- Harvey et al. (2012) Harvey, P. M., Henning, Th., Liu, Y., Ménard, F., Pinte, C., Wolf, S., Cieza, L. A., Evans, N. J., II, & Pascucci, I. 2012, ApJ 755, 67
- Haworth et al. (2017) Haworth, T. J., Facchini, S., Clarke, C. J., & Cleeves, L. I. 2017, MNRAS 468, 108
- Herczeg & Hillenbrand (2008) Herczeg, G. J., & Hillenbrand, L. A. 2008, ApJ 681, 594
- Hsieh et al. (2016) Hsieh, T.-H., Lai, S.-P., Belloche, A., & Wyrowski, F. 2016, ApJ 826, 68
- Johansen et al. (2014) Johansen A., Blum J., Tanaka H., Ormel C., Bizzarro, M., & Rickman, H. 2014, Protostars and Planets VI, 547
- Johansen et al. (2009) Johansen, A., Youdin, A., & Klahr, H. 2009, ApJ 697, 1269
- Kenyon et al. (1994) Kenyon, S. J., Gomez, M., Marzke, R. O., & Hartmann, L. 1994, AJ 108, 251
- Klein et al. (2003) Klein, R., Apai, D., Pascucci, I., Henning, Th., & Waters, L. B. F. M. 2003, ApJ 593, 57
- Loinard et al. (2007) Loinard, L., Torres, R. M., Mioduszewski, A. J., Rodrguez, L. F., et al. 2007, ApJ 671, 546
- Luhman et al. (2006) Luhman, K. L., Whitney, B. A., Meade, M. R., Babler, B. L., Indebetouw, R., Bracker, S., & Churchwell, E. B. 2006, AJ 647, 1180
- Luhman (2004) Luhman, K. L. 2004, ApJ 617, 1216
- Mathis et al. (1977) Mathis, J. S., Rumpl, W., & Nordsieck, K. H. 1977, ApJ 217, 425
- McMullin et al. (2007) McMullin, J. P., Waters, B., Schiebel, D., & Young, W., Golap, K. 2007, ASPC 376, 127
- Meru et al. (2013) Meru, F., Galvagni, M., & Olczak, C. 2013, ApJL 774, 4
- Miyake & Nakagawa (1993) Miyake, K., & Nakagawa, Y. 1993, Icarus 106, 20
- Morata et al. (2015) Morata, O., Palau, A., Gonz lez, R. F., de Gregorio-Monsalvo, I., Ribas, ., Perger, M., Bouy, H. et al. 2015, ApJ 807, 55
- Mordasini et al. (2010) Mordasini, C., Klahr, H., Alibert, Y., Benz, W., & Dittkrist, K.-M. 2010, arXiv:1012.5281
- Morrow et al. (2008) Morrow, A. L., Luhman, K. L., Espaillat, C., D’Alessio, P., et al. 2008, ApJ 676, 143
- Natta & Testi (2001) Natta, A., & Testi, L. 2001, A&A 376, L22
- Palau et al. (2014) Palau, A., Zapata, L. A., & Rodr guez, L. F., et al. 2014, MNRAS 444, 833
- Panagia & Felli (1975) Panagia, N., & Felli, M. 1975, A&A 39, 1
- Pascucci et al. (2014) Pascucci, I., Ricci, L., Gorti, U., Hollenbach, D., Hendler, N., Brooks, K., & Contreras, Y. 2014, ApJ 795, 1
- Payne & Lodato (2007) Payne, M. J., & Lodato, G. 2007, MNRAS 381, 1597
- Pinilla et al. (2013) Pinilla, P., Birnstiel, T., Benisty, M., Ricci, L., Natta, A., Dullemond, C. P., Dominik, C., & Testi, L. 2013, A&A 554, 95
- Pinilla et al. (2012a) Pinilla, P., Birnstiel, T., Ricci, L., Dullemond, C. P., Uribe, A. L., Testi, L., & Natta, A. 2012a, A&A 538, 114
- Pinilla et al. (2012b) Pinilla, P., & Benisty, M., Birnstiel, T. 2012b, A&A 545, 81
- Pringle (1981) Pringle, J. E. 1981, ARA&A 19, 137
- Reiners & Christensen (2010) Reiners, A., & Christensen, U. R. 2010, A&A 522, 13
- Reiners et al. (2009) Reiners, A., Basri, G., & Christensen, U. R. 2009, ApJ 697, 373
- Reynolds (1986) Reynolds, S. P. 1986, ApJ, 304, 713
- Ricci et al. (2017) Ricci, L., Cazzoletti, P., Czekala, I., Andrews, S., Wilner, D., Szucs, L., Lodato, G., Testi, L., Pascucci, I., Mohanty, S., Apai, D., Carpenter, J., & Bowler, B. 2017, AJ in press, arXiv:1706.03708
- Ricci et al. (2014) Ricci, L., Testi, L., Natta, A., Scholz, A., de Gregorio-Monsalvo, I., & Isella, A. 2014, ApJ 791, 20
- Ricci et al. (2013) Ricci, L., Isella, A., Carpenter, J. M., & Testi, L. 2013, ApJ 764L, 27
- Ricci et al. (2012) Ricci, L., Trotta, F., Testi, L., Natta, A., Isella, A. & Wilner, D. J. 2012, A&A 540, 6
- Rodmann et al. (2006) Rodmann, J., Henning, Th., Chandler, C. J., Mundy, L. G., & Wilner, D. J. 2006, A&A 446, 211
- Rodriguez et al. (2017) Rodriguez, L., Zapata, L., & Palau, A. 2017, ApJ 153, 209
- Scholz et al. (2006) Scholz, A., Jayawardhana, R. & Wood, K. 2006, ApJ 645, 1498
- Shirley et al. (2007) Shirley, Y. L., Claussen, M. J., Bourke, T. L., Young, C. H., & Blake, G. A. 2007, ApJ 667, 329
- Stelzer et al. (2013) Stelzer, B., Alcala, J. M., Scholz, A., Natta, A., Randich, S., & Covino, E. 2013, A&A 551, 106
- Testi et al. (2016) Testi, L., Natta, A., Scholz, A., Tazzari, M., Ricci, L., & de Gregorio-Monsalvo, I. 2016, A&A 593, 111
- Testi et al. (2014) Testi, L., Birnstiel, T., Ricci, L., Andrews, S., Blum, J., Carpenter, J., Dominik, C., Isella, A., Natta, A., Williams, J., & Wilner, D. , 2014 in Protostars & Planets VI, eds. H. Beuther, R. Klessen, C. Dullemond, & Th. Henning (Univ. Arizona Press: Tucson), in press; arXiv:1402.1354
- Testi et al. (2003) Testi, L., Natta, A., Shepherd, D. S., & Wilner, D. J. 2003, A&A 403, 323
- Torres et al. (2012) Torres, R. M., Loinard, L., Mioduszewski, A. J., Boden, A. F., Franco-Hernandez, R., Vlemmings, W. H. T., & Rodriguez, L. F. 2012, ApJ 747, 18
- Torres et al. (2009) Torres, R. M., Loinard, L., Mioduszewski, A. J., & Rodriguez, L. F. 2009, ApJ 698, 242
- Ubach et al. (2017) Ubach, C., Maddison, S., Wright, C., Wilner, D., Lommen, D., & Koribalski, B. 2017, MNRAS 466, 4083
- Ubach et al. (2012) Ubach, C., Maddison, S., Wright, C., Wilner, D., Lommen, D., & Koribalski, B. 2012, MNRAS 425, 3137
- Uribe et al. (2011) Uribe, A. L., Klahr, H., Flock, M., & Henning, T. 2011, ApJ 736, 85
- van der Plas et al. (2016) van der Plas, G., Menard, F., Ward-Duong, K., et al. 2016, ApJ 819, 102
- Weidenschilling (1977) Weidenschilling, S. J. 1977, MNRAS 180, 57
- Weingartner & Draine (2001) Weingartner, J. C., & Draine, B. T. 2001, ApJ 548, 296
- Wolf & Voshchinnikov (2004) Wolf, S., & Voshchinnikov, N. V. 2004, Computer Physics Communications, 162, 113
- Wright & Barlow (1975) Wright, A. E., & Barlow, M. J. 1975, MNRAS, 170, 41