The s-Channel Single Top Quark Production as a Constraint for Boson Contribution
1,† and 2,3,‡
1, , ,
2
3
†syaser.ayazi@semnan.ac.ir; ‡paktinat@ipm.ir
Abstract
An analysis is performed to constrain the boson production using the measurement of the s-channel single top quark production cross section. Both phenomenological and statistical approaches are examined and results are presented. In the best case, bosons that interact only to the right-handed fermions are excluded below 1390 GeV. To our knowledge, it is the first time that the measured cross section of the s-channel single top quark production from the colliders is used to rule out part of the phase space of the boson.
I Introduction
The existence of a new massive charged gauge boson, known as boson, is proposed by many new physics scenarios. The minimal extension of the Standard Model (SM) gauge group incorporating is known as (G(221)) models Hsieh et al. (2010). The Kaluza-Klein excitations of the SM boson in extra dimension models is another famous example Burdman et al. (2006). In this paper, a general description of this new massive charged particle interactions is considered, without constraining the couplings to a special model.
The general Lagrangian describing the fermionic interactions of boson can be written as:
| (1) |
As for the notations, we follow the definitions of the Ref. Sullivan (2002) and Duffty and Sullivan (2012) with small modifications, where is a identity matrix for leptons or the CKM matrix for quarks, is the SM weak coupling constant and are the strengths of the right and left couplings. Through this work, are assumed to be real values.
There have been many direct searches for in the high energy particle colliders, but up to now, all of them have failed. The searches include the fully left-handed ( = 0) when is not constrained or when = 1, known as the Sequential SM (SSM) Altarelli et al. (1989). The CMS experiment at the CERN LHC Chatrchyan et al. (2008) has excluded the SSM with masses below 4.1 TeV Khachatryan et al. (2017a) at 95% confidence level (CL) by looking at the tail of the transverse mass distribution of a lepton which comes from the decay of a associated with missing transverse energy coming from a neutrino. The search uses 2.3 fb-1 of proton-proton (pp) collisions in the center of mass energy of 13 TeV. The ATLAS experiment Aad et al. (2008) in a similar search uses 36.1 fb-1 of data and rules out the SSM below 5.1 TeV Aaboud et al. (2017). Another class of the searches, consider the fully right-handed ( = 0), where decay to leptons are either closed or highly suppressed due to introduction of heavy right-handed neutrinos Khachatryan et al. (2017b); Aad et al. (2015). Search for decay of to light jets suffers from the high level of the QCD multijets backgrounds, but if is heavier than 180 GeV, it can decay to a pair of top and bottom quarks (tb = t or b) which has a distinguished signature due to the possibility of tagging the jets originating from the b quarks. Both CMS and ATLAS experiments have looked at this final state in different center-of-mass energies. The most recent result from the ATLAS experiment is for = 8 TeV that excludes the with masses below 1.92 TeV in 95% CL Aad et al. (2015). The CMS experiment rules out the right-handed lighter than 2.6 TeV Sirunyan et al. (2017), by using up to 2.6 fb-1 of 13 TeV data, in the same channel. The previous limit from the CMS experiment, in this channel, was 2.15 TeV based on 19.7 fb-1 of 8 TeV data Khachatryan et al. (2016a).
When decays to tb, the final state is very similar to the final state of the s-channel single top production, where boson is the off-shell mediator to produce top and bottom quarks. If exists, it can affect the cross section of the SM s-channel single top production, so measuring this cross section can constrain the contribution. The contribution of boson to s-channel single top production is discussed in some other papers also Boos et al. (2007); Drueke et al. (2015); Tait and Yuan (2000); Yaser Ayazi and Mohammadi Najafabadi (2011), but it is the first time that the measured cross section of s-channel single top is used to constrain the contribution.
The s-channel production of the single top quark was first observed at the Tevatron experiments in = 1.96 TeV with the statistical significance of 6.3 standard deviations () Aaltonen et al. (2014), but the most accurate measurement of the cross section of this process is done by the ATLAS experiment Aad et al. (2016). The measured cross section is with a signal significance of 3.2 in 20.3 fb-1 of the data in = 8 TeV.
It is shown Boos et al. (2007) that only the left-handed can interfere with the SM boson contribution and its effect on the total cross section is not too large, although the shape of the partial cross sections can be changed dramatically. The right-handed does not have any interference, because the interactions of the SM boson are only left () type.
In the next section, the phenomenology of the boson is reviewed shortly and the measured cross section of the s-channel production of the single top quark is used to constrain the contribution. In continue, the raw data reported by the LHC experiments are used to constrain the contribution by a statistical method.
II boson Phenomenology
In this section, we study the effects of boson on the cross section of single top production and discuss the possibility of detecting boson at LHC. As it is mentioned in the previous section, in order to calculate the cross section of , we consider the most general effective Lagrangian describing the interaction with the SM fermions. The cross section of is given by:
| (2) |
where and are the parton distribution functions of quarks. and are the parton momentum fractions. The partonic cross section takes the form Boos et al. (2007):
| (3) | |||
where is the width of boson, and is the parton center of mass energy while is the center of mass energy. Width of the is given in Boos et al. (2007).
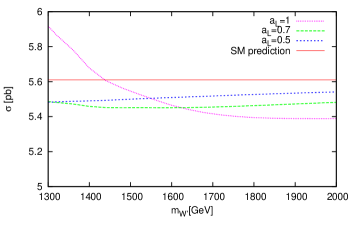
As it is mentioned, the most precise measurement of single top production has been achieved by the ATLAS collaboration Aad et al. (2016). In Fig. 1-a, we display the total cross section of versus for several values of while . To calculate , we have used the CTEQ6.6M parton distribution function Lai et al. (2010). We have set and a SM cross section of for the was considered Aad et al. (2016). The horizontal line depicts SM prediction for this process. The shadow cyan area shows the allowed bound which is consistent with the ATLAS measurement. As it is seen in Eq. 3, for and non-zero , effect of exchange can be destructive. To better show this effect, we zoom in the high mass region, where this effect can be important. In Fig. 1-a,
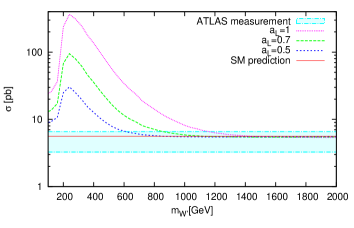
(a) (b)
there exists a peak at areas which square of center of mass energy is close to the squared total mass of top and bottom quarks.
In Fig. 2,
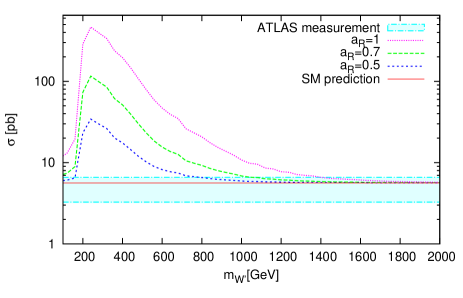
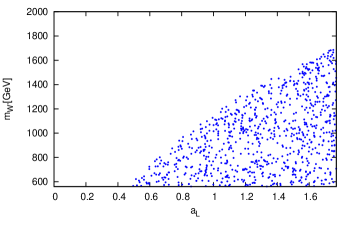
we have shown the effect of exchange for and non-zero on single top quark production. As it is expected, with increasing , deviation from SM cross section decreases. Figure 1 (2) shows that the effect of presence of for () can be larger than the ATLAS measurement. This means left-handed (right-handed) have been excluded for (). Figure 3 demonstrates this effect in the parameter space.
(a) (b)
III Statistical Analysis
In this study, we use the reported event yields by the experiments in search for s-channel single top production and find the upper limit on the contribution of the boson. In this part, the interference is neglected even for the left-handed boson. The data used in this study include the following categories:
- CMS 7 TeV
-
The search by the CMS experiment for the s-channel single top production in the events containing one isolated muon in data from the pp collisions at = 7 TeV Khachatryan et al. (2016b).
- CMS 8 TeV
-
The same search in data from the pp collisions at = 8 TeV.
- CMS electron 8 TeV
-
The same search when the isolated lepton is an electron.
- ATLAS 8 TeV
-
The search by the ATLAS experiment for the s-channel single top production in the events containing one isolated electron or muon Aad et al. (2016). The ATLAS experiment has provided the numbers only for the sum of electron and muon in pp collisions at = 8 TeV.
More data is available Abazov et al. (2013); Aaltonen et al. (2015); Aad et al. (2011, ATLAS-CONF-2011-118), but it was tested and confirmed that adding them can not improve the results. It is also checked that the used categories of data are important and removing any of them can decrease the exclusion power. Table 1
| Center of mass energy | 7 TeV | 8 TeV | ||
|---|---|---|---|---|
| Category | CMS | CMS | CMS electron | ATLAS |
| Single top s-channel | 129 5 | 452 16 | 347 12 | 540 160 |
| SM Backgrounds | 1920 110 | 7060 370 | 6240 320 | 14670 180 |
| Observed data | 1883 | 7023 | 6301 | 14677 |
summarizes the data used for this analysis. The quadratic sum of the statistical and systematic uncertainties are reported as the total uncertainty. The main part of the systematic uncertainty comes from the uncertainty on the jet energy scale.
For statistical calculations, the tools provided by the ROOT Brun and Rademakers (1997) data analysis framework are used. The efficiency of event reconstruction and selection for the events from contribution is assumed to be the same as the efficiency of the s-channel events. The SM cross section of the s-channel single top production in different data categories is taken from the corresponding analysis. The cross section of production with final state can be found in Ref.Duffty and Sullivan (2012). The cross sections are provided up to next-to-leading order (NLO) of QCD precision. The relative uncertainty of the signal yield is assumed to be 30% for all categories which is a conservative value. Trying other values like 20 or 40% do not affect the final exclusions.
Figure 4 (left)
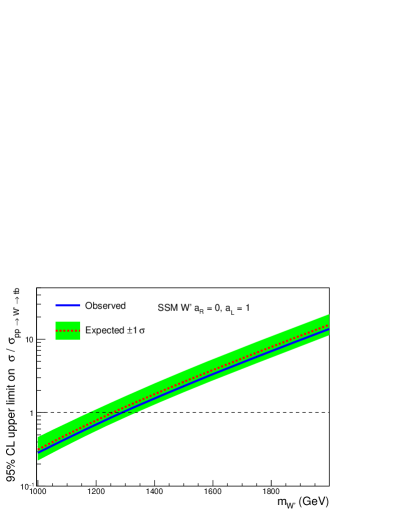
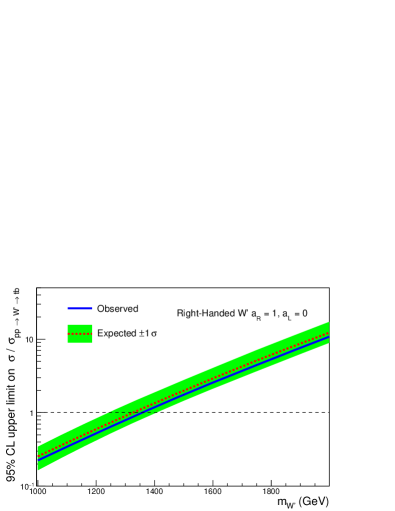
shows the 95% CL upper limit on the contribution of the to the production cross section of the s-channel single top quark, when the is fully left-handed with the couplings similar to those of the SM W boson. It can be seen that boson with masses below 1290 GeV are excluded by the data. The expected value of the exclusion is 1255 GeV. The of the expected limits are shown as a green band. In Fig. 4 (right), the same information is presented for the fully right-handed boson, where the new boson does not couple to leptons. The expected (observed) limit on the mass of in this model is 1325 (1360) GeV. The results can be compared to the CMS limits based on 8 TeV data in the similar final state which is 2.15 TeV Khachatryan et al. (2016a).
In Fig. 5,
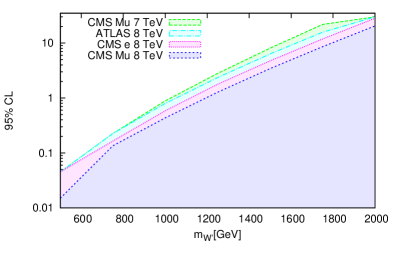
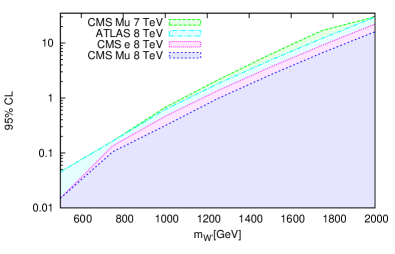
the observed 95% CL upper limit is shown for different categories of data, separately. Although the ATLAS result is the most precise measurement for the s-channel single top production, but the main power for exclusions comes from ”CMS 8 TeV”. For the SSM , using this category alone can rule out the lighter than 1180 GeV. The power of the CMS results come from the detailed values for different channels, but the ATLAS experiment has reported only the sum of the yields of the electron and muon channels. In table 2
| Left-handed | Right-handed | |||
|---|---|---|---|---|
| dataset | Expected | Observed | Expected | Observed |
| CMS 7 TeV | 1000 | 1020 | 1050 | 1070 |
| CMS 8 TeV | 1150 | 1180 | 1220 | 1250 |
| CMS electron 8 TeV | 1090 | 1110 | 1160 | 1170 |
| ATLAS 8 TeV | 1045 | 1045 | 1110 | 1120 |
the expected and observed limits are shown for different categories of data, in pure left-handed or right-handed scenario. The data from pp collisions at = 7 TeV give the worst limit and data from 8 TeV collisions have improved the limits significantly. One can hope that when the data from pp collisions at = 13 TeV are available, the limits can be improved even more, keeping in mind that the volume of the new data is much more than the previous data also.
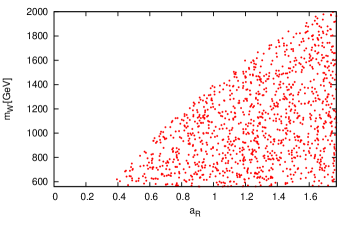
The same analysis can set limits on the coupling versus mass. In this part also, is either fully right-handed or fully left-handed and the mixture is not allowed. Figure 6
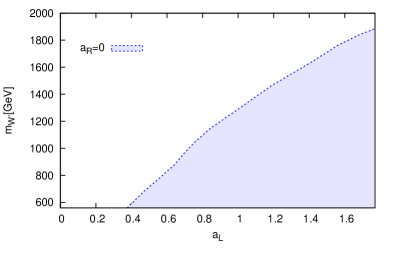
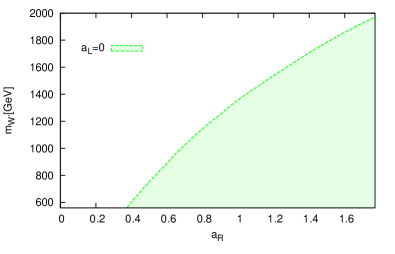
shows the region in the mass versus the coupling that can be excluded in 95% CL. It can be seen that varying the () from 0.4 to 1.8 can exclude the mass between 600 and 1900 (2000) GeV. The main assumption here is the () nature of and couplings are free to change. The figure can be compared to Fig. 3, where the scattered points show the part of the phase space that produce the cross sections inconsistent with the measured cross section of the s-channel single top production from the ATLAS experiment.
IV Conclusion
The heavy partner of boson, known as boson, can contribute to s-channel production of the single top quark. In this analysis, for the first time, the measured cross section of the s-channel single top quark is used to constrain the contribution of boson. In a phenomenological approach, the part of the parameter space which is excluded by the measurement of the cross section is found. In an alternative approach, the reported yields from the experiments used to measure the cross section are statistically analyzed to set the upper limit on the yields of the boson events. The latter analysis rules out the right-handed boson with masses below 1.36 TeV, while the former can push the limit up to 1.39 TeV. The limits for a left-handed boson are 1.16 TeV and 1.29 TeV from the phenomenological and statistical analysis, respectively. In both approaches, the excluded region in the plane of the coupling versus the boson mass is reported.
V Acknowledgment
The authors would like to thank the school of particles and accelerators at IPM for their hospitality.
References
- Hsieh et al. (2010) K. Hsieh, K. Schmitz, J.-H. Yu, and C. P. Yuan, Phys. Rev. D82, 035011 (2010), eprint 1003.3482.
- Burdman et al. (2006) G. Burdman, B. A. Dobrescu, and E. Ponton, Phys. Rev. D74, 075008 (2006), eprint hep-ph/0601186.
- Sullivan (2002) Z. Sullivan, Phys. Rev. D66, 075011 (2002), eprint hep-ph/0207290.
- Duffty and Sullivan (2012) D. Duffty and Z. Sullivan, Phys. Rev. D86, 075018 (2012), eprint 1208.4858.
- Altarelli et al. (1989) G. Altarelli, B. Mele, and M. Ruiz-Altaba, Z. Phys. C45, 109 (1989), [Erratum: Z. Phys.C47,676(1990)].
- Chatrchyan et al. (2008) S. Chatrchyan et al. (CMS), JINST 3, S08004 (2008).
- Khachatryan et al. (2017a) V. Khachatryan et al. (CMS), Phys. Lett. B770, 278 (2017a), eprint 1612.09274.
- Aad et al. (2008) G. Aad et al. (ATLAS), JINST 3, S08003 (2008).
- Aaboud et al. (2017) M. Aaboud et al. (ATLAS) (2017), eprint 1706.04786.
- Khachatryan et al. (2017b) V. Khachatryan et al. (CMS), JHEP 03, 077 (2017b), eprint 1612.01190.
- Aad et al. (2015) G. Aad et al. (ATLAS), Phys. Lett. B743, 235 (2015), eprint 1410.4103.
- Sirunyan et al. (2017) A. M. Sirunyan et al. (CMS) (2017), eprint 1706.04260.
- Khachatryan et al. (2016a) V. Khachatryan et al. (CMS), JHEP 02, 122 (2016a), eprint 1509.06051.
- Boos et al. (2007) E. Boos, V. Bunichev, L. Dudko, and M. Perfilov, Phys. Lett. B655, 245 (2007), eprint hep-ph/0610080.
- Drueke et al. (2015) E. Drueke, J. Nutter, R. Schwienhorst, N. Vignaroli, D. G. E. Walker, and J.-H. Yu, Phys. Rev. D91, 054020 (2015), eprint 1409.7607.
- Tait and Yuan (2000) T. M. P. Tait and C. P. Yuan, Phys. Rev. D63, 014018 (2000), eprint hep-ph/0007298.
- Yaser Ayazi and Mohammadi Najafabadi (2011) S. Yaser Ayazi and M. Mohammadi Najafabadi, J. Phys. G38, 085002 (2011), eprint 1006.2647.
- Aaltonen et al. (2014) T. A. Aaltonen et al. (CDF, D0), Phys. Rev. Lett. 112, 231803 (2014), eprint 1402.5126.
- Aad et al. (2016) G. Aad et al. (ATLAS), Phys. Lett. B756, 228 (2016), eprint 1511.05980.
- Lai et al. (2010) H.-L. Lai, J. Huston, Z. Li, P. Nadolsky, J. Pumplin, D. Stump, and C. P. Yuan, Phys. Rev. D82, 054021 (2010), eprint 1004.4624.
- Khachatryan et al. (2016b) V. Khachatryan et al. (CMS), JHEP 09, 027 (2016b), eprint 1603.02555.
- Abazov et al. (2013) V. M. Abazov et al. (D0), Phys. Lett. B726, 656 (2013), eprint 1307.0731.
- Aaltonen et al. (2015) T. A. Aaltonen et al. (CDF), Phys. Rev. Lett. 115, 061801 (2015), eprint 1504.01536.
- Aad et al. (2011, ATLAS-CONF-2011-118) G. Aad et al. (ATLAS) (2011, ATLAS-CONF-2011-118).
- Brun and Rademakers (1997) R. Brun and F. Rademakers, Nucl. Instrum. Meth. A389, 81 (1997).