∎
44email: ppadovan@eso.org 55institutetext: D. M. Alexander 66institutetext: Centre for Extragalactic Astronomy, Department of Physics, Durham University, UK 77institutetext: R. J. Assef 88institutetext: Núcleo de Astronomía de la Facultad de Ingeniería, Universidad Diego Portales, Santiago, Chile 99institutetext: B. De Marco 1010institutetext: Max Planck Institute for extraterrestrial Physics, Garching bei München, Germany 1111institutetext: Nicolaus Copernicus Astronomical Center, PL-00-716 Warsaw, Poland (current address) 1212institutetext: P. Giommi 1313institutetext: Italian Space Agency, ASI, via del Politecnico snc, 00133 Roma, Italy 1414institutetext: R. C. Hickox 1515institutetext: Department of Physics & Astronomy, Dartmouth College, Hanover, NH, USA 1616institutetext: G. T. Richards 1717institutetext: Dept. of Physics, Drexel University, Philadelphia, PA, USA 1818institutetext: M. Salvato 1919institutetext: Max Planck Institute for extraterrestrial Physics, Garching bei München, Germany 2020institutetext: V. Smolčić 2121institutetext: Department of Physics, Faculty of Science, University of Zagreb, Bijenička cesta 32, 10000 Zagreb, Croatia
Active Galactic Nuclei: what’s in a name?
Abstract
Active Galactic Nuclei (AGN) are energetic astrophysical sources powered by accretion onto supermassive black holes in galaxies, and present unique observational signatures that cover the full electromagnetic spectrum over more than twenty orders of magnitude in frequency. The rich phenomenology of AGN has resulted in a large number of different “flavours” in the literature that now comprise a complex and confusing AGN “zoo”. It is increasingly clear that these classifications are only partially related to intrinsic differences between AGN, and primarily reflect variations in a relatively small number of astrophysical parameters as well the method by which each class of AGN is selected. Taken together, observations in different electromagnetic bands as well as variations over time provide complementary windows on the physics of different sub-structures in the AGN. In this review, we present an overview of AGN multi-wavelength properties with the aim of painting their “big picture” through observations in each electromagnetic band from radio to -rays as well as AGN variability. We address what we can learn from each observational method, the impact of selection effects, the physics behind the emission at each wavelength, and the potential for future studies. To conclude we use these observations to piece together the basic architecture of AGN, discuss our current understanding of unification models, and highlight some open questions that present opportunities for future observational and theoretical progress.
Keywords:
Galaxies: active Quasars: supermassive black holes Radio continuum: galaxies Infrared: galaxies X-rays: galaxies gamma-rays: galaxies1 The Active Galactic Nuclei zoo
The discovery of quasars (Schmidt, 1963) opened up a whole new branch of astronomy (e.g. D’Onofrio, Marziani, & Sulentic, 2012; Kellermann, 2015, for historical details). Twenty years earlier Seyfert (1943) had reported the presence of broad and strong emission lines in the nuclei of six spiral nebulae (including some by now “classical” AGN, like NGC 1068 and NGC 4151). However, his work remained largely ignored until Baade & Minkowski (1954) pointed out the similarities between the spectra of the galaxies studied by Seyfert and that of the galaxy they had associated with the Cygnus A radio source.
As implicit in the name, AGN are stronger emitters than the nuclei of “normal” galaxies. This “extra” component is unrelated to the nuclear fusion powering stars and is now universally accepted to be connected instead to the presence of an actively accreting central supermassive () black hole (SMBH).
AGN have many interesting properties. These include: (1) very high luminosities (up to erg s-1), which make them the most powerful non-explosive sources in the Universe and therefore visible up to very high redshifts (currently : Mortlock et al., 2011); (2) small emitting regions in most bands, of the order of a milliparsec, as inferred from their rapid variability (e.g. Ulrich, Maraschi, & Urry, 1997), implying high energy densities; (3) strong evolution of their luminosity functions (LFs; e.g. Merloni & Heinz, 2013); (4) detectable emission covering the whole electromagnetic spectrum (this review).
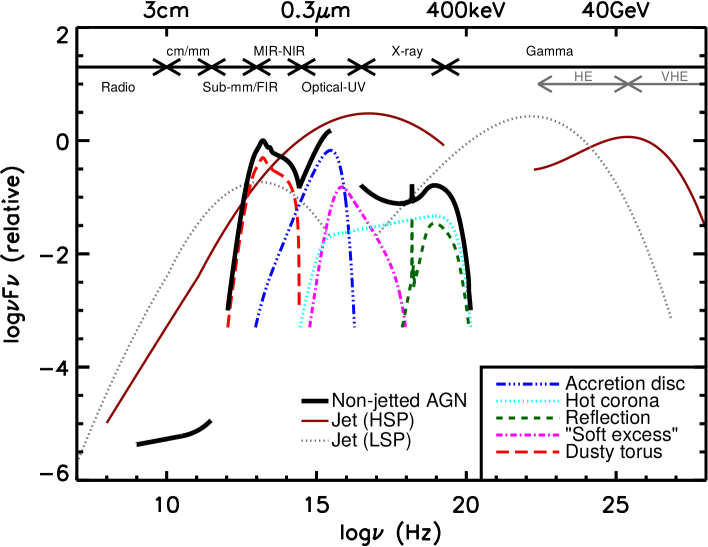
The latter property means that AGN are being discovered in all spectral bands. Different methods are employed in different bands to identify these sources but, most importantly, the various wavelength regimes provide different windows on AGN physics. Namely, the infrared (IR) band is mostly sensitive to obscuring material and dust, the optical/ultraviolet(UV) band is related to emission from the accretion disk, while the X-ray band traces the emission of a (putative) corona. -ray and (high flux density) radio samples, on the other hand, preferentially select AGN emitting strong non-thermal (jet [or associated lobe] related) radiation (see Fig. 1)111The mm/sub–mm band is missing from this paper because it mostly probes molecular gas that resides in the AGN host galaxy. However, with the high resolution capabilities of the Atacama Large Millimeter/submillimeter Array (ALMA) we are starting to resolve the innermost parts of AGN down to parsec scales (Sect. 8.4).. The surface densities of AGN also vary strongly across the electromagnetic spectrum due to a complex mix of physical processes, selection effects, and technological limitations (as shown in Sect. 8).
| Class/Acronym | Meaning | Main properties/reference |
| Quasar | Quasi-stellar radio source (originally) | Radio detection no longer required |
| Sey1 | Seyfert 1 | FWHM km s-1 |
| Sey2 | Seyfert 2 | FWHM km s-1 |
| QSO | Quasi-stellar object | Quasar-like, non-radio source |
| QSO2 | Quasi-stellar object 2 | High power Sey2 |
| RQ AGN | Radio-quiet AGN | see ref. 1 |
| RL AGN | Radio-loud AGN | see ref. 1 |
| Jetted AGN | with strong relativistic jets; see ref. 1 | |
| Non-jetted AGN | without strong relativistic jets; see ref. 1 | |
| Type 1 | Sey1 and quasars | |
| Type 2 | Sey2 and QSO2 | |
| FR I | Fanaroff-Riley class I radio source | radio core-brightened (ref. 2) |
| FR II | Fanaroff-Riley class II radio source | radio edge-brightened (ref. 2) |
| BL Lac | BL Lacertae object | see ref. 3 |
| Blazar | BL Lac and quasar | BL Lacs and FSRQs |
| BAL | Broad absorption line (quasar) | ref. 4 |
| BLO | Broad-line object | FWHM km s-1 |
| BLAGN | Broad-line AGN | FWHM km s-1 |
| BLRG | Broad-line radio galaxy | RL Sey1 |
| CDQ | Core-dominated quasar | RL AGN, (same as FSRQ) |
| CSS | Compact steep spectrum radio source | core dominated, |
| CT | Compton-thick | cm-2 |
| FR 0 | Fanaroff-Riley class 0 radio source | ref. 5 |
| FSRQ | Flat-spectrum radio quasar | RL AGN, |
| GPS | Gigahertz-peaked radio source | see ref. 6 |
| HBL/HSP | High-energy cutoff BL Lac/blazar | Hz (ref. 7) |
| HEG | High-excitation galaxy | ref. 8 |
| HPQ | High polarization quasar | (same as FSRQ) |
| Jet-mode | (same as LERG); see ref. 9 | |
| IBL/ISP | Intermediate-energy cutoff BL Lac/blazar | Hz (ref. 7) |
| LINER | Low-ionization nuclear emission-line regions | see ref. 9 |
| LLAGN | Low-luminosity AGN | see ref. 10 |
| LBL/LSP | Low-energy cutoff BL Lac/blazar | Hz (ref. 7) |
| LDQ | Lobe-dominated quasar | RL AGN, |
| LEG | Low-excitation galaxy | ref. 8 |
| LPQ | Low polarization quasar | |
| NLAGN | Narrow-line AGN | FWHM km s-1 |
| NLRG | Narrow-line radio galaxy | RL Sey2 |
| NLS1 | Narrow-line Seyfert 1 | ref. 11 |
| OVV | Optically violently variable (quasar) | (same as FSRQ) |
| Population A | ref. 12 | |
| Population B | ref. 12 | |
| Radiative-mode | Seyferts and quasars; see ref. 9 | |
| RBL | Radio-selected BL Lac | BL Lac selected in the radio band |
| Sey1.5 | Seyfert 1.5 | ref. 13 |
| Sey1.8 | Seyfert 1.8 | ref. 13 |
| Sey1.9 | Seyfert 1.9 | ref. 13 |
| SSRQ | Steep-spectrum radio quasar | RL AGN, |
| USS | Ultra-steep spectrum source | RL AGN, |
| XBL | X-ray-selected BL Lac | BL Lac selected in the X-ray band |
| XBONG | X-ray bright optically normal galaxy | AGN only in the X-ray band/weak lined AGN |
| The top part of the table relates to major/classical classes. The last column describes the main properties. | ||
| When these are too complex, it gives a reference to the first paper, which defined the relevant class or, when | ||
| preceded by “see”, a recent paper, which gives up-to-date details on it. Reference key: 1. Padovani (2016); | ||
| 2. Fanaroff & Riley (1974); 3. Giommi et al. (2012); 4. Weymann, Carswell, & Smith (1981); | ||
| 5. Ghisellini (2010); 6. O’Dea, Baum, & Stanghellini (1991); 7. Padovani & Giommi (1995); | ||
| 8. Laing et al. (1994); 9. Heckman & Best (2014); 10. Ho (2008); 11. Osterbrock & Pogge (1985); | ||
| 12. Sulentic et al. (2002); 13. Osterbrock (1981) | ||
The past years have seen a proliferation of AGN classes, which outsiders to the field (but insiders as well!) find mesmerising. A (possibly incomplete) list is given in Tab. 1, which gives the class or acronym in col. (1), its meaning in col. (2), and the main properties or a reference to a relevant paper in col. (3).
Reality is much simpler, however, as we know that most of these seemingly different classes are due to changes in only a small number of parameters, namely: orientation (e.g. Antonucci, 1993; Urry & Padovani, 1995; Netzer, 2015), accretion rate (e.g. Heckman & Best, 2014), the presence (or absence) of strong jets (e.g. Padovani, 2016), and possibly the host galaxy and the environment. Sorting out these issues is a pre-requisite to understand AGN physics and the role AGN play in galaxy evolution (e.g. Alexander & Hickox, 2012).
To go beyond taxonomy and paint the AGN “big picture”, which comes out of multi-wavelength surveys, and understand the truly intrinsic and fundamental properties of AGN, the workshop “Active Galactic Nuclei: what’s in a name?” was organised at ESO, Garching, between June 27 and July 1, 2016. This was done by discussing AGN selection and physics in all bands and by addressing:
-
•
the different types of AGN selected in the various spectral bands;
-
•
the similarities and differences they display;
-
•
the impact of selection effects on the interpretation of the results;
-
•
the physical mechanism(s) behind emission in a given band;
-
•
the effective range of black hole (BH) mass () and Eddington ratios222The ratio between the observed luminosity and the Eddington luminosity, erg/s, where is one solar mass. This is the maximum isotropic luminosity a body can achieve when there is balance between radiation pressure (on the electrons) and gravitational force (on the protons). () probed by each selection method;
-
•
the possible limitations of current observations and/or facilities.
The workshop consisted of seven different sessions: radio, IR, optical, X-ray, -ray, variability, and multi-frequency. All of the sessions (with the exception of the multi-frequency one) were introduced by a review talk which set the scene, followed by contributed talks, for a total of eighty-six speakers, of whom were women. Sixty-seven posters completed the programme. A summary talk and a discussion session were held at the end of the workshop333Most presentations and posters can be found at www.eso.org/sci/meetings/2016/AGN2016.html.. The workshop was very well attended, with 165 participants, covering five continents and thirty-one different countries; sixty of the participants were students. This review was inspired by the workshop.
In this paper we review our progress in addressing these key issues by discussing radio-, IR-, optical-, X-ray-, -ray-, and variability-selected AGN (Sect. 2 – 7). Section 8 summarizes our understanding of AGN and examines some open issues. Throughout this paper, spectral indices are defined by and the values km s-1 Mpc-1, , and have been used. The acronyms of the AGN classes mentioned in this paper are defined in Tab. 1.
2 Radio-selected AGN
In this section we describe radio-selected AGN. The types of, and physical mechanisms powering, radio-AGN are outlined in Sect. 2.1. Selection effects are discussed in Sect. 2.2, while the evolution of radio-AGN and future prospects are addressed in Sect. 2.3 and 2.4, respectively. Typical observing frequencies in the radio regime range from about 10 MHz ( m) up to a few tens of GHz (e.g. 30 GHz, cm). For other recent reviews of radio-selected AGN we refer to Heckman & Best (2014); Padovani (2016); Tadhunter (2016); Smolčić (2016).
2.1 Physical mechanism(s) and types of AGN selected in the radio
The dominant emission process in the radio band is synchrotron emission, i.e. radiation by charged particles gyrating at relativistic velocities through magnetic fields444Free-free emission originating in H II regions may substantially contribute to the overall radio spectrum of SFGs. This, however, is expected to occur at rest-frame frequencies higher than GHz (e.g. Fig. 1 in Condon 1992). The contribution of this emission process to the overall radio spectrum is taken to be negligible for galaxies dominated in the radio regime by an AGN.. Being non-thermal in origin, this emission is usually parametrized by a power law of the form where is the flux density [expressed in Jy, mJy, etc.] at frequency , and is the spectral index. Supernova remnants and processes related to the central SMBH are the main sources of synchrotron radiation in galaxies, resulting in two dominant galaxy populations identified in extragalactic radio continuum surveys, namely star forming galaxies (SFGs) and AGN (e.g. Miley 1980; Condon 1992). The former, being intrinsically weaker radio sources, become more prominent at the faintest radio flux densities (e.g. Wilman et al. 2008; Padovani et al. 2015; Padovani 2016; Smolčić et al. 2017a). We outline here the main classes of radio emitting AGN.
2.1.1 Radio galaxies
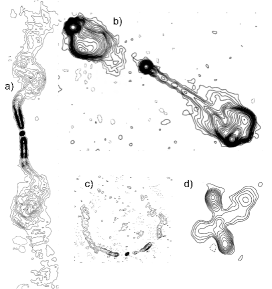
Fanaroff & Riley (1974) differentiated radio galaxies (RGs) into type I and II based on the ratio of the separation of the highest surface brightness regions on opposite sides of the central galaxy, and the extent of the source measured from the lowest surface brightness contour555Any compact component coincident with the central galaxy was not taken into account. (see Fig. 2). These classes are commonly referred to in the literature as FR I (ratio ) and FR II (ratio ) RGs, where the first (second) are often described as core- (edge-) brightened. They also separate in the radio luminosity vs. optical host galaxy luminosity plane (Ledlow & Owen 1996; see also Fig. 11 in Buttiglione et al. 2010). Recently a third class, FR 0, was suggested by Baldi, Capetti, & Giovannini (2015, see also ), which includes RGs sharing the properties of FR Is but lacking prominent extended radio emission, being a factor of more core-dominated. Further morphological classes often found in the literature refer to bent or warped appearances of the RGs (e.g. wide-angle tail, narrow-angle tail, X-shaped RGs; see Fig. 2; see also Miley 1980 for a review, and Figs. 6 and 7 therein).
2.1.2 Flat- and steep-spectrum sources
When multiple radio continuum frequency observations are available, radio sources are usually separated into two main groups of steep () and flat () radio spectrum sources (e.g. Wall 1975; Peacock & Gull 1981; Willott et al. 2001; Kimball & Ivezić 2008), which roughly correspond, with some exceptions, to extended and compact sources. They can further be classified as, e.g. USS (e.g. De Breuck et al. 2001), GPS, and CSS sources (see Sadler 2016 and O’Dea 1998 for reviews). FSRQs and BL Lacs, both of which are flat spectrum sources, make up the blazar class, which includes AGN hosting jets oriented at a very small angle () with respect to the line of sight (e.g. Urry & Padovani 1995; Giommi, Padovani & Polenta 2013; see also Sect. 6). The two sub-classes main difference lies in their optical spectra, with FSRQs displaying strong, broad emission lines just like standard quasars, and BL Lacs instead showing at most weak emission lines, sometimes exhibiting absorption features, and in many cases being completely featureless. Blazars dominate the bright radio (e.g. Padovani, 2016) and the -ray sky (Sect. 6.1). In this respect, we note that a strong radio flux density is one of the most efficient (albeit incomplete) AGN selection criteria: out of the 527 sources with 5 GHz flux density Jy and (Kuehr et al., 1981) only one, M 82, is not an AGN (and only two do not belong to the RG, radio quasar, or blazar classes: M 82 and NGC 1068).
2.1.3 RL and RQ AGN
One of the most used classifications of radio AGN is their division into RL and RQ AGN. Initially, this distinction was defined in the context of quasars () with the threshold between the two classes set either in: (1) radio flux density or luminosity (e.g. Peacock, Miller, & Longair 1986); (2) or the ratio of radio-to-optical flux density or luminosity (e.g. Schmidt 1970). Radio loudness has since then been defined in different ways in the literature but in any case these “classical” definitions apply only to type 1 AGN (Padovani et al., 2011; Bonzini et al., 2013). Following Baloković et al. (2012) the parametrization of radio loudness for type 1 AGN can be summarized as . for a simple radio flux density or luminosity threshold (where Lradio may refer to flux density or luminosity measurements at frequencies GHz in the observed- or rest-frame, respectively; Peacock, Miller, & Longair 1986; Miller, Peacock, & Mead 1990; Ivezić et al. 2002), and for a threshold in the logarithm of the ratio of flux density or luminosity in the radio band and that within a wavelength range , which can either be in the optical (e.g. B-band; Kellermann et al. 1989; r-, i-, or z-band; Ivezić et al. 2002) or IR (e.g. 24 m; Padovani et al. 2011; Bonzini et al. 2013).
Padovani (2016) (see also Padovani, 2017) has argued that the distinction between these two types of AGN is not simply a matter of semantics but rather that the two classes represent intrinsically different objects, with RL AGN emitting a large fraction of their energy non-thermally and in association with powerful relativistic jets, while the multi-wavelength emission of RQ AGN is dominated by thermal emission, directly or indirectly related to the accretion disk (see Fig. 1). Moreover, he pointed out that the “radio-loud/radio-quiet” classes are obsolete, misleading, and inappropriate. Since the major physical difference between these two classes is the presence or lack of strong relativistic jets, which also implies that the two classes reach widely different maximum photon energies (see his Sect. 2.3 and Fig. 1), we will be using in this review the terms “jetted” and “non-jetted” instead of RL and RQ AGN. We discuss this further in Sect. 8.
Note that, although we know that jetted AGN represent a minority, their exact fraction is still not well determined. The oft-quoted value of comes from optically selected samples of quasars (e.g. Kellermann et al., 1989). Padovani (2011), by integrating the radio LFs of jetted and non-jetted AGN, has suggested a much smaller fraction ().
2.1.4 Low- and high-excitation AGN
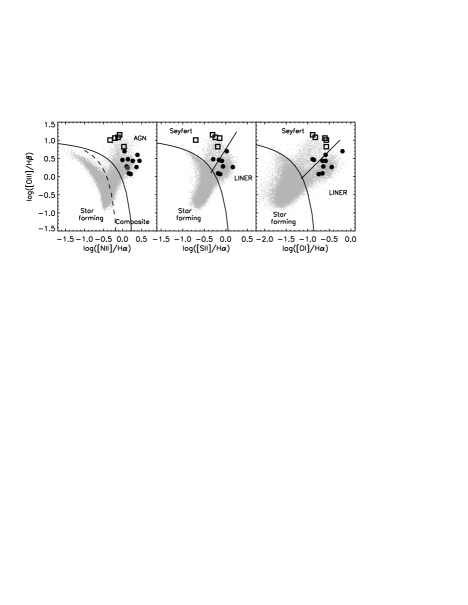
The classification of radio AGN into two main classes based on their optical spectroscopic properties goes back to Hine & Longair (1979). They divided the Third Cambridge Catalogue of Radio Sources (3CR) into objects characterized by strong emission lines in their spectra ([O ii] , [O iii] , [Ne ii] ), and sources which exhibited either absorption line spectra typical of giant elliptical galaxies (absorption line galaxies hereafter) or weak [O ii] emission lines. Since then this has been expanded and refined by using also [O iii] equivalent widths (EWs; e.g. Tadhunter et al. 1998) or high/low excitation/ionization emission line criteria (Laing et al. 1994; Kewley, Groves, Kauffmann, & Heckman 2006; Buttiglione et al. 2009, 2010; see Fig 3). In general, objects without and with high-excitation emission lines in their optical spectra are referred to as LEGs and HEGs, respectively. The LEG/HEG classification holds not only for radio selected AGN but applies also to AGN selected in other bands (for which an optical spectroscopic classification is available). More specifically, quasars and Seyferts belong to the HEG category, while LINERs and absorption line galaxies are classified as LEGs (see Fig. 3 and Sect. 4; Baldwin, Phillips, & Terlevich 1981; Veilleux & Osterbrock 1987; Kewley et al. 2001; Kauffmann et al. 2003a; Kewley, Groves, Kauffmann, & Heckman 2006. But see Sarzi et al. 2010 for evidence that the nebular emission of most objects in the LINER part of Fig. 3 is not powered by an AGN).
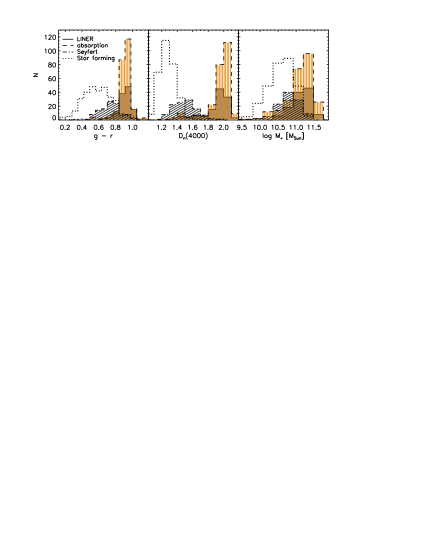
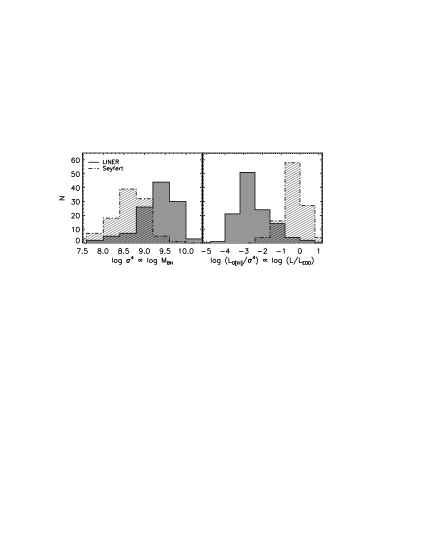
As illustrated in Fig. 4 fundamental physical differences between these two types of radio AGN (at ) have been found (e.g. Nagar, Falcke, & Wilson 2005; Evans et al. 2006; Hardcastle, Evans, & Croston 2007; Smolčić et al. 2009; Smolčić 2009; Buttiglione et al. 2010; Best & Heckman 2012; Padovani et al. 2015; see also Fig. 6 in Smolčić 2016). Namely, LEGs (LINERs and absorption line systems) have on average redder optical colours, larger values of the 4000 Å break strength, and higher stellar masses than HEGs (Seyferts; top panel). LEGs are also shown (bottom panel) to exhibit radiatively inefficient accretion related to low (), possibly fuelled by the hot phase of the inter-galactic medium (IGM), and are typically highly efficient in collimated jet production. HEGs accrete in a radiatively efficient manner, at high Eddington rates (), are fuelled by the cold IGM phase, and (on average) less likely to launch collimated jets. From a theoretical aspect, the observed difference in can be related to the switch between a standard accretion, i.e. radiatively efficient, geometrically thin (but optically thick) disk accretion flow (Shakura & Sunyaev 1973), and a radiatively inefficient, geometrically thick (but optically thin) disk accretion flow (Esin, 1997; Narayan et al., 1998). The switch occurs at accretion rates below a certain (; Rees, Begelman, Blandford, & Phinney 1982; Narayan & Yi 1994; Meier 2002; Fanidakis et al. 2011) as then the decreased accreting gas density lowers the cooling rate, and a substantial amount of heat can be carried along, i.e. advected, rather than irradiated666The switch in is not to be taken as sharp but as a transition in a statistical sense. The fundamental physical separation of the various AGN types may be a function of more parameters (such as spin and BH mass) and one should keep in mind that the observational data used to constrain this separation are subject to measurement and computational uncertainties and biases (e.g. the role of environment in kinetic luminosity determinations, contamination of selection proxies by stellar, rather than AGN related processes, etc.; see, e.g. Mingo et al. 2014)..
2.1.5 Radio-selected AGN classes and unification
There is some overlap amongst the classes described above. For example, almost all FR Is are LEGs, while most FR IIs usually display strong emission lines and would thus be classified as HEGs. However, there is no one-to-one correspondence between FR class and emission lines as quite a few FR IIs (%: e.g. Gendre et al., 2013) have been found to be LEGs (see also Evans et al. 2006; Buttiglione et al. 2010; Mingo et al. 2014). Powerful radio quasars and RGs are generally of the HEG type, while the less powerful (and more common) RGs are mostly LEGs (e.g. Padovani, 2016). “Classical” non-jetted AGN (i.e. Seyferts and quasars) are always HEGs.
Moreover, radio quasars are intrinsically the same sources as some RGs. Namely they are simply FR II/HEG RGs with their jets at an angle with respect to the line of sight (Orr & Browne, 1982; Barthel, 1989; Antonucci, 1993; Urry & Padovani, 1995). The fact that radio quasars display strong and Doppler broadened lines in their optical spectra (with full width half maximum [FWHM] km s-1), unlike RGs, requires also the presence of dust in a flattened configuration roughly perpendicular to the jet (see also Sect. 3.1). This so-called “unification model” explains in a natural way why the (projected) sizes of the jets of RGs are larger than those of quasars (Barthel, 1989).
With regard to FR I/LEG RGs, obscuration towards their nuclei appears to be much smaller than that of their FR II/HEG relatives (e.g. Chiaberge et al., 2002; Evans et al., 2006), which indicates that dust might be not present (see also Sect. 3.2.4). This applies also to the population of FR II/LEG RGs. LEG RGs, therefore, irrespective of their radio morphology, are “unified” with BL Lacs (e.g. Giommi, Padovani & Polenta, 2013).
2.1.6 Classification of radio-selected AGN
The classification of radio-selected AGN is a complex matter, especially so for the faint radio sources routinely studied these days. Getting optical spectra for their counterparts is very time consuming, prohibitively so for the very faint tail [] even with 8-10m class telescopes. But even if we had optical spectra for all radio sources, optical-based classification is well known to be prone to obscuration biases (Sect. 4.3) and for this reason spectra need to be complemented with information from multi-wavelength ancillary data. Multi-wavelength methods used in the literature to identify AGN detected also in the radio band include: (1) rest-frame optical colours of the host galaxies, which have been shown to correlate with the galaxies spectral emission line properties (Strateva et al. 2001; Smolčić et al. 2006, 2008; Smolčić 2009; Ilbert et al. 2010); (2) X-ray luminosity ( erg s-1; e.g. Szokoly et al. 2004; see also Sect. 5.2); (3) mid-IR (MIR) colours (e.g. Lacy et al. 2004; Stern et al. 2005; Donley et al. 2012; see also Sect. 3.2.1); (4) multiple component SED fitting using sets of galaxy and AGN templates (Berta et al. 2013; Delvecchio et al. 2014, 2017); (5) excess of radio luminosity relative to a tracer of the SF rate (SFR) in the host galaxy (e.g. far or total IR luminosity; Condon 1992; Del Moro et al. 2013; Delvecchio et al. 2017). A detailed discussion of these methods (and others) can be found in Padovani (2016).
2.2 Selection effects: SF contribution to the total radio luminosity output
In the local universe LEGs occupy the red sequence of galaxies, while HEGs are hosted by bluer galaxies, populating the so-called green valley (see Fig. 4 in Smolčić 2009). As, generally, bluer host galaxy colours imply higher SFRs (e.g. Ilbert et al. 2009), in the latter case the observed radio emission could be partially or entirely due to synchrotron radiation generated by supernova remnants, rather than by the central SMBH. As the classification of radio AGN often relies on non-radio properties, such as the optical emission line properties or multi-wavelength proxies (Sect. 2.1.6), an a-posteriori assessment of the (SF- or AGN-related) origin of the observed radio emission is needed as X-ray, optical, or IR signatures of an accreting central SMBH do not necessarily imply AGN-related radio emission. Thus, one of the most severe selection effects in the radio band is the contribution of SF-related processes to the total radio power777Note that, while it might be safe to assume that anything above W Hz-1 has nothing to do with SF, this is only valid at low redshifts given the strong evolution of SFGs (e.g. Padovani, 2016). (especially given the limited angular resolution available in many radio continuum surveys).
Detailed high angular resolution radio continuum studies often reveal a mixture of SF- and accretion-related radio emission in non-jetted HEGs (e.g. Chi, Barthel, & Garrett 2013; Maini et al. 2016; Herrera Ruiz et al. 2016). For example, Maini et al. (2016) used the Australian Long Baseline Array to search for compact radio cores in four non-jetted AGN located in the Extended Chandra Deep Field-South (E-CDFS). They find that some such sources contain an active AGN that can contribute significantly (%) to the total radio emission. Herrera Ruiz et al. (2016) studied three non-jetted quasars () in the COSMOS field observed with the Very Large Array (VLA) and the Very Long Baseline Array (VLBA) at and mas resolutions, respectively. Comparing the core (VLBA) and total (VLA) radio flux densities they infer that 50-75% of the radio emission in these sources is powered by AGN activity. Such high-angular resolution studies are, however, still limited to rather small samples, and to-date the main source of radio emission in the most powerful AGN (i.e. ) is still debated. While agreement exists that radio emission in jetted quasars is powered by SMBH accretion-related processes (e.g. Miller, Peacock, & Mead 1990), opposing (statistical) evidence can be found in the literature related to the origin of radio emission in non-jetted quasars (the so-called quasar radio loudness dichotomy problem): SF in the host galaxies (Kimball et al., 2011; Condon et al., 2013), or AGN activity (White, Jarvis, Häußler, & Maddox 2015, Zakamska et al. 2016; see also Padovani 2016 for a detailed discussion of this topic).
From a statistical point of view, studies of radio AGN drawn from large radio-continuum surveys, combined with spectroscopic and/or multi-wavelength data find that () HEGs are much more likely to be associated with SF in their host galaxies, with SFRs at least a factor higher than those in LEGs (Hardcastle et al. 2013; see also Gürkan et al. 2015). The inferred statistical contribution of SF-related processes to the observed radio emission in HEGs and LEGs () is estimated to be () for HEGs (LEGs; Morić et al. 2010). Similarly, Bonzini et al. (2015) find that the radio luminosities of non-jetted AGN at in the E-CDFS survey are consistent with the galaxies’ SFRs inferred from their FIR luminosities. Identifying AGN in a slightly different way, Delvecchio et al. (2017) observe that for about 70% of their AGN the radio luminosities are consistent (within from the average) with those expected based on the SFR in the host galaxies inferred from the total IR emission (corrected for the AGN component).
2.3 Cosmic evolution of radio-selected AGN
Past research has shown that radio AGN evolve via a “downsizing” effect, i.e. low radio luminosity sources evolve less strongly than high-luminosity ones (e.g. Longair 1966; Willott et al. 2001; Rigby et al. 2015; see also Sect. 5.3 for the X-ray perspective). Studies of powerful radio AGN (L W Hz-1) have found a strong positive density evolution at , beyond which their comoving volume density declines (Dunlop & Peacock, 1990; Willott et al., 2001). A substantially slower evolution, with a lower redshift () comoving volume density turnover, has been found for weaker radio AGN (L W Hz-1; Waddington, Dunlop, Peacock, & Windhorst 2001). Studies of even lower luminosity radio AGN (L W Hz-1) find a mild evolution out to (e.g. Smolčić et al. 2009; Sadler et al. 2007; Donoso, Best, & Kauffmann 2009; Padovani et al. 2011; Smolčić et al. 2017b).
The local radio LFs derived separately for HEGs and LEGs have been presented by e.g. Filho, Barthel, & Ho (2006), Best & Heckman (2012), Gendre et al. (2013), Pracy et al. (2016). While it is clear that HEGs dominate the volume densities at high radio luminosities (L W Hz-1; Heckman & Best 2014; Pracy et al. 2016), the slope of the low-luminosity end of the HEG radio LF is still somewhat unclear. Best & Heckman (2012) find a significantly flatter slope than Pracy et al. (2016)888Derived for FIRST-SDSS AGN at from the deg2 LARGESS survey and spectroscopically classified., and Filho, Barthel, & Ho (2006)999Derived for Seyfert galaxies using angular resolution radio continuum data; see also Padovani et al. (2015). (see Fig. 8 in Pracy et al. 2016). As discussed in Pracy et al. (2016) this is likely due to the difficulty of disentangling the real contribution of AGN-related radio emission in HEGs within the faint radio luminosity regime, dominated by SFGs. Regardless of the faint end slope, studies out to consistently find that HEGs evolve more rapidly than LEGs. For example, Pracy et al. (2016) find that their LEG population displays little or no evolution over the observed redshift range (), evolving as [] assuming pure density [pure luminosity] evolution, while their HEG population evolves more rapidly, as [] assuming pure density [pure luminosity] evolution.
Constraining the cosmic evolution of the two dominant AGN types detected in the radio band beyond redshift 1 () is not trivial given the difficulty of: (1) separating the two distinct AGN types so that they can quantitatively be related to the HEG/LEG populations identified via optical spectroscopy at ; (2) isolating the fraction of radio luminosity arising from the AGN (rather than SF in the host galaxy), which is challenging even in the lower () redshift universe. Recently, Padovani et al. (2015) have constrained the cosmic evolution of their selected non-jetted and jetted AGN identified in the E-CDFS survey out to . These two populations can qualitatively be roughly related to the HEG and LEG populations respectively (see Bonzini et al. 2013; Padovani et al. 2015). Padovani et al. find a strong evolution, similar to that for SFGs, of their non-jetted sample throughout the redshift range probed, and a peak at in the number density of their jetted AGN, with a decline at higher redshifts. The first results using the VLA-COSMOS 3 GHz Large Project (Ceraj et al., in prep.), combined with the COSMOS multi-wavelength data (Laigle et al., 2016; Marchesi et al., 2016), yield a stronger cosmic evolution for AGN with the highest bolometric (radiative) luminosities throughout the entire redshift range (; and qualitatively broadly consistent with HEG samples), relative to that of the AGN sample with lower bolometric (radiative) luminosities (and qualitatively broadly consistent with LEG samples)101010The former class has been selected through X-ray, IR, and SED-criteria, while the latter has been identified via radio-excess relative to the host galaxies’ IR-based SFRs, and red rest-frame optical colours, and lacking X-ray, IR, and SED-based signatures of AGN activity (Smolčić et al., 2017a; Delvecchio et al., 2017). In this study the SF related contribution to the total radio luminosity was statistically subtracted.. We stress however that both the E-CDFS and COSMOS fields are not large enough to constrain the broad radio luminosity range, encompassing also the rare, highest luminosity AGN (detectable in shallower, wide-area surveys). Hence, for a full, quantitative assessment of the evolution of the AGN radio LF separated into the two types out to high redshift and over a broad luminosity range a combination of surveys with various areal coverages is needed, with access to a robust AGN classifier, and methods to isolate AGN-related radio emission in (low radio luminosity) AGN, that can be uniformly applied throughout the entire redshift range considered.
2.4 The future of AGN studies in the radio band
Studies such as those discussed in the previous section are becoming feasible only now, and will be invigorated with the onset of the Square Kilometre Array (SKA111111 www.skatelescope.org), offering an observing window between 50 MHz and 20 GHz extending well into the nanoJy regime with unprecedented versatility, in combination with contemporaneous projects over the entire electromagnetic spectrum (such as, e.g., the Large Synoptic Survey Telescope [LSST], Euclid, the Extended ROentgen Survey with an Imaging Telescope Array (eROSITA), and the James Webb Space Telescope [JWST]).
A revolution has in fact started in radio astronomy, which has entered an era of large area surveys reaching flux density limits well below current ones. The Jansky Very Large Array (JVLA121212science.nrao.edu/facilities/vla), the LOw Frequency ARray (LOFAR131313www.astron.nl/radio-observatory/astronomers/lofar-astronomers), the Murchison Widefield Array141414www.mwatelescope.org, are already taking data, and are being joined by the Australian Square Kilometre Array Pathfinder (ASKAP151515www.atnf.csiro.au/projects/askap/), MeerKAT161616www.ska.ac.za/meerkat, e-MERLIN171717www.e-merlin.ac.uk, and APERTIF181818www.astron.nl/general/apertif/apertif. These projects will survey the sky vastly faster than it is possible with existing radio telescopes producing surveys covering large areas of the sky down to fainter flux densities than presently available, as fully detailed in Norris et al. (2013). This, amongst other things, will revolutionise AGN studies. The Evolutionary Map of the Universe (EMU; Norris et al., 2011), one of the ASKAP surveys, for example, is expected to detect million sources, about half of which will likely be AGN unaffected by the problems of obscuration, which plague the optical (Sect. 4.3) and soft X-ray (Sect. 5.2) bands. Identifying AGN in these new radio surveys, however, will not be straightforward and will require many synergies with facilities in other bands (e.g. Padovani, 2016).
3 Infrared-selected AGN
IR studies have had a strong impact on our understanding of AGN structure, their evolution through cosmic time, and their role in galaxy evolution. In Sect. 3.1 we discuss the mechanisms that give rise to the IR emission in AGN and the advantages of AGN identification in the MIR wavelengths. In Sect. 3.2 we examine in detail how the MIR selection of AGN works and what the characteristics of the selected samples are. In Sect. 3.3 and 3.4 we explore additional AGN selection criteria that rely on IR observations. Finally, in Sect. 3.5 we analyse the future of AGN studies in the IR in light of upcoming facilities. For the purpose of this section, we divide the IR SED of AGN in three wavelength regimes: the near-IR (NIR; m), the MIR (m), and the FIR (m).
3.1 Physical mechanism behind IR emission
Despite many drawbacks, the “dusty torus” paradigm has been quite successful in explaining the appearance of a wide variety of AGN. The basis of this paradigm is the presence of dust surrounding the accretion disk on scales larger than that of the broad line region (BLR), with an inner boundary set by the sublimation temperature of the dust grains (Barvainis, 1987). This dust reprocesses the emission of the accretion disk into the IR and dominates the AGN SED from wavelengths longer than 1 m up to a few tens of micron (see Fig. 1). It plays a fundamental role in the AGN unification scheme (Antonucci, 1993; Urry & Padovani, 1995, see also Sect. 2.1.5), as through polarisation studies it was established that the difference between type 1 and 2 AGN is simply an effect of orientation with respect to the dust. In type 2 AGN the dust obscures the line of sight towards the accretion disk and the BLR and only narrow emission lines can be observed in the optical spectrum (e.g. Antonucci & Miller, 1985; Antonucci, 1993, although see Elitzur & Netzer 2016 for a discussion about possible real type 2 AGN where the difference is not caused by dust obscuration; see also Sect. 5.3).
There is a significant debate in the literature over whether the dust is smoothly distributed in the torus (Pier & Krolik, 1992; Dullemond & van Bemmel, 2005; Fritz, Franceschini, & Hatziminaoglou, 2006), whether it is clumpy in the form of optically and geometrically thick clouds (Krolik & Begelman, 1988; Nenkova, Ivezić, & Elitzur, 2002; Nenkova et al., 2008; Elitzur & Shlosman, 2006; Tristram et al., 2007), or a combination of the two (Stalevski et al., 2012; Assef et al., 2013). Observations of the strength of the silicate feature at 9.7 m in AGN, for example, seem to favour models where the dust is most prominently clumpy (Nenkova et al., 2008; Nikutta et al., 2009; Hatziminaoglou et al., 2015), but Feltre et al. (2012) has argued that observations are not yet able to discriminate between the different models. Recent ground-based MIR interferometric observations, on the other hand, suggest that a large proportion of the dust might, instead, reside in the walls of the ionization cone (Asmus, Hönig, & Gandhi, 2016, and references therein), at least in a fraction of nearby AGN (López-Gonzaga et al., 2017). For simplicity and compatibility with the rest of the literature, we will refer to this structure as the “dusty torus” throughout this section, despite evidence that this dust component may have a significantly more complex distribution (e.g. Nenkova et al., 2008).
A number of authors have studied the fraction of lines-of-sight that are obscured by the dusty torus, either by comparing the relative fraction of type 1 and 2 AGN at a given redshift, or by modelling the SED of individual objects. Average obscured fractions of 40% to 75% are reported in the literature (see, e.g. Treister et al., 2004; Hatziminaoglou et al., 2009; Assef et al., 2013; Roseboom et al., 2013). However, a single number does not englobe the diversity of AGN in Nature. Some authors have found that the fraction of obscured lines-of-sight diminishes with increasing luminosity of the accretion disk (Ueda et al., 2003; Hasinger, 2004; Simpson, 2005; Hatziminaoglou et al., 2008; Assef et al., 2013; Mateos et al., 2016), an effect typically referred to as the receding torus (Lawrence, 1991), although others have found no evidence of such an effect (Wang & Jiang, 2006; Lawrence & Elvis, 2010; Hönig et al., 2011; Lacy et al., 2013; Stalevski et al., 2016, see also Sect. 5.3). Additionally, some authors have found a significant variance in the amount of dust in AGN (e.g. Roseboom et al., 2013), with some showing little to no dust (see Sect. 3.2.4) and some showing very large amounts (e.g. Mateos et al., 2016). Furthermore some authors have found a larger fraction of obscured sources at the highest luminosities (Banerji et al., 2012; Assef et al., 2015), suggesting a more complex scenario, and possibly consistent with models where AGN dust obscuration evolves through time (Sanders et al., 1988; Hopkins et al., 2008).
As already mentioned, the emission of the dusty torus is very prominent in the MIR for both type 1 and type 2 AGN. Dust emission from SF can rival in luminosity the AGN but with typically much cooler temperatures K (e.g. Magnelli et al., 2012). As significant SF activity is regularly ongoing in the host galaxies of many AGN, it is more likely to dominate the FIR (e.g. Hatziminaoglou et al., 2010). At rest-frame NIR wavelengths, where the AGN emission has a local minimum at the cross-over between the dropping accretion disk emission and the rising dust emission, the stellar 1.6 m peak can severely hamper AGN identification. As the stellar emission drops steeply longward of the 1.6 m peak, stellar contamination is less of an issue in the MIR (although see Sect. 3.2.5). Hence, the MIR wavelengths are the optimal IR wavelengths for AGN identification.
3.2 AGN in the MIR
3.2.1 Broad-band MIR AGN identification
The large sky background and water absorption by the Earth’s atmosphere make ground-based MIR observations challenging. Spaceborne telescopes are, therefore, better suited for the identification of large AGN samples. In what follows, we focus solely on selection using space-based broad-band photometry, as they account for the great majority of MIR identified AGN, although most implications and many of the caveats also apply to ground-based and to spectroscopic observations. We explore those further in Sect. 3.4.
A number of AGN MIR selection criteria have been proposed over the years. The first ones were already developed for the Infrared Astronomical Satellite (IRAS) mission (de Grijp et al., 1985, 1987; Leech et al., 1989), and their number has grown enormously since, with the advent, in the past decade, of the Spitzer Space Telescope (Werner et al. 2004; see, e.g. Lacy et al. 2004; Lacy et al. 2007, 2013; Stern et al. 2005; Hatziminaoglou et al. 2005; Donley et al. 2012), AKARI (Murakami et al., 2007; Oyabu et al., 2011), and the Wide-field Infrared Survey Explorer (WISE: Wright et al. 2010; see, e.g. Stern et al. 2012; Mateos et al. 2012; Wu et al. 2012b; Assef et al. 2013). These selection criteria have typically been calibrated against independent AGN selection methods and rely primarily on colours to separate AGN from stars or galaxies with inactive nuclei, as AGN are expected to be significantly redder in the shorter wavelength MIR bands (e.g. Stern et al., 2005). We note that the latter is not necessarily true for AGN at redshifts where the H emission line contaminates the shortest wavelength channels, which can lead to significant biases against AGN in some cases (Richards et al., 2009b; Assef et al., 2010), but is generally true otherwise.
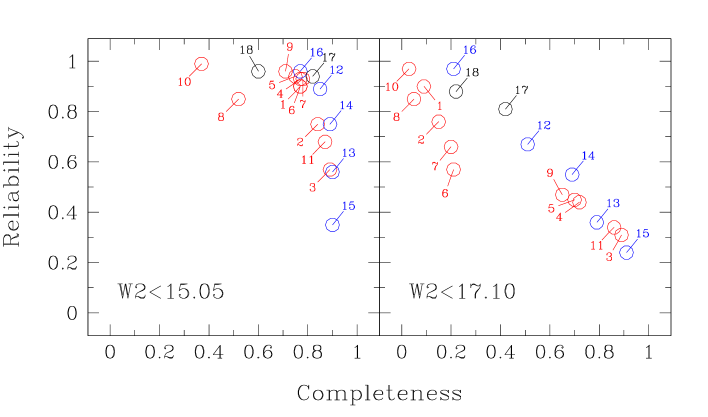
Assef et al. (2013) presented an interesting comparison between the WISE- and Spitzer-based191919For Spitzer we refer specifically to the four broad bands of the IRAC instrument (Fazio et al., 2004) centred at 3.6, 4.5, 5.8 and 8 m (and referred to as [3.6], [4.5], [5.8] and [8.0] respectively), and to the 24 m band of the MIPS instrument (Rieke et al., 2004). For WISE we refer to all its four bands, centred at 3.4, 4.6, 12 and 22 m, usually referred to as W1–W4. selection criteria. These are listed in Table 2 and shown in Fig. 5202020Adapted from Assef et al. (2013) to include the criteria of Donley et al. (2012) and Lacy et al. (2013). Note that the WISE selection criteria still use the data from the All-Sky data release (Cutri et al., 2012).. Using a sample of large, multi-wavelength, spectroscopically identified AGN they determined how reliable and complete each criterion is. The results are shown for two W2 limiting Vega magnitudes, namely on the left, representative of the shallowest fields in the WISE mission, and on the right, that probes down to a 3 depth. Figure 5 shows that shallow and deep surveys need to be analysed separately. For the shallow surveys, most selection criteria recover samples with high reliability and completeness. For deeper surveys, however, the situation is different. Most selection criteria line up diagonally in the diagram trading completeness for reliability. One should also keep in mind that due to their lower sensitivity, the completeness of selection criteria relying on the W3 and W4 bands is lower than the completeness obtained using criteria derived based on a W2-limited sample. A selection relying on these longer wavelengths can be of particular use in the WISE fields closer to the ecliptic poles, where the survey scan pattern is denser and the shorter wavelength bands reach the confusion limit (e.g. Jarrett et al., 2011).
| ID | Reference | Criteria |
| WISE only criteria | ||
| (1) | Assef et al. (2013) – R90† | |
| (2) | Assef et al. (2013) – R75† | |
| (3) | Assef et al. (2013) – C90† | |
| (4) | Assef et al. (2013) – C75† | |
| (5) | Stern et al. (2012)‡ | |
| (6) | Jarrett et al. (2011)∗ | |
| , except | ||
| (i) | ||
| or | ||
| (ii) | ||
| (7) | Mateos et al. (2012)⋆ – 3-band | |
| (8) | Mateos et al. (2012)⋆ – 4-band | |
| (9) | Assef et al. (2010) – 2-band | |
| (10) | Assef et al. (2010) – 4-band | |
| (11) | Wu et al. (2012b) | |
| Spitzer only criteria | ||
| (12) | Stern et al. (2005) | |
| (13) | Lacy et al. (2004) | |
| (14) | Lacy et al. (2007) | |
| (15) | Lacy et al. (2013) | |
| (16) | Donley et al. (2012) | |
| NIR + Spitzer criteria | ||
| (17) | Messias et al. (2012) – KI | |
| (18) | Messias et al. (2012) – KIM | |
In all the criteria above, the name of a band
represents its magnitude in the Vega system, while
represents the flux density of band . Note that [24] refers
to the MIPS 24 m band Vega magnitude, for which we have
assumed a flux density zero point of 7.14 Jy. For empirically
calibrated WISE selection criteria we indicate the magnitude
range of the calibration sample if one was applied, as the
comparison in Figure 5 may be extrapolated to fainter
magnitudes in some cases.
†Calibrated for galaxies with and .
‡Calibrated for galaxies with .
∗Calibrated for galaxies with , , .
⋆Calibrated for galaxies detected with in all WISE bands used.
3.2.2 Comparison with general AGN identification at other wavelengths
MIR AGN identification is considerably less sensitive to obscuration of the central engine by dust compared to optical identification, as dust opacity is lower at longer wavelengths, and is therefore better for the selection of obscured AGN than optical identification, although its sensitivity to obscured AGN decreases with increasing redshift due to the K-correction (e.g. Assef et al., 2011).
As discussed in Sect. 5.2, X-rays are also sensitive to obscured sources, especially in the harder X-ray energies, which are less affected by neutral hydrogen absorption. The main advantage of the MIR over the X-rays is that the integration times needed for AGN identification are much shorter, and hence allow for faster survey speeds. For example, Gorjian et al. (2008) finds that 97.5% of all sources in the 5 ks integrations of Chandra X-ray Observatory of the XBoötes survey (0.5 – 7.0 keV flux erg cm-2 s-1; Murray et al., 2005) have counterparts detected in the 90 s integrations of the IRAC Shallow Survey (Jy; Eisenhardt et al., 2004). Of the X-ray sources without an IR match, 40% might be spurious. Furthermore, MIR identification can find AGN that are hard to detect in the X-rays, either due to obscurations or to intrinsic X-ray faintness (e.g. Stern et al., 2012, see also Sect. 5.2).
However, MIR identification is affected by contaminants and biases that are only marginally relevant to X-ray or optical selections. In the next sections we discuss these issues, which need to be taken into account when drawing statistical conclusions about the AGN population from MIR selected samples.
3.2.3 Contaminants
As mentioned earlier, AGN selection using MIR broad-bands mostly relies on the typically redder colours of AGN, particularly in the observed 3–5 m wavelength range. However, there are a number of different populations that can mimic the colours of AGN in these bands and will affect most selection criteria, although the extent will depend on each specific selection. At redshift , strongly SFGs with powerful polycyclic aromatic hydrocarbon (PAH) emission can have red enough colours to be confused with AGN in some identification schemes (see e.g. Stern et al., 2005; Assef et al., 2010; Hainline et al., 2016). Such galaxies can appear as contaminants in shallow and deep observations (see previous section). As they are uncommon and the co-moving volume is low enough at the respective redshift range, they are typically only a minor contaminant. However, Hainline et al. (2016) has recently pointed out that such contaminants can be confused with AGN hosted in dwarf galaxies and hence represent a major problem for their identification (e.g. Satyapal et al., 2014, 2016).
For deeper surveys, the most serious contaminants are high redshift () massive galaxies. At those redshifts the 1.6 m stellar bump is shifted into the MIR, and their colours can become red enough to mimic those of AGN in many selection schemes (see Donley et al., 2007; Donley et al., 2012; Yun et al., 2008; Assef et al., 2010; Assef et al., 2013; Mendez et al., 2013). The selection technique developed by Donley et al. (2012) for Spitzer observations is specifically aimed at avoiding these galaxies, resulting in high reliability at faint fluxes although at the cost of completeness. Using W2 magnitude dependent prescriptions, as described in Assef et al. (2013), has the same effect resulting also in high reliability at faint fluxes with a very low completeness level (see Fig. 5).
In addition to extragalactic contaminants, there are a number of Galactic sources that can mimic the colours of AGN in the MIR, such as brown dwarfs or young stellar objects. Brown dwarfs are rare and typically only account for a small fraction of the contaminants but might still affect the identification of high-redshift () AGN (Stern et al., 2007). Young stellar objects also have MIR colours that can be confused with those of AGN (see, e.g. Koenig et al., 2012), and they can be numerous contaminants close to the Galactic plane.
3.2.4 Dust-free AGN and hot dust poor quasars
Broad-band MIR AGN selection primarily relies on the detection of the hot dust emission at low and intermediate redshifts. While hot dust emission is rather prominent in most AGN, its ratio to the accretion disk emission (usually described as the torus’ apparent covering fraction) shows a wide distribution (see e.g. Roseboom et al., 2013; Mateos et al., 2016; Hernán-Caballero et al., 2016). Therefore, AGN with low hot dust emission relative to that of their host could escape identification, especially if they reside within luminous hosts. Such objects account for of the quasar population selected in the X-rays, optical or MIR (Hao et al., 2010, 2011, but see also Lyu, Rieke, & Shi 2017) and their fraction may be increasing with redshift (Hao et al., 2010; Mor & Trakhtenbrot, 2011; Jun & Im, 2013). According to Hao et al. (2011), their small amount of dust seems to be sufficient to place them to the borders of the Lacy et al. (2004) criteria, but they would be systematically missed by a more stringent selection.
MIR selections would of course completely miss dust-free AGN, such as the local analogues of the two sources identified by Jiang et al. (2010) among a sample of 21 quasars observed with Spitzer. Although such analogues may not necessarily exist, they might occur more often at lower luminosities. In fact, Elitzur & Shlosman (2006) showed that if the torus is populated by outflowing clouds of material from the accretion disk, at the accretion would be too low to sustain the required outflow rate resulting in the disappearance of the torus. This may apply to some LEG RGs (see also Sect. 2.1.5). A clear case among the observational evidence (e.g. Chiaberge et al., 1999; Maoz et al., 2005; Müller-Sánchez et al., 2013) is the nearby LEG M87, that has been shown to lack the thermal radiation of the torus (Whysong & Antonucci, 2004; Perlman et al., 2007). Such objects would be missed systematically by all MIR selection criteria at low redshifts.
3.2.5 Eddington Ratios and BH Masses
The luminosity of the spheroidal component of a galaxy correlates with the mass of its SMBH (at least at relatively low redshifts: e.g. Marconi & Hunt, 2003; Gültekin et al., 2009) and hence with its Eddington limit. The ratio of the specific luminosity of the AGN to that of the host, , therefore directly depends on the AGN . In other words, the incompleteness due to host dilution directly translates into a bias of MIR AGN selection against low . Such a bias has been discussed by, e.g., Hickox et al. (2009) (see also Fig. 25) and Mendez et al. (2013), who showed that MIR AGN selection only probes the upper end () of the distribution compared to X-ray selection (this applies also to optically selected AGN: see Sect. 4.5). Quantifying this bias is difficult, as it strongly depends on the selection function being used, but it needs to be taken into account and the complete selection function needs to be modelled in order to be able to give a physical and statistical interpretation of results based on MIR-selected AGN.
Although in an indirect manner, this selection effect can also bias the distribution of BH masses in MIR identified AGN. As BH masses correlate only with the luminosity of the host galaxy’s spheroidal component, the selection effect discussed above will be stronger in galaxies with important disk or irregular components, as the starlight from them will increase for a fixed BH mass. In other words, AGN in galaxies with disk components need to accrete at higher to be identified by MIR selection techniques. As such non-bulge components are typically more prominent in lower mass galaxies, and these host lower mass BHs (Magorrian et al., 1998), the latter will be systematically underrepresented in MIR AGN samples.
3.3 Red, reddened and high-redshift AGN
NIR photometry has also been used to select AGN (e.g. Warren et al., 2000; Francis et al., 2004; Kouzuma & Yamaoka, 2010). Such methods, however, offer little gain compared to MIR and optical selection. Nevertheless, NIR has been useful in the identification of red AGN samples, e.g. Glikman et al. (2007) using 2MASS, FIRST and band photometry, as well as the heavily reddened quasars of Banerji et al. (2012, 2015) found in the UKIDSS survey.
Populations of heavily reddened AGN have also been found by means of MIR photometry, often in combination with optical observations. For example, using the colour between the optical band and the MIPS 24 m band, Dey et al. (2008) found a new class of objects, dubbed Dust-Obscured Galaxies or DOGs, many of which host heavily reddened AGN (see e.g. Melbourne et al., 2012). Recently Ross et al. (2015) presented a selection of Extremely Red Quasars relying on SDSS and WISE data. Similar is the case of the Hot Dust Obscured galaxies or Hot DOGs (Eisenhardt et al., 2012; Wu et al., 2012a), selected based purely on their WISE colours, for which a number of studies suggest they probe an important stage of galaxy evolution (see e.g. Jones et al., 2014; Assef et al., 2015; Tsai et al., 2015; Díaz-Santos et al., 2016).
Finally, NIR and MIR wavelengths are very important for the identification of the earliest quasars in the Universe, which are not observable in the optical due to Ly forest absorption and the Lyman break. For example, the highest redshift quasar currently known at was found by Mortlock et al. (2011) relying on the IR coverage of the UKIDSS survey, and Bañados et al. (2016) has recently used NIR and MIR observations from 2MASS, VHS and WISE to help in the identification of quasars candidates selected from the optical PanSTARRS212121panstarrs.stsci.edu/ survey. Upcoming NIR surveys such as those that will be provided by Euclid and the Wide-Field Infrared Survey Telescope (WFIRST) will allow to better probe the quasar population at the earliest cosmic times (see Sect. 3.5).
3.4 MIR spectroscopy
MIR spectroscopy, particularly with the InfraRed Spectrograph (IRS; Houck et al. 2004) on board the Spitzer Space Telescope, provided new insights into the physics and classification of AGN. The unambiguous observations of the silicate feature at 9.7 m in emission in many known AGN (Hao et al., 2005; Siebenmorgen et al., 2005; Sturm et al., 2005; Buchanan et al., 2006; Shi et al., 2006) came as the long sought confirmation of the unified scheme. At the same time, however, IRS observations indicated that in some cases the source of obscuration resides in the host rather than the torus (e.g. Goulding et al., 2012; Hatziminaoglou et al., 2015).
Identification through MIR spectroscopy is very powerful, allowing to detect obscured AGN components even when the MIR is dominated by the host galaxy. Several classification diagrams have been developed to determine the AGN contribution to an observed spectrum based on certain spectral features, such as high ionisation emission lines like [Ne v], [Ne ii] and [O iv], the EW of PAH features and the strength of the silicate feature at 9.7 m (see, e.g. Spoon et al., 2007; Armus et al., 2007; Veilleux et al., 2009; Hernán-Caballero & Hatziminaoglou, 2011). A number of techniques have also been developed to model the observed MIR spectra and constrain the AGN and starburst contributions (see e.g. Schweitzer et al., 2008; Nardini et al., 2008; Deo et al., 2009; Feltre et al., 2013).
Although MIR spectroscopy has had a great impact on our understanding of AGN, the number of objects studied through these techniques is limited when compared to photometric studies, as spectroscopic observations require significantly longer integration times. Ground-based observations are generally limited to the brightest targets due to the effects of the Earth’s atmosphere (e.g. Alonso-Herrero et al., 2016), while deeper observations were possible with the IRS during its cryogen-cooled phase. For the most part, such observations were limited to luminous IR galaxies (LIRGs), ultraluminous IR galaxies (ULIRGs), and quasars (Hernán-Caballero & Hatziminaoglou, 2011, and references therein) although a number of higher redshift ULIRGs were also studied by IRS (see e.g. Kirkpatrick et al., 2012). The impact of these techniques will be greatly expanded by the upcoming JWST (Gardner et al. 2006) and Space Infrared Telescope for Cosmology and Astrophysics (SPICA; Nakagawa et al. 2015), that will probe significantly fainter targets and will allow us to select new, currently inaccessible, sets of objects, as discussed next.
3.5 The future of AGN studies in the IR band
The upcoming generation of ground-based giant telescopes will significantly expand upon the current NIR and MIR capabilities, as most of them will have significant focus on these wavelengths. The Giant Magellan Telescope (GMT222222www.gmto.org) is planning on first generation instruments with imaging capabilities from 0.9 to 2.5 m and spectroscopic capabilities in the 1–5 m range, and its first light is currently expected for 2021. The Thirty Meter Telescope (TMT232323www.tmt.org) is planning on first-light photometric and spectroscopic instruments in the 0.8–2.5 m range, with the goal of extending this range to 28 m within its first decade of operations. The first generation instrumentation of the largest of the upcoming giant telescopes, the Extremely Large Telescope (ELT242424www.eso.org/sci/facilities/eelt), will allow for imaging and spectroscopy all the way to 19 m. Finally, the University of Tokyo Atacama Observatory (TAO252525www.ioa.s.u-tokyo.ac.jp/TAO/en) 6.5m telescope will focus on the IR, with planned first light instrumentation probing wavelengths as long as 38 m.
The only space-based observatories with MIR imaging capabilities currently in operation are Spitzer, whose operations have recently been extended until 2019 by the 2016 NASA Senior Review, and WISE, whose NEOWISE-R phase is planned to extend until the end of 2017. In the near future, NASA’s JWST262626www.stsci.edu/jwst, expected to launch in 2018, will offer unprecedented imaging and spectroscopic capabilities in the 0.6–28.3 m wavelength range thanks to its 6.5m diameter primary mirror. Observations with the JWST will probe with high angular resolution a number of targets that are not accessible from the ground, likely having a major impact in our understanding of AGN. The proposed joint JAXA/ESA mission SPICA272727www.ir.isas.jaxa.jp/SPICA/SPICA_HP/index-en.html, that will be launched in 2028 if approved by the two agencies, will have a 2.5m aperture and will provide low-to-high resolution spectroscopy in the wavelength range between 35 and 240 m, and imaging capabilities. Finally, the upcoming Euclid and WFIRST missions will have a significant impact in NIR AGN identification by mapping large areas of the sky to very faint depths. Euclid282828www.euclid-ec.org, expected to launch in 2020, will have a 1.2m primary mirror and will survey of extragalactic sky down to limiting AB magnitudes of 24 in , and , as well as 24.5 in a very wide optical broad-band. It will also observe a smaller region of to limiting AB magnitudes of 26 in the NIR bands and 26.5 in the optical band. The WFIRST mission292929wfirst.gsfc.nasa.gov, expected to launch by 2024, will, on the other hand, have a 2.4m primary mirror and a similar set of bands, and is planned to image 2,227 down to a limiting AB magnitude of 26.7 in (Spergel et al., 2015). Both telescopes will also obtain NIR slitless grism spectroscopy in their survey areas. Through their unique combination of area and depth, both surveys will probe AGN activity during the formation of the first galaxies in the Universe.
4 Optically-selected AGN
This section discusses the selection and properties of optically-selected AGN as contrasted with investigations at other wavelengths. The focus here is on the more luminous subsets that would typically be classified as quasars or Seyfert 1 galaxies. We will not cover objects like the host-galaxy dominated AGN (Kauffmann et al., 2003a), the LINERs (Heckman, 1980), or XBONGs (Hornschemeier et al., 2005). While optical surveys are able to identify quantitatively more AGN than other wavelengths (through a combination of area and depth), this size comes with a bias towards brighter, unobscured sources with (see Sect. 4.5). Even though optical surveys are not ideal for probing obscured AGN, we discuss how they can guide our search for them. The bias towards unobscured sources in the optical is partially mitigated, however, by an increase in information content for the sources that are identified—in the form of physics probed by the combination of optical continuum, absorption, and emission. An example is the ability to estimate the mass of the SMBHs based on the optical/UV emission lines. We discuss the physical mechanisms behind optical emission in Sect. 4.1 and AGN identification, selection effects, information content, and the range of masses (and accretion rates) probed by the optical band in Sect. 4.2 – 4.5. While the redshift/luminosity evolution of optically-selected luminous quasars would seem to be well constrained from today to redshift , we review evidence suggesting that the Hopkins, Richards, & Hernquist (2007) bolometric LF needs to be updated. How next-generation surveys such as LSST can bridge the evolution of luminous quasars to lower-luminosity AGN (that are typically better probed at other wavelengths) will be addressed in Sect. 4.6. In this section we cover the range (rest-frame).
4.1 Physical mechanisms behind optical emission
AGN are believed to be powered by accretion onto a SMBH, that gives rise to high X-ray-to-optical luminosities, a characteristic rest-frame UV/optical power-law continuum (very distinct from the continuum of non-active galaxies) as well as the so called “big blue bump”, and a break of this continuum blueward of Å (Fig. 1). Many models, usually assuming a geometrically thin, optically thick accretion disk, have been developed in order to explain this emission (e.g. Sun & Malkan, 1989; Laor & Netzer, 1989; Hubeny et al., 2001, and references therein). AGN that have a line of sight to the central engine that is not obscured show broad emission lines with typical gas velocities of a few 1000 km s-1 covering a large range in strength and profiles, whose properties correlate with the luminosity of the AGN (e.g. Baldwin, 1997). The source of the broad emission lines is the BLR, believed to be located between the SMBH and the inner wall of the dusty torus (see Sect. 3), with photoionized gas that has been heated by the radiation coming from the accretion disk around the SMBH. Finally, AGN display narrow emission lines, with gas velocities between 300 and 1000 km s-1, originating in the Narrow Line Region (NLR) with sizes hundreds of parsec, located above (and below) the plane of the dust.
4.2 Photometric and spectroscopic identification
The features described in the previous section are the basis of optical AGN identification, be it photometric or spectroscopic. Broad band photometry is sensitive to the presence of broad emission lines in the various filters as a function of redshift, as they alter the otherwise very typical colours of the AGN that separate them from the stellar locus (see, e.g. Richards et al., 2001, Fig. 4). Narrow band surveys such as COMBO17 (Wolf et al., 2003), ALHAMBRA (Moles et al., 2008), and now J-PAS (Benitez et al., 2014) make use of the spectral features to not only identify AGN but to also estimate their (photometric) redshifts with a precision that reaches below 1% (e.g. Salvato et al., 2009; Hsu et al., 2014), a great improvement with respect to early attempts (Hatziminaoglou, Mathez & Pelló, 2000). Finally, we are generally reliant on optical spectroscopy to provide confirmation of a source as an AGN and to determine its redshift, while the presence of narrow emission lines in the spectra of galaxies and their ratios are indicative of the presence of an AGN (e.g. Feltre et al., 2016).
The problem with the optical band, as compared to, say, the hard X-rays, is that bright optical sources are not necessarily AGN. The same is true for the radio (Sect. 2.1.2) and IR to some extent (Sect. 3.2)—the brightest sources on the sky have a high probability of being an AGN. This point is illustrated in the comparison of number counts between the X-ray (Lehmer et al., 2012, Fig. 5) and optical (Shanks et al., 2015, Fig. 24): in the optical, stars far outnumber AGN at typical survey depths.
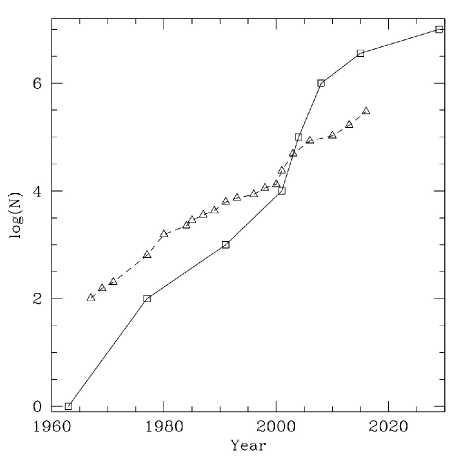
Optical selection can make up for this (photometric) uncertainty with sheer numbers. Deep, high-resolution X-ray, IR and radio fields provide a much higher AGN density—up to deg-2 (Sect. 5.1; e.g. Luo et al., 2017, see also Sect. 8), but only over minuscule areas. The density of the largest-area photometric and spectroscopic quasar samples is only deg-2, but over a large fraction of the sky, which results in larger samples of AGN overall (e.g. Richards et al., 2009a; D’Abrusco, Longo, & Walton, 2009; Bovy et al., 2011; Flesch, 2015; Brescia, Cavuoti, & Longo, 2015; Pâris et al., 2017). Figure 6 shows the growth in quasar numbers with time for both heterogeneous and homogeneous quasar samples. We discuss the impact of future facilities in Sect. 4.6.
4.3 Selection effects
Paradoxically, many (optically) unobscured AGN are missed by optical surveys. These are objects whose colours put them in (or close to) the stellar locus. Since luminous quasars are point sources, but are outnumbered by stars in our galaxy by at the SDSS depth, it is very difficult to create a complete sample of quasars at certain redshifts—without considerable stellar contamination. The redshifts affected span a large range around with very low completeness, and a smaller range around (Richards et al., 2002, 2006b; Worseck & Prochaska, 2011). Even the SDSS-III/BOSS quasar sample is only 60% complete at these redshifts despite being designed to identify quasars (Ross et al., 2013). It is worth noting that most MIR selections have a similar redshift “hole” over (Sect. 3.2.1) but this can be filled in by using optical and MIR data simultaneously (Richards et al., 2015).
Lower-luminosity AGN are also a challenge for imaging-only optical surveys (like the Dark Energy Survey [DES303030www.darkenergysurvey.org] and LSST313131www.lsst.org) for the reasons noted above: without spectroscopy, it is difficult to distinguish a normal galaxy from an active galaxy. Variability selection may not help all that much for such sources considering that, while the amplitude of variability increases at lower luminosity (Vanden Berk et al., 2004, see also Sect. 7.2.3), the fraction of optical emission from the central engine decreases. Yet this is the population that we most need to probe, especially for comparison to X-ray and MIR samples.
The biggest hole in the selection of AGN via optical photometry is certainly obscured (or type 2) AGN. It does not matter whether the optical obscuration is by a smooth torus or a clumpy one (see Sect. 3.1 for a full list of references on smooth and clumpy distributions): the traditional AGN model has a region where most of the optical emission is obscured. The irony is that a large fraction of known type 2 AGN are still selected in the optical (Zakamska et al., 2003; Reyes et al., 2008; Alexandroff et al., 2013; Yuan, Strauss, & Zakamska, 2016). This result is due to a combination of effects: the host galaxy is not (always) obscured and both strong emission lines and scattering can result in non-negligible optical flux producing unusual (or even AGN-like) colours, which can cause them to be identified as potential type 1 sources despite them being type 2.
Thus the question of the relative fraction of obscured and unobscured AGN is still much debated/investigated (see also Sect. 3.1), particularly as a function of luminosity (e.g. Gilli, Comastri, & Hasinger, 2007; Ueda et al., 2014). Crucially, differences in the definition of “obscured” between the optical and X-ray (e.g. Hickox et al., 2007) make it more difficult than one might imagine to paint a full picture (see also Sect. 5.3).
4.4 Information content
In Sect. 3 we saw that IR-detected quasars are relatively unbiased against type 2 AGN, whereas most of the optical light comes from the central accretion disk, which is blocked in these sources. However, while the optical may be missing a crucial component of the AGN zoo in terms of obscured AGN, it more than makes up for that loss in terms of information content of those AGN that are detected. Moreover, the information content in the continuum, emission lines, and absorption lines from optical spectroscopy is particularly rich. For example, BAL quasars (Weymann, Morris, Foltz, & Hewett, 1991) have provided us with direct evidence of winds in AGN systems with outflow velocities extending to tens of thousands km s-1 (e.g. Hamann et al., 2011).
While the BAL sub-class represents only of the population of luminous quasars (Hewett & Foltz, 2003), the advent of principal component analysis, both using photometry (Boroson & Green, 1992) and spectroscopy (Francis, Hewett, Foltz, & Chaffee, 1992; Yip et al., 2004) and large data sets from SDSS (Schneider et al., 2010; Pâris et al., 2017), has enabled the community to treat quasars as diverse systems. For example, Richards et al. (2011) argue that we can learn about winds using emission lines in addition to absorption lines, which potentially turns every quasar into powerful probe of AGN outflows.
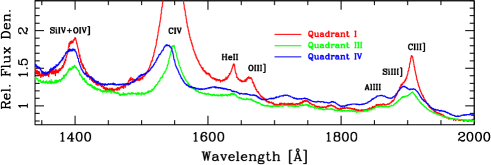
Indeed, one way to illustrate the diversity of quasars is presented in Fig. 7, which shows how physical trends are manifested in the different emission lines: quasars with harder spectra have stronger emission lines and less “blueshift” of the C iv emission line. The probability of a quasar being radio detected or having strong BAL troughs is a strong function of the appearance of these emission lines (Richards et al., 2011). The trends shown in Fig. 7 appear to be related to those that define the “Eigenvector 1”323232This is a set of correlations between properties observed in quasar spectra, which comes out of principal component analysis. parameter space (Boroson & Green, 1992; Brotherton & Francis, 1999; Sulentic, Marziani, & Dultzin-Hacyan, 2000; Sulentic et al., 2007), which together highlight the great diversity of AGN even when considering only those that are both optically selected and very luminous. Often overlooked is the fact that this diversity has important implications for accurate determination of quasar redshifts (Hewett & Wild, 2010).
4.5 and
Arguably the best example of where optical provides additional information content and makes up for selection effects is in our ability to utilise BH mass scaling relations to estimate the masses of the BHs powering quasars (e.g. Vestergaard & Peterson, 2006). Again, this process requires optical spectroscopy333333NIR spectroscopy can be used as well, but the sample size of objects with appropriate data is relatively small by comparison (but see Ricci et al., 2017).. By: (1) knowing the width of the emission lines; (2) assuming that that width is dominated by gravitational effects; (3) having an estimate of the characteristic radius of the emitting gas assuming (Bentz et al., 2009); and (4) calibrating this information against the few dozen objects for which there exists “reverberation mapping” (Peterson, 1993) data, we can then estimate the masses of the BH in every type 1 quasar.
Generally speaking the types of AGN discussed herein have masses of – and accretion rates (in terms of ) of 0.01–1 (Greene & Ho, 2007; Vestergaard et al., 2008; Shen & Kelly, 2012; Trakhtenbrot & Netzer, 2012). See Schulze et al. (2015) for a recent, comprehensive analysis that combines data from the VIMOS-VLT Deep Survey (VVDS), zCOSMOS, and SDSS.
Scaling relations for estimating the masses of BHs in relatively local AGN (up to ) make use of the H emission line and are thought to be relatively robust (at the level of dex). Using the Mg ii emission line these scaling relations have been extended to . However, beyond that redshift other broad emission lines need to be used. As such, attempts have been made to calibrate C iv to produce BH mass estimates, though it is becoming clear that the winds discussed above can significantly bias the estimates for high-redshift quasars which rely on the C iv emission line (Baskin & Laor, 2005; Richards et al., 2011; Denney, 2012; Shen, 2013). As the sample size of high-redshift quasars with both optical and IR spectroscopic coverage grows, corrections to this scheme might help bringing the BH masses into alignment (e.g. Runnoe et al., 2013; Coatman et al., 2016). However, the uncertainties associated with the determination of SMBH based on C iv are not solely due to low spectral resolution and/or signal-to-noise ratio (S/N) but rather point towards differences in the physics of the BLR. In other words, either the C iv-emitting gas is non-virialised or objects with low and high FWHM(H) have different ionisation structure, since the FWHM(C iv) has only a loose correlation, if any, with FWHM(H) (Denney et al., 2013; Mejia-Restrepo et al., 2016; Coatman et al., 2017).
4.6 The evolution with redshift and the impact of future facilities
The SDSS quasar LF (Richards et al., 2006b) was unique not in the redshift range or luminosity that it probed, but rather because it probed such a large range with just one uniform data set with a large number of quasars. One of the shortcomings of the wide, but shallow SDSS work was that it generally only probed the bright end of the LF, whereas narrow, but deep X-ray surveys were better able to probe the faint end. Hopkins, Richards, & Hernquist (2007) combined the best of both worlds from various multi-wavelength surveys to create a bolometric LF.
Recent works, however (e.g. Assef et al., 2011; Ross et al., 2013; McGreer et al., 2013), have shown that the evolution of the break luminosity (where the slope of the LF changes rapidly) may be very different from that predicted by Hopkins, Richards, & Hernquist (2007) and that the faintest SDSS quasars might start probing the faint end (rather than the bright end, as was assumed) of the LF at high . What is needed here are both deeper surveys in the optical and wider surveys in the X-ray (Sect. 5.4), or similarly deep/wide NIR surveys (Sect. 3.5). But even without new data there is a decade of observations that could be incorporated into an updated bolometric LF.
Improving our knowledge of the quasar LF has consequences beyond the study of quasars: it also has important consequences for reionisation in the early Universe. For example, the results of McGreer et al. (2013) and Glikman et al. (2011) suggest photoionisation rates at that do not fully agree.
It is important to understand that the bias in the optical band is towards the high luminosity end of the AGN distribution, i.e. bona fide quasars. In part that is because that is the population that optical surveys themselves are biased to. However, current and upcoming experiments like Pan-STARRS343434pswww.ifa.hawaii.edu/pswww/, DES, and LSST (will) probe to fainter limits that are more compatible with the lower-luminosity AGN (where the host emission is more comparable to the central engine) that surveys at other wavelengths most commonly identify. These new optical surveys will help complete a multi-wavelength bridge that will allow AGN astronomers to more fully sample luminosity-redshift space across the full electromagnetic spectrum, as illustrated by LaMassa et al. (2016, Fig. 14).
5 X-ray-selected AGN
We discuss in this section X-ray-selected AGN. The physical mechanism behind X-ray emission is examined in Sect. 5.1, while Sect. 5.2 deals with AGN selection and its challenges. Sect. 5.3 reviews the types of AGN selected in the X-ray band, the range of and they sample, and their evolution, while Sect. 5.4 gives an overview of the future of this field. In this review we define the X-ray band as covering the energy range of 0.2–200 keV.
5.1 Physical mechanism behind X-ray emission
X-ray observations provide a near complete selection of AGN with low contamination from non-AGN systems. The primary reasons for this are: (1) X-ray emission from AGN appears to be (near) universal; (2) X-rays are able to penetrate through large column densities of gas and dust (particularly at high X-ray energies); (3) X-ray emission from host-galaxy processes are typically weak when compared to the AGN (see also Sect. 1.1 of Brandt & Alexander, 2015). On the basis of these advantages, the deepest blank-field cosmic X-ray surveys have identified the largest reliable AGN source density to date ( 24,000 deg-2; Lehmer et al. 2012; Luo et al. 2017 and Sect. 8).
The intrinsic X-ray emission from AGN is due to processes related to the accretion disk (see Mushotzky, Done, & Pounds 1993; Done 2010; Gilfanov & Merloni 2014 for reviews; note that in jetted AGN the jet can make a major contribution in the X-ray band as well)353535In this section we focus on high accretion-rate AGN (with an optically thick and geometrically thin accretion disk; i.e. ), which account for the majority of the BH growth in the Universe (e.g. Ueda et al. 2014; Aird et al. 2015). Low accretion-rate AGN (with an optically thin, geometrically thick, hot accretion flow; i.e. ) can also be selected at X-ray energies, although the accretion process is driven by advection of a hot plasma; see Sect. 2.1.4, Done, Gierliński, & Kubota (2007), and Yuan & Narayan (2014) for more details.. The primary process is thought to be inverse Compton scattering of the accretion-disk photons to X-ray energies via the accretion-disk “corona” (see Fig. 1; this is generally depicted as an atmosphere above the inner accretion disk, though its exact geometry is unknown). However, thermal X-ray emission due to the inner regions of the accretion disk can also be produced at the lowest X-ray energies (e.g. Sobolewska, Siemiginowska, & Życki, 2004). The X-ray emission is then modified due to the interaction with matter in the nuclear region (e.g. reflection, scattering, and photo-electric absorption of photons from the accretion disk and/or the obscuring AGN torus: see Sect. 3.1). The relative strength of these components can vary quite significantly from source to source, mostly due to differences in the geometry and inclination angle of the torus to the line of sight, leading to a broad range of X-ray spectral shapes. The intrinsic X-ray emission from the “corona” is tightly connected to the accretion-disk emission (as parameterised by ; e.g. Steffen et al. 2006; Lusso & Risaliti 2016) for almost all systems (for exceptions see, e.g. Wu et al. 2011; Luo et al. 2014), demonstrating a causal relationship and showing that X-ray emission from AGN is (near) universal.
A large number of X-ray observatories have been launched since the first pioneering rocket flights of the 1960s (see Giacconi 2009 for a review). The majority of the results presented here have been obtained from the most sensitive X-ray observatories in operation, all of which employ grazing-incidence optics to focus X-ray photons and achieve high sensitivity at high spatial resolution: Chandra, XMM-Newton, and NuSTAR. Chandra (launched July 1999; Weisskopf et al. 2002) provides up-to sub-arcsecond imaging at 0.3–8 keV with sufficient collecting area for high S/N X-ray spectra of bright X-ray sources. The low background, high spatial resolution, and good collecting area allows Chandra to detect sources three orders of magnitude fainter than previous-generation X-ray observatories. XMM-Newton (launched December 1999; Jansen et al. 2001) provides lower spatial resolution imaging than Chandra ( FWHM) over 0.2–12 keV but with substantially larger collecting area, allowing for higher S/N X-ray spectra of bright X-ray sources than Chandra. NuSTAR (launched June 2012; Harrison et al. 2013) provides lower spatial resolution imaging than Chandra and XMM-Newton ( FWHM and half-power diameter) but is sensitive to much higher energy photons ( 3–79 keV). In comparison to previous generation observatories with sensitivity at keV NuSTAR is able to detect sources two orders of magnitude fainter.
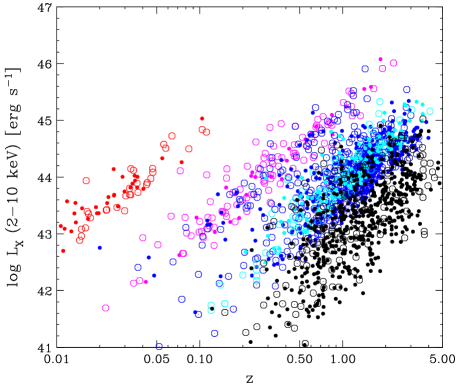
5.2 Selection of AGN in the X-ray band: identification challenges
The (near) universality of X-ray emission from AGN, the high penetrating power of X-rays, and the low contamination from host-galaxy emission, mean that AGN selection effects at X-ray energies are generally modest, particularly at high energies (rest-frame energies keV). Fig. 8 demonstrates the broad – plane coverage for AGN selected from blank-field cosmic X-ray surveys: AGN with erg s-1, – erg s-1, and erg s-1 are typically classified as high luminosity (broadly corresponding to “quasars”), moderate luminosity (broadly corresponding to “Seyfert galaxies”), and LLAGN respectively.
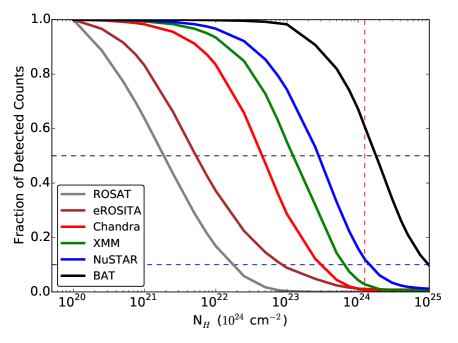
For the majority of AGN, the most significant selection effect is that of absorption, which is a function of rest-frame X-ray energy: lower energy X-rays are more easily absorbed than higher energy X-rays (Wilms, Allen, & McCray 2000). The impact of varying amounts of absorption on the detection of X-ray photons for a AGN from a selection of X-ray observatories is shown in Fig. 9. The effect of absorption on the fraction of X-ray detected counts is clear for all of the X-ray observatories but is only significant at keV for heavily obscured AGN ( cm-2). Since an increase in redshift leads to an increase in the rest-frame energies probed within a given observed-frame band, the effect of absorption is less significant at high redshift than low redshift. However, CT AGN (i.e. AGN where the absorbing column density exceeds the inverse of the Thomson scattering cross section: cm-2) are challenging to detect even at high rest-frame energies due to Compton recoil and subsequent absorption of the X-ray photons (see Comastri 2004 for a review). Other wavebands that are less sensitive to the effects of heavy obscuration (e.g. the radio and IR wavebands; see Sects. 2 and 3) will be less biased towards the detection of CT AGN. However, the unambiguous identification of the signatures of CT absorption and the measurement of absorbing column densities requires X-ray observations. This is most effectively achieved from broad-band X-ray spectral fitting (i.e. the combination of [ideally simultaneous] data from, for example, NuSTAR and Chandra or XMM-Newton), which can break the degeneracy between the contributions from various X-ray emitting components (e.g. photo-electric absorption; reflection; scattering; Baloković et al. 2014; Del Moro et al. 2014; Gandhi et al. 2014; Akylas et al. 2016).
For AGN with low observed X-ray luminosities (e.g. intrinsically LLAGN, including LEGs, or heavily obscured AGN), the host galaxy can start to contaminate the emission from the AGN, leading to challenges in the identification and characterisation of the AGN. The dominant host-galaxy phenomenon at X-ray energies is commonly referred to as X-ray binaries (see Fabbiano 2006 and Remillard & McClintock 2006 for reviews). The emission from X-ray binaries is due to mass accretion onto a degenerate star (neutron star or BH) from a companion star in a binary system: X-ray binaries are sub-classified into low-mass X-ray binaries (LMXBs) and high-mass X-ray binaries (HMXBs), depending on the mass of the companion star. The emission from LMXBs is closely tied to the stellar mass of the galaxy and can reach erg s-1 for a massive galaxy of (e.g. Lehmer et al. 2010; Boroson, Kim, & Fabbiano 2011) while the emission from HMXBs is closely tied to the SFR and can reach erg s-1 for an extreme SFG with a SFR of yr-1 (e.g. Lehmer et al. 2010; Mineo, Gilfanov, & Sunyaev 2012a). To accurately identify or characterise the AGN requires taking account of both of these X-ray binary components. However, since the X-ray emission from host-galaxy processes rarely exceeds erg s-1, and has not been known to exceed erg s-1 (e.g. Alexander et al. 2005; Wang et al. 2013), an X-ray source with erg s-1 is likely to be an AGN. Furthermore, the integrated emission from a population of X-ray binaries is mostly produced at low energies ( keV) and therefore AGN can be more reliably identified and characterised at higher energies (see Sect. 2.3 of Brandt & Alexander, 2015, for a list of additional criteria to identify X-ray emission from an AGN).
Another potential component of non-AGN contamination at X-ray energies is emission from hot gas, either from the host galaxy or a galaxy cluster. The hot-gas component can be up-to – erg s-1 from galaxies (e.g. Boroson, Kim, & Fabbiano 2011; Mineo, Gilfanov, & Sunyaev 2012b) and can be as high as – erg s-1 in the cores of massive galaxy clusters (e.g. Stanek et al. 2006; Ebeling et al. 2010). However, since the X-ray emission from the hot gas is thermal, it is mostly produced at low energies ( 2–5 keV) and therefore the AGN can be more reliably identified and characterised at higher energies, even in the most massive galaxy cluster cores.
On the basis of the aforementioned factors, it is clear that X-ray observations provide an efficient and reliable selection of the overall AGN population. Furthermore, the modest X-ray selection biases are well understood and can be reliably modelled to allow for robust measurements on the evolution of AGN and the growth of BHs (e.g. Gilli, Comastri, & Hasinger 2007; Georgantopoulos et al. 2013; Ueda et al. 2014; Aird et al. 2015; Buchner et al. 2015; Miyaji et al. 2015; Merloni 2016). However, significant uncertainties remain on the contributions to the cosmic BH growth from LLAGN and CT AGN. Various complementary approaches can be utilised to make further progress. For example, combining constraints in the X-ray band with AGN and host-galaxy measurements in other wavebands (e.g. IR and radio wavelengths) to assess the expected strength of the AGN and host-galaxy components at X-ray energies (e.g. Alexander et al. 2008; Gandhi et al. 2009; Georgantopoulos et al. 2011; Del Moro et al. 2013, 2016; Asmus et al. 2015) or utilising high spatial resolution X-ray imaging and spectroscopy to directly identify the AGN and host-galaxy components in nearby low-luminosity systems (e.g. Annuar et al. 2015, 2017; Ricci et al. 2016).
5.3 Selection of AGN in the X-ray band: AGN types, , , and cosmic evolution
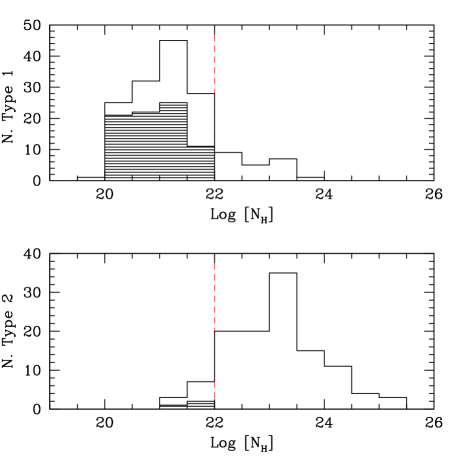
Essentially all types of AGN are selected at X-ray energies: absorbed and unabsorbed AGN of low, moderate, and high luminosity (see Fig. 8). Overall there is also good agreement between the optical and X-ray signatures of absorption (e.g. Malizia et al. 2012; Merloni et al. 2014; Burtscher et al. 2016): the majority ( 80–90%) of optical type 1 AGN are X-ray unabsorbed ( cm-2) while the majority ( 80–90%) of optical type 2 AGN are X-ray absorbed ( cm-2; see Fig. 10). Careful consideration of the thresholds in the classification of X-ray and optical absorbed and unabsorbed AGN can provide even closer agreement (Burtscher et al. 2016). The overall consistency between the X-ray and optical absorption indicators provide some of the strongest observational support for the basic unified AGN model (e.g. Antonucci 1993; Urry & Padovani 1995).
However, the clear disagreements between absorption indicators for a small subset of the AGN population (e.g. X-ray unabsorbed type 2 AGN and X-ray absorbed type 1 AGN; e.g. Panessa & Bassani 2002; Bianchi et al. 2012) also provide interesting insight on the overall universality of the basic unified model (see Netzer 2015 for a review). Time-series observations have shown that the X-ray and optical spectral properties of AGN can vary on relatively short timescales as a result of changes in the absorbing column density along the line of sight (e.g. Risaliti, Elvis, & Nicastro 2002; Risaliti et al. 2005; Matt, Guainazzi, & Maiolino 2003; MacLeod et al. 2016; Ruan et al. 2016; see also Sect. 7.1.3). Therefore, some of the occasional disagreements between absorption indicators are due to non-simultaneous X-ray and optical observations; however, AGN variability does not explain the differences for all cases and some AGN appear to genuinely depart from the basic unified model (see also Sect. 3.1).
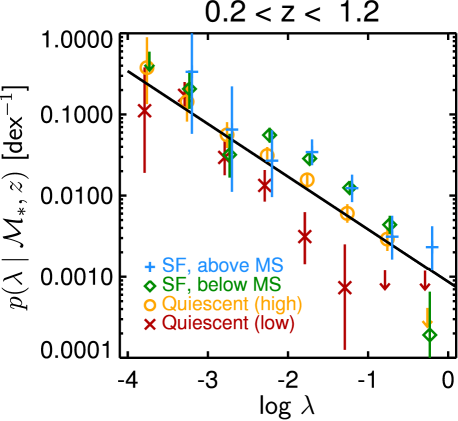
Due to the (near) universality of X-ray emission from AGN, its production should not be inherently biased towards specific ranges in and . Indeed, X-ray emission has been detected from AGN with a broad range of out to high redshifts ( – ; e.g. Hickox et al. 2009; Page et al. 2014; Baldassare et al. 2015; Chen et al. 2017). Despite the lack of an intrinsic bias towards detecting low-mass BHs at X-ray energies, the majority of the AGN detected in blank-field cosmic X-ray surveys are nevertheless found to reside in massive galaxies (stellar masses , implying ; e.g. Brusa et al. 2009; Hickox et al. 2009; Xue et al. 2010; see Brandt & Alexander 2015 for a review). However, the deficiency of X-ray AGN in low-mass galaxies (i.e., a low AGN fraction) appears to be due to selection effects: for a fixed X-ray flux limit (i.e. a luminosity limit at a given redshift), the probability of detecting a low AGN with a massive BH is significantly higher than a high AGN with a low-mass BH (e.g. Aird et al. 2012; Bongiorno et al. 2012). Taking account of these observational biases, the distribution of for X-ray AGN appears to be broadly consistent with a power law and is largely mass independent (e.g. Aird et al. 2012; Bongiorno et al. 2012). However, there is evidence for differences in the normalisation (and potentially the shape) of the distribution between quiescent and star-forming host galaxies (e.g. Aird et al. 2012; Azadi et al. 2015; see Fig. 11).
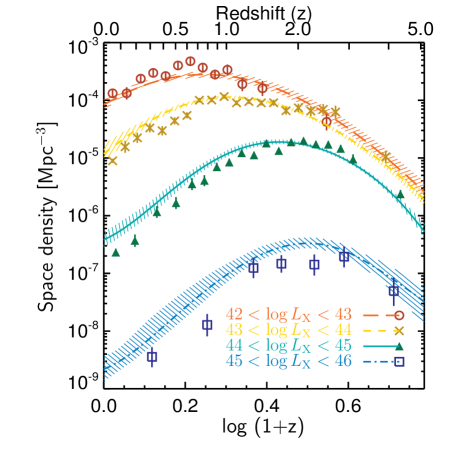
Blank-field cosmic X-ray surveys have provided some of the most detailed and sensitive constraints on the evolution of the AGN population. It is now clear from a large suite of studies that the evolution in the space density of X-ray selected AGN is dependent on luminosity: moderate-luminosity AGN peak at 0.5–1 while high-luminosity AGN peak at 2–3 (e.g. Ueda et al. 2014; Aird et al. 2015; Buchner et al. 2015; Miyaji et al. 2015); see Fig. 12. This luminosity dependent evolution is commonly referred to as “AGN downsizing” (see also Sect. 2.3) and, to first order, is likely to be driven by the availability of a cold-gas supply in the vicinity of the accreting BH; however, the processes that influence the availability of the gas are likely to be manifold (e.g. SF; AGN and stellar feedback; large-scale environment; see Alexander & Hickox 2012 for a general review). In terms of the cosmic BH growth (essentially the product of the space density and AGN luminosity), the majority has occurred at 1–2, with broadly similar amounts of growth at and : high-luminosity AGN dominate the BH growth density at (– erg s-1 AGN contribute the majority) while moderate-luminosity AGN dominate at (– erg s-1 AGN contribute the majority).
The fraction of X-ray absorbed AGN is found to be a function of luminosity, with a decreasing fraction towards higher X-ray luminosities, and appears to also increase with redshift (e.g. La Franca et al. 2005; Ueda et al. 2014; Aird et al. 2015; Buchner et al. 2015; but see also Sect. 3.1 for IR-selected AGN). The redshift evolution in absorption may be a consequence of the luminosity dependent X-ray absorbed AGN fraction shifting to higher luminosities at higher redshifts (e.g. Aird et al. 2015; Buchner et al. 2015). These results suggest that the covering factor of the obscuring material (i.e. the AGN torus) might change as a function of luminosity and redshift; however, it is currently unclear what drives this behaviour.
5.4 The future of AGN studies in the X-ray band
We now look towards the scientific gains that can be anticipated from several future X-ray facilities; see Sect. 6.4 of Brandt & Alexander (2015) for a more detailed discussion of these observatories and other proposed X-ray facilities.
eROSITA363636www.mpe.mpg.de/eROSITA (Merloni et al. 2012) is a joint Russian-German mission planned for launch in 2018. The principle objective of eROSITA is to undertake a sensitive all-sky survey, achieving sensitivity limits 20 and 200 times deeper than ROSAT (0.5–2 keV; Voges et al. 1999) and HEAO 1 A-2 (2–10 keV; Piccinotti et al. 1982), respectively. The great advance that eROSITA will provide over the more sensitive Chandra and XMM-Newton observatories is huge AGN statistics ( 3 million AGN out to 6), effectively providing an X-ray equivalent of the SDSS (York et al. 2000) or WISE, to explore the cosmic growth of BHs and large-scale structure at X-ray energies.
The Advanced Telescope for High ENergy Astrophysics (Athena373737www.the-athena-x-ray-observatory.eu; Nandra et al. 2013) is an ESA-led mission planned for launch in 2028. Athena will be a revolutionary general-purpose X-ray observatory with a wide field of view (FoV; 40), large collecting area (2 m2 at 1 keV), good spatial resolution (), and excellent spectral resolution (2.5 eV). Athena has many key scientific aims but, from the point of view of this review, two of the main advances will come from: (1) excellent-quality X-ray spectroscopy (both in terms of unprecedented sensitivity and spectral resolution), to elucidate the physics of AGN activity (e.g. Cappi et al. 2013; Dovciak et al. 2013); (2) unsurpassed sensitivity for wide–deep blank-field cosmic surveys, to construct a near-complete census of AGN activity out to 1–3 and identify moderately luminous AGN out to 6–10 (down to erg s-1; e.g. Aird et al. 2013; Georgakakis et al. 2013).
Finally, the X-ray Imaging Polarimetry Explorer (XIPE383838www.isdc.unige.ch/xipe; Soffitta et al. 2016) is a new mission concept selected by ESA in 2015 to undergo a 2 year-long assessment phase in the context of the Cosmic Vision competition. XIPE is dedicated to undertake temporally, spatially, and spectrally resolved X-ray polarimetry. From the point of view of AGN the polarised emission is expected to be due to the scattering and reflection of photons and to originate in the vicinity of the accretion disk, the absorbing region (the AGN torus), and larger-scale ionisation “cones”. Therefore, XIPE will provide unique physical insight on the geometry and connections between these different regions (Goosmann & Matt 2011).
6 -ray-selected AGN
We discuss in this section -ray-selected AGN. The -ray band is conventionally split into the High Energy (HE) band, between 100 MeV and 100 GeV, and the Very High Energy (VHE) band, covering the 50 GeV to 10 TeV range. The types of AGN selected, their SEDs, and the physical mechanism(s) behind -ray emission are detailed in Sect. 6.1, while -ray detectors are described in Sect. 6.2. Sects. 6.3 and Sect. 6.4 deal with the HE and VHE bands respectively, while Sect. 6.5 addresses the blazar population and its contribution to the -ray background. Sect. 6.6 discusses selection biases and, finally, Sect. 6.7 addresses the future of this field.
6.1 -ray AGN, their SEDs, and physical mechanism(s) behind -ray emission
The -ray band is the most energetic part of the electromagnetic spectrum and, as such, is beyond the reach of most astronomical sources. This applies also to most types of extragalactic objects, including the non-jetted AGN detected in large numbers in IR, optical, and X-ray surveys thanks to the radiation resulting from accretion onto the central SMBH (Sects. 3, 4, and 5; see Fig. 1).
Blazars, despite being intrinsically very rare (orders of magnitude less abundant than non-jetted AGN of the same optical magnitude), dominate the extragalactic -ray sky, which include also a few other AGN, mostly nearby RGs (blazars are also prevalent in the bright radio sky: Sect. 2.1.2). Non-jetted AGN have not been detected in the -rays393939With the exception of NGC 1068 and NGC 4945, two Seyfert 2 galaxies in which the -ray emission is thought to be related to their starburst component (Ackermann et al., 2012b). (Ackermann et al., 2012a). The power output of blazars covers the entire electromagnetic spectrum and is dominated by non-thermal, blue-shifted, and Doppler boosted radiation arising in a relativistic jet pointed in the direction of the observer (e.g. Urry & Padovani, 1995, see also Sect. 2.1.5). It is because of this intense non-thermal emission, and the very special geometrical conditions, that blazars reach the most extreme parts of the electromagnetic spectrum with fluxes well above the sensitivity of the instruments operating today. Blazars, as discussed in Sect. 2.1.2, are further divided into two subgroups defined by their optical spectra, i.e. BL Lacs and FSRQs.
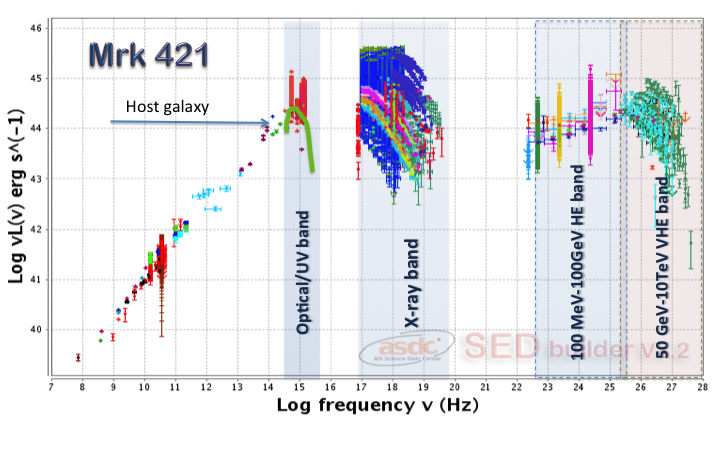
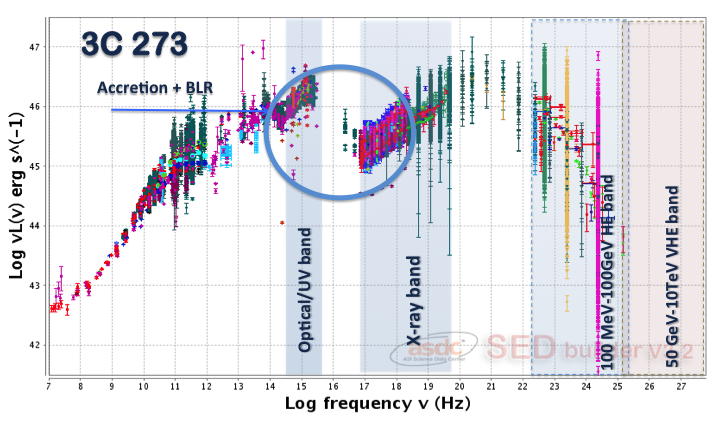
The SED of blazars (see Figs. 13 and 14 for two examples of well known objects) covers the entire electromagnetic spectrum, from radio waves to -ray energies, and is characterized by a typical “double humped” shape (in a vs. [or vs. ] space). The low energy component, peaking between the IR and the X-ray band, is generally attributed to synchrotron radiation produced by relativistic electrons moving in a magnetic field. Sources where this component peaks at low energies ( Hz) are called LSPs, while objects with SED peaking at high energies ( Hz) are called HSPS (Padovani & Giommi, 1995; Abdo et al., 2010). Objects with located at intermediate energies are called ISPs.
The nature of the second SED component, that extends well into the -ray band, is still debated as two alternative (or complementary) interpretations are being considered. In leptonic models (e.g. Maraschi, Ghisellini & Celotti, 1992) the emission is explained as inverse Compton scattering between the electrons in the jet and their own synchrotron emission (synchrotron self-Compton) or an external photon field (external inverse Compton). In hadronic scenarios (e.g. Böttcher et al., 2013) -rays are instead assumed to originate from high-energy protons either loosing energy through synchrotron emission (Aharonian, 2000) or through photo-meson interactions (Mannheim, 1993). In this case blazars would also be neutrino emitters (from the decay of charged pions) extending their SEDs outside the electromagnetic spectrum into newly explored multi-messenger scenarios, which might even include cosmic rays (CRs) (e.g. Padovani et al., 2016; Resconi et al., 2017).
Figures 13 and 14 show the SEDs of the HSP BL Lac Mrk 421 and of the LSP FSRQ 3C 273 built using large amounts of archival data from many space- and ground-based observatories covering almost all frequencies and a time span of several years. The HE and VHE -ray bands are highlighted. A clear difference in the -ray emission of the two objects is apparent: a flat spectrum in the HE band extending to VHE energies for Mrk 421, a steep spectrum in the HE band with almost no emission in the VHE band for 3C 273. Strong variability, another defining characteristics of blazars, is clearly visible in both objects at all energies, with the largest amplitude occurring in the X-rays for Mrk 421 and in the -ray band for 3C 273.
6.2 -ray detectors
Different -ray detectors operate in different bands. The HE band is where -rays are detected in electron pair-conversion telescopes. These instruments operate in space and are characterized by a very large FoV (thousands of square degrees; e.g. Tavani et al., 2009; Atwood et al., 2009). The VHE band is where the present detection capability is provided by Imaging Atmospheric Cherenkov Telescopes (IACTs) and Extensive Air Shower (EAS) observatories (e.g. DeNaurois & Mazin, 2015). These instruments observe from the ground the particle showers that are produced by the impact of VHE -ray photons on the top layers of the atmosphere, either through the Cherenkov light they generate, or via the direct detection of the charged particles in the shower. The small overlap between the two bands (between 50 and 100 GeV) allows for inter-calibration between space and ground-based observatories. This is particularly important as this is where spectral breaks occur in the most extreme astrophysical sources.
6.3 The HE band
Currently four -ray space telescopes or instruments sensitive to photons in the 100 MeV – 100 GeV band are operational: the “Astro-rivelatore Gamma a Immagini LEggero” (AGILE), which was launched in 2007 and is the oldest in operation, Fermi (launched in 2008), the Alpha Magnetic Spectrometer (AMS-2, launched in 2011), and the DArk Matter Particle Explorer (DAMPE, launched in 2015). Published results or publicly available data are, however, so far available only from AGILE and Fermi. The other facilities, although sensitive to cosmic -rays, have different prime objectives, such as the detailed measurement of charged CRs and dark matter, and have not contributed to the -ray astronomy literature so far.
The best sensitivity is provided by the Large Area Telescope on board Fermi (Fermi-LAT, Atwood et al., 2009), which is approximately two orders of magnitude more sensitive than the previous generation of -ray telescopes like the Energetic Gamma Ray Experiment Telescope (EGRET) on board of the Compton Gamma Ray Observatory (Thompson et al., 1993).
The size of the point spread function and the effective area of Fermi-LAT strongly depend on energy, resulting in a sensitivity limit that significantly depends on the intrinsic source spectrum404040See www.slac.stanford.edu/exp/glast/groups/canda/lat_Performance.htm. This has a strong impact on the blazar types that are detected in different -ray bands, introducing selection biases, as discussed below (Sect. 6.6).
6.3.1 AGN in the HE -ray band
Two main approaches have been followed to produce catalogues of -ray sources in the HE band. In the one adopted by the project teams the detection is based on -ray data only and is therefore “blind” with respect to any additional information about astrophysical sources. For this reason they use conservative statistical thresholds (e.g. AGILE: Pittori et al. 2009; Fermi-LAT 0,1,2,3FGL: Acero et al. 2015, and references therein, where the numbers denote the n-th Fermi-LAT source catalogue; Fermi 1,2,3FHL: The Fermi-LAT Collaboration 2017, and references therein, where the numbers denote the n-th catalogue of hard sources). Other lists have instead been obtained by searching for -ray excesses at the positions of previously known blazars, or blazar candidates (e.g. Arsioli & Chang, 2017; Arsioli, Giommi & Polenta, 2017) in Fermi-LAT archival data. The two approaches are complementary as they make use of different information in the application of the statistical detection methods, use different thresholds and integration times, and are sensitive in different ways to source confusion, a problem that is becoming an issue as the sensitivity improves after many years of Fermi-LAT data.
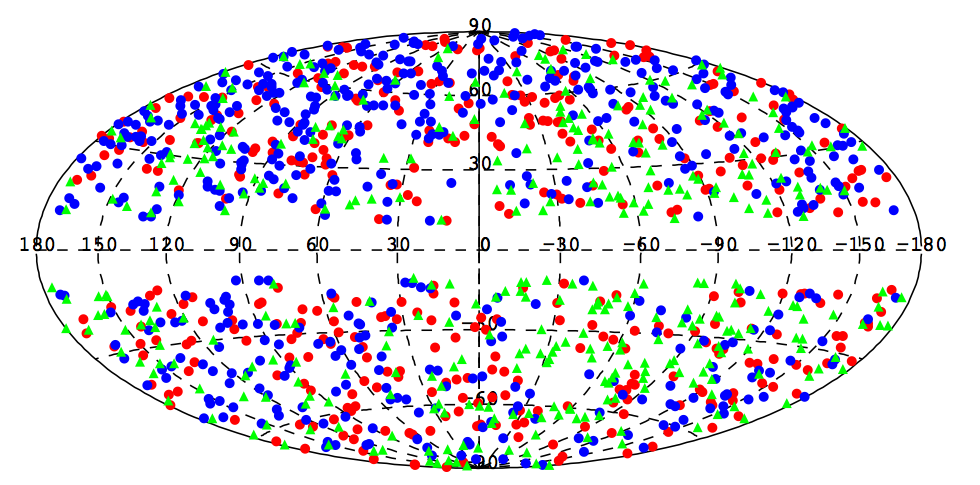
The largest catalogue of -ray sources published so far, the 3FGL, is based on the first 4 years of Fermi-LAT data and includes 3033 objects. Outside the Galactic plane almost all -ray detections that have been associated to known objects are jetted AGN, the large majority of them being blazars with only a handful of RGs.
Figure 15 shows a plot in Galactic coordinates of the subsample of 1563 high Galactic latitude () sources in the 3FGL catalogue that have been firmly associated with AGN (Ackermann et al., 2015b). This includes 415 FSRQs (all of the LSP type), 657 BL Lacs (mostly of the HSP type), and 402 blazars of uncertain type (assumed to be blazars because of their radio to -ray SED but with no optical spectrum yet available to classify them as FSRQs or BL Lacs).
An example of the second approach to the detection of -ray sources is the Brazil ICRANet Gamma-ray Blazar catalogue (1BIBG; Arsioli & Chang, 2017) where the authors report 150 new -ray sources in the sample of multi-frequency selected Second WISE High Synchrotron Peaked (2WHSP) blazars.
A comprehensive list of AGN detected by Fermi, compiled at the ASDC from all published catalogues and other publications, is available on-line414141www.asdc.asi.it/fermiagn. At the time of writing it includes 1959 distinct sources, 536 of which are FSRQs, 687 are BL Lacs, 15 are RGs, and 75 are AGN of unknown type.
6.4 The VHE band
The VHE -ray band is where currently operating IACTs and EAS are sensitive, with Fermi-LAT also partly covering this band up to TeV. Indeed, the largest catalogue of VHE sources, the 3FHL (The Fermi-LAT Collaboration, 2017), is based on Fermi-LAT data.
This energy region is particularly challenging for AGN observations as VHE -rays are subject to pair production interactions with the extragalactic background light (EBL; Ackermann et al., 2012c) causing strong flux attenuations that are energy and redshift dependent, thus modifying the observed spectra and limiting the horizon to the relatively low redshift Universe.
The present generation of IACTs (e.g. MAGIC, H.E.S.S., VERITAS) and the upcoming Cherenkov Telescope Array (CTA) are characterized by relatively small FoV (a few square degrees), and very good sensitivity. IACTs are excellent instruments for detecting fast variability, catching flaring states, and measure the status of the object during the (typically few hours) of observations. Several years of observations led to the detection of many blazars, especially during large flares, often following pointings triggered by high states discovered in other wavebands.
Water Cherenkov/EAS detectors (e.g. HAWK, ARGO, TIBET, and the future Large High Altitude Air Shower Observatory [LHAASO]) are instead characterized by a large FoV (thousands of square degrees), moderate sensitivity, and operate nearly 100% of the time (day and night). These observatories are well suited to carry out long-integration surveys of large parts of the sky, with typical output being fluxes averaged over long integration periods or the discovery of strong flares in bright objects.
6.4.1 AGN in the VHE -ray band
The main lists of objects in this energy band detected by IACTs are available on-line424242tevcat.uchicago.edu and www.asdc.asi.it/tgevcat as interactive tables that are updated periodically as new sources are detected. At present they include approximately 180 sources distributed in the Galaxy as shown in Fig. 16. These samples do not represent uniform surveys of the VHE sky as they only include sources detected during pointings of known sources, often during flaring states. Only a fraction of the high Galactic latitude sky has been observed so far.
At high Galactic latitudes almost all sources in VHE catalogues are blazars, the majority of which (50 sources) are of the HSP or ISP type, while only 8 are of the LSP type (6 FSRQs and 2 BL Lacs); two of these, namely S3 0218+35 and PKS1441+25, are located at , a remarkably high value for this energy band. Four RGs are also detected (Centaurus A, NGC 1275, PKS 062535, and M 87).
The 2FHL catalogue (Ackermann et al., 2016a) is based on 80 months of Fermi-LAT data and is a real full sky survey compiled with photons having energies between 50 GeV and 2 TeV. It includes 360 sources, many more that those detected by IATCs. In fact only about 25% of 2FHL sources were previously detected by Cherenkov telescopes. Similarly to the Fermi-3FGL catalogue off the Galactic plane nearly all sources are blazars. However, in this case BL Lacs of the HSP type are the large majority; only 10 FSRQs have been found so far. This difference with respect to the HE band is easily explained as due to the much steeper -ray spectral slope of FRSQs (all of which are LSPs) and to EBL absorption that further steepens and reduces the intensity of the spectrum of the more distant FSRQs.
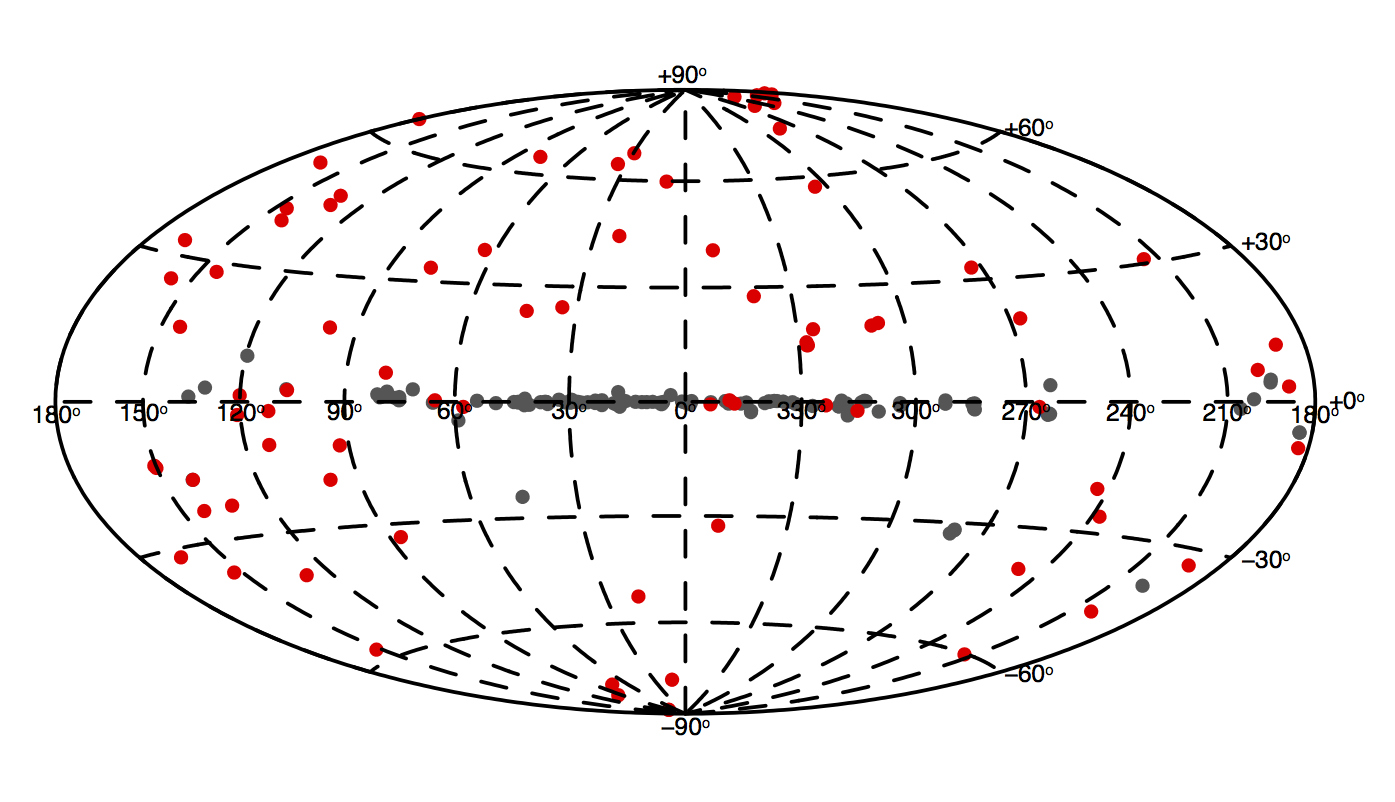
To complement the 2FHL sample, and in an effort to construct a much larger list of targets for VHE observations, Chang et al. (2017) assembled the 2WHSP catalogue, a very large sample of confirmed and candidate blazars of the HSP type that are expected to emit in the VHE band. The sample was selected using radio, IR (WISE), optical, and X-ray survey data, imposing that the SED of the candidates is similar to that of known HSP blazars, which are the most abundant type of AGN found in the VHE band. The 2WHSP sample includes 1691 sources and is available on-line434343www.asdc.asi.it/2whsp. The already mentioned study by Arsioli & Chang (2017), who found 150 -ray detections that were never reported before using over 7 years of Fermi-LAT data, confirms that 2WHSP blazars indeed constitute a very good reservoir of candidate VHE -ray sources for the next generation of detectors such as CTA and LHAASO.
6.5 Blazar population properties and contribution to the -ray extragalactic background
The large samples that can be assembled from Fermi-LAT catalogues and other publications have been used to determine the population properties of blazars such as the -ray number counts, the LF and cosmological evolution for both BL Lacs and FSRQs (Abdo et al., 2010b; Ajello et al., 2015).
Ajello et al. (2015) found that the blazar -ray LF can be represented by a broken power law and that its evolution with redshift is strong for all types of evolution models (luminosity, density and luminosity dependent density evolution) considered. By integrating the best fit LF, taking into account the estimated amount of cosmological evolution, the distribution of blazar spectral slopes and EBL attenuation, the authors estimated the contribution of AGN to the extragalactic -ray background (EBG, Ackermann et al., 2015a). The results show that the integrated emission from blazars and RGs can explain both the intensity and the spectral shape of the extragalactic background in the 100 MeV – 820 GeV energy band. In particular, above 100 GeV a very large fraction of the EGB is due to HSP blazars with SED similar to that shown in Fig. 13. The fact that AGN are responsible for most, if not all, of the EGB is particularly important also because it leaves little room to the contribution of diffuse components such as -rays from the annihilation of dark matter particles and from the interaction of ultra HE CRs with the cosmic microwave background.
6.6 Blazars and selection biases in the -ray and other energy bands
The complex broad-band SEDs of blazars result from the superposition of many spectral components, such as the double humped non-thermal emission, light from the host galaxy, the BLR, and the accretion onto the SMBH. This mix, combined with different viewing angles and a wide range of maximum particle acceleration energies leads to SEDs with largely different shapes, causing very strong selection effects when looking at blazars in widely separated regions of the electromagnetic spectrum. For instance, blazars selected at radio or microwave frequencies are mostly of the FSRQ/LSP type, whereas X-ray selection leads to samples largely dominated by BL Lacs of the HSP type. In the -ray band selection effects are not less important, especially because the sensitivity of Fermi-LAT strongly depends on the spectral slope of the detected sources: steep -ray spectra FSRQs/LSPs (like 3C 273, see Fig. 14) are therefore detected less efficiently than hard -ray spectra HSP BL Lacs (e.g. Fig. 13), leading to percentages of the two blazar types that do not represent the real cosmic abundance. The 40 to 60 % mix between FSRQs and BL Lacs in the 3LAC sample and the over 95% of HSP BL Lacs in the 2FHL catalogue are just the result of this effect in the HE and VHE -ray energy bands. To understand the intrinsic population properties of blazars is therefore essential to control all the selection biases. To this purpose Giommi, Padovani and collaborators published a series of papers (Giommi et al., 2012; Giommi, Padovani & Polenta, 2013; Padovani & Giommi, 2015; Giommi & Padovani, 2015), where, through a detailed Monte Carlo approach, called the blazar simplified view (BSV), they showed that the widely different statistical population properties of blazars observed in the radio, X-ray and -ray bands can be reproduced in detail starting from simple minimal assumptions. In particular, the BSV correctly predicts the different composition of -ray catalogues in the HE and VHE bands, including percentages of FSRQs/LSPs and BL Lacs/HSPs, spectral slopes, redshift distributions, and contribution to the EGB.
6.7 The future of AGN studies in the -ray band
Building on the technology of current generation IACTs, CTA444444www.cta-observatory.org will be ten times more sensitive and will have unprecedented accuracy in its detection of VHE rays, with more than 100 telescopes located in the northern and southern hemispheres covering the 20 GeV – 300 TeV energy range. Construction should start in 2018, with the first telescopes on site in 2019. CTA will provide a systematic approach to blazar studies, as our knowledge of VHE -ray emission from blazars is very biased and patchy, since many of them have been detected only because they were in outburst (Sect. 6.4).
LHAASO454545english.ihep.cas.cn/ic/ip/LHAASO/ (LHAASO Collaboration, 2016) is a new generation instrument, to be built at 4410 metres of altitude in the Sichuan province of China, with the aim of studying with unprecedented sensitivity the energy spectrum, the elemental composition and the anisotropy of CRs in the energy range between 1012 and 1017 eV, as well as to act simultaneously as a wide aperture ( 2 sr), continuously-operated -ray telescope in the energy range between 100 GeV and 1 PeV.
In the BSV paper dedicated to the VHE -ray band Padovani & Giommi (2015) estimated the number of blazars of the FSRQ and BL Lac type and their redshift distributions expected in future deep VHE surveys. The expectations are largely consistent with the 2FHL catalogue (Ackermann et al., 2016b), which suggests that the BSV might also be a reliable predictor of the average VHE sky that will be probed by the upcoming large new VHE facilities like CTA and LHAASO.
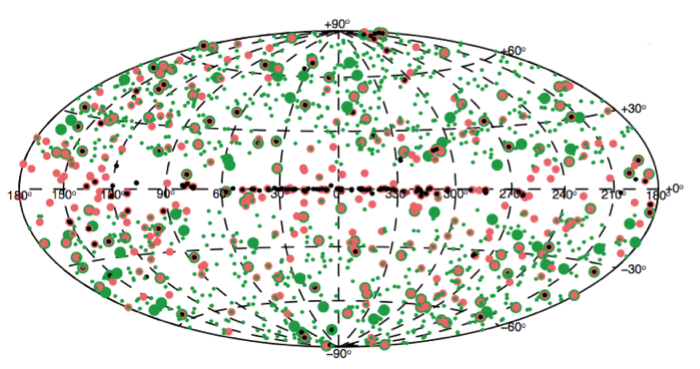
A study based on the subset of 2WHSP and 2FHL common sources, shows that the average (EBL unabsorbed) VHE flux F(E 50 GeV) of HSP blazars can be predicted with an uncertainty of the order of a factor two based on the shape and intensity of their SED synchrotron component. The following preliminary relationship
| (1) |
gives F(E 50 GeV), the VHE flux in units of photons cm-2 s-1, as a function of S, which is the flux at the peak of the SED synchrotron hump in units of erg cm-2 s-1 and of in units of Hz.
To emphasize the rapid evolution of the VHE AGN sky, Fig. 17 shows the distribution of the currently known and predicted VHE AGN in galactic coordinates, including TevCAT sources and Fermi 2FHL objects. 2WHSP sources that are predicted (on the basis of Eq. 1) to be at or above the sensitivity of current IACTs and also detectable by the future CTA are also shown.
7 Variability-selected AGN
We discuss in this section variability-selected AGN. An overview of AGN variability in the local Universe is given in Sect. 7.1, while Sect. 7.2 deals with AGN variability in extragalactic surveys. The future of this field is discussed in Sect. 7.3.
7.1 An overview of AGN variability in the local Universe
Variability of the emitted multi-wavelength (from radio to -ray) radiation has been recognized as one of the main characteristics of AGN as a class (e.g. Angione 1973; Marshall, Warwick, & Pounds 1981). Therefore, just like other diagnostics, variability can be used as a tool to select AGN in extragalactic surveys.
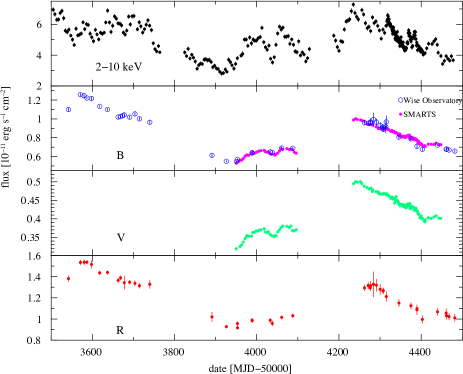
AGN display erratic, aperiodic flux variability over a wide range of timescales (from years to minutes). The distribution of AGN variability power (i.e. the power spectral density [PSD] defined as the squared amplitude of the flux, e.g. Uttley, McHardy, & Papadakis 2002) over timescales (or, equivalently, temporal frequencies) strongly depends on the observing waveband. In other words, for example, much faster variability is observed in the X-ray band than in the optical band, where the same variability amplitude is reached only over longer timescales (Fig. 18). The minimum timescale of variability measured in a given waveband provides us with an estimate of the linear size of the source component emitting in that waveband (e.g. Terrell 1967). The X-ray band is where some of the most rapid (hours-minutes), largest-amplitude flux variations are measured. This variability is thought to originate in the innermost regions of the accretion flow (corona and inner disk). Moreover, it is responsible for driving (at least part of) the variability from the outer accretion disk, observed at longer wavelengths (UV and optical). Processes occurring in the jet can also contribute to the observed AGN variability (e.g. shocks or bulk injection of new particles; Marscher & Gear 1985; Böttcher & Dermer 2010). Variability associated with the jet can dominate in the radio-to--ray bands in jetted AGN (e.g. Max-Moerbeck et al. 2014; see also Sect. 6.1 and Figs. 13 and 14). These variations may ultimately originate from stochastic instabilities within the accretion flow (Malzac 2014). However, whether and how accretion-driven variability is transferred into the jet is not definitely known. In the following we will focus on discussing variability directly associated with the accretion process.
Note that one can indirectly probe AGN variability on much longer timescales by studying powerful past events in nearby galaxies through studies of extended emission line regions. These can then trace the history of AGN emission over the light travel time from the nucleus to the gas (typically years: e.g. Dadina et al., 2010; Keel et al., 2012; Gagne et al., 2014; Davies, Schirmer, & Turner, 2015).
7.1.1 X-ray variability
The availability of long-term monitoring and continuous sampling X-ray observations has allowed us to make significant progress towards a good characterization of X-ray variability in low-redshift AGN. These studies played a key role in our general understanding of AGN variability.

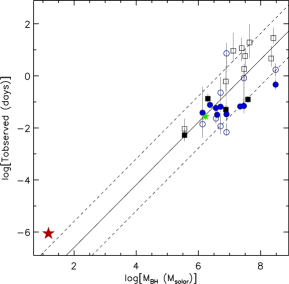
The main property of AGN variability is its “red noise” character, namely the occurrence of larger amplitude variations on longer timescales. This property became evident from early EXOSAT long-looks (e.g. Lawrence et al. 1987). The more recent long monitorings performed by the Rossi X-ray Timing Explorer (RXTE) enabled a detailed characterization of the X-ray PSD. Particularly when combined with continuous but shorter X-ray observations (e.g. by XMM-Newton) they allowed sampling AGN variability over a broad range of timescales (from several years to seconds, Fig. 19, left panel). These studies revealed that the X-ray PSD of AGN has a universal shape, characterized by a steep (spectral index ) high-frequency (i.e. short-timescales) slope. Moreover, they showed that in many AGN the PSD flattens out to a slope of below a characteristic frequency, dubbed “break frequency”, (e.g. Edelson & Nandra 1999; Uttley, McHardy, & Papadakis 2002). Apart from this characteristic frequency, the PSD of AGN is mostly featureless over several decades in frequency464646Notable exceptions are: Ark 564, which shows evidences of a second break at lower frequencies and a more structured PSD (McHardy et al. 2007); REJ 1034+396 and MS 2254.93712, where the presence of quasi-periodic oscillations, QPO, has been reported (Gierliński et al. 2008; Alston et al. 2015).. The existence of a break in the PSD is indicative of corresponding to a physical timescale of the flow at some characteristic radius. There are a number of fundamental physical timescales that might be associated with the timescales of accretion flow variability (e.g. Treves, Maraschi, & Abramowicz 1988). However, these timescales depend also on some unknown parameters such as the viscosity and scale-height of the disk. Therefore, it is difficult to unequivocally associate with one of these timescales. Nonetheless, all the above mentioned timescales depend linearly on . Early indications that also scales (inversely) with were reported in several studies (Edelson & Nandra 1999; McHardy et al. 2004) and finally confirmed by McHardy et al. (2006, see also ), who showed that the correlation becomes tighter after correcting for the accretion rate/bolometric luminosity. Although the exact functional dependence on the accretion rate/bolometric luminosity is currently debated (e.g. González-Martín & Vaughan 2012; Ponti et al. 2012), it is widely accepted that stellar-mass BHs in X-ray binary systems (BHXRBs) lie on the extension of the relation, which holds for SMBHs (Fig. 19, right panel; a similar scaling occurs also in accreting neutron stars and white dwarfs: Körding et al. 2007 and Scaringi et al. 2015). Overall, the striking similarities of the X-ray timing properties of AGN and BHXRBs suggest the existence of a common physical process driving the observed variability.
7.1.2 UV/optical variability
The UV/optical emission of AGN displays highly correlated variability, as expected if produced in the same physical region, the accretion disk. A detailed characterization of UV/optical variability is made difficult by the sparse and irregular sampling of ground-based observations, as well as the relatively long timescales associated with the regions of the disk emitting at these wavelengths (days-months). In recent years, dedicated ground-based campaigns (e.g. Sánchez et al. 2016, Caplar et al. 2017), the use of new powerful analysis approaches (Kelly et al. 2014), and the increasing exploitation of data from space observatories (Kepler and Swift; e.g. Smith et al. 2015) are opening the way to detailed studies of UV/optical variability of AGN. These studies have been revealing properties significantly different from those characterizing X-ray variability (e.g. Mushotzky et al. 2011, Simm et al. 2016), including steeper PSD high-frequency slopes (ranging between and ) and the detection of the PSD break at systematically longer timescales than expected from X-rays ( days) with no clear dependence on .
An important breakthrough in the understanding of UV/optical variability came from the detection of inter-band, red lags (i.e. with longer wavelengths lagging behind shorter wavelengths) on day or sub-day timescales (e.g. Sergeev et al. 2005). These lags are too short to be explained by some form of outwards diffusion in the flow. Therefore, heating from a central X-ray source is considered the most plausible mechanism. Indeed, the derived lag amplitude-wavelength dependence is consistent with that expected from reprocessing of X-rays in a standard disk (e.g. Cackett, Horne, & Winkler 2007; Edelson et al. 2015). In this scenario the lags are dominated by the light crossing time from the X-ray source to the region of the disk emitting at a given wavelength, with longer (red) wavelengths coming from larger radii, thus producing longer lags. Recent analyses of simultaneous X-ray, UV/optical, and IR observations confirmed the disk reprocessing hypothesis, and extended it to explain also the variable emission from the surrounding dusty torus (e.g. McHardy et al. 2014; Vazquez et al. 2015).
Reprocessing of variable X-ray photons in the UV/optical emitting regions of the disk explains why, on timescales of hours-to-days, AGN are more variable in the X-rays than in the UV/optical. However, the availability of long X-ray observations and simultaneous optical monitoring has allowed the extension of these studies to longer timescales, revealing that on month-to-year timescales variations in the optical are more intense than in the X-rays (e.g. Arévalo et al. 2009; Breedt et al. 2010; Uttley et al. 2003). This behaviour cannot be explained by X-ray reprocessing only, but it requires some additional source of intrinsic disk variability dominating on long timescales (Sect. 7.1.3).
7.1.3 What does variability tell us about the driving physical mechanism?
The X-ray PSD of AGN has been extensively studied to gather information about the driving physical mechanism. However, the sole analysis and modelization of the PSD has not led to a clear identification of the underlying process. Indeed, most of the originally proposed models (such as shot-noise models: e.g. Lehto 1989) had difficulties in explaining other X-ray timing properties of both AGN and BHXRBs, such as the observed “rms-flux” relation, whose existence was first shown by Uttley & McHardy (2001) and later confirmed by several studies (e.g. Vaughan et al. 2003; Gaskell 2004; McHardy et al. 2004). This relation indicates that the absolute amplitude of X-ray variability (rms, e.g. Vaughan et al. 2003) is linearly correlated with the flux level, meaning that the source is more variable when it is brighter. The existence of an rms-flux relation implies that the underlying physical process is multiplicative and that the long-term variations should modulate the short-term variations (Gaskell 2004; Uttley, McHardy, & Vaughan 2005).
Such findings argue against models (such as additive shot-noise models) invoking the presence of independent flares or active regions. Rather, it appears that the class of “propagating-fluctuation” models, first introduced by Lyubarskii (1997), are more suitable to explain a vast range of X-ray timing properties, including the rms-flux relation (Arévalo & Uttley 2006; Ingram & van der Klis 2013). These models assume the emergence of local perturbations of disk parameters triggering variations of the accretion rate, with long timescale perturbations produced at larger radii. If the timescale of the perturbations is longer than the radial diffusion time, the perturbations can propagate inward, combining multiplicatively with perturbations produced at smaller radii, and reach the innermost zones where most of the energy is released (e.g. Churazov, Gilfanov, & Revnivtsev 2001; Hogg & Reynolds 2016).
These models can explain the presence of large amplitude X-ray variability on a wide range of timescales, even orders of magnitude longer than the viscous-timescale of the compact X-ray emitting regions of the flow. Moreover, the perturbations produced throughout the disk could be responsible for driving intrinsic UV/optical disk variability (Uttley et al., 2003). This component would explain the excess long-timescales optical variability detected in some AGN (Sect. 7.1.2). Propagating-fluctuation models are also invoked to explain the common detection of “hard” X-ray lags (time-delays of the hard X-ray band variations with respect to soft X-ray band variations) in both AGN and BHXRBs (e.g. Miyamoto et al. 1988; McHardy et al. 2004; Uttley et al. 2011; De Marco et al., 2013, 2015). These lags have large amplitudes, typically of the order of 1% of the variability timescale. By interpreting the lags as due to light-travel time effects, the inferred size of the emitting regions would be too large ( gravitational radii) to be plausible (e.g. Nowak et al. 1999). However, if due to the slower, viscous propagation in the flow the large lags can be easily recovered in standard disk-corona geometries (e.g. Kotov, Churazov, & Gilfanov 2001; Arévalo & Uttley 2006).
Variations of photoelectric absorption, e.g. associated with temporary obscuration of the central engine as a consequence of gas clouds located in the BLR or the torus crossing the observer’s line of sight can also contribute to the observed AGN variability (Risaliti et al. 2011; Cappi et al. 2016). However, this is unlikely to be responsible for the bulk of it, as several arguments and observational evidences rather favour an intrinsic origin. These include: the ubiquity of AGN variability; the universal shape of the PSD; the scaling of characteristic timescales with ; the similarities of timing properties in AGN and BHXRBs; the fact that the inner/outer disk and the BLR directly respond to continuum variations as inferred from results of X-ray (Fabian et al. 2009; Zoghbi et al. 2012; De Marco et al. 2013; Kara et al. 2016) and UV/optical reverberation mapping (e.g. Peterson et al. 2004; Edelson et al. 2015). Moreover, recent studies of long-term (15 years) X-ray variability of distant AGN (: Yang et al., 2016) showed that intrinsic X-ray variability prevails over absorption variability (see also Hernández-García et al. 2015; Soldi et al. 2014), further supporting this conclusion.
7.2 AGN variability in extragalactic surveys
7.2.1 Selecting AGN by variability
Extragalactic surveys are typically characterized by uneven sampling, with large gaps between consecutive cycles. This makes PSD techniques unsuitable for studying variability in these datasets. The identification of variable sources requires assessing whether the variability observed between observations exceeds the variations due to statistical fluctuations. This is usually done by computing the quantity , where denotes the photon flux (e.g. Lanzuisi et al. 2014; De Cicco et al. 2015; Simm et al. 2016; Kozłowski et al. 2016) during each observation, is the average photon flux, and is the measurement error. The statistics tends to a distribution for large photon fluxes (in a low-photon flux regime assessing whether a source is significantly variable requires carrying out MonteCarlo simulations; e.g. Paolillo et al. 2004; Young et al. 2012). Thus, the ability to detect significant variability in single sources depends on the error of each measurement. At a given source flux and exposure, this in turn depends on the collecting area of the detector and the background contribution, which affects the uncertainty on the flux measurements (e.g. Lanzuisi et al. 2014).
Selection on the basis of variability can return a relatively high number of AGN candidates. The latest estimates from optical variability over a temporal baseline of 3 years (De Cicco et al. 2017, in prep.) are 275 deg-2 AGN at a magnitude limit . This corresponds to % completeness with respect to X-ray confirmed AGN at the depth reached in the COSMOS field (Fig. 20, left panel). However, the resulting AGN density strongly depends on the characteristics of the survey - mainly the spanned temporal baseline and sampling cadence, the observing wavelength, the depth of the single exposures - as well as on the AGN type. Some of these aspects are discussed in Sect. 7.2.2.

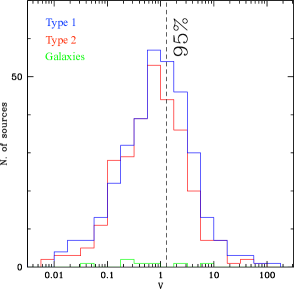
7.2.2 Selection effects
As the bulk of AGN variability appears to be intrinsically associated with the accretion process, any AGN can in principle be selected by variability provided a significant fraction of the emission from the nucleus is directly observable. This requirement makes the X-ray band particularly suitable for the identification of AGN, independently of their classification, thanks to the penetrating power of X-rays and the relatively weak host galaxy emission (Sect. 5.2). As a matter of fact, the number of X-ray variable AGN appears to be type-independent (see Fig. 20, right panel), with X-ray variable type 2 AGN typically showing less variability at longer wavelengths and on similar time scales (e.g. Lanzuisi et al. 2014, Hernández-García et al. 2015). Indeed, in the optical band the completeness of AGN samples selected through variability decreases significantly for type 2 AGN (De Cicco et al. 2015 estimate 25% and 6% completeness respectively for type 1 and type 2 AGN over a temporal baseline of 5 months), while in the X-ray band it is similar for the two classes (e.g. 40% and 32% completeness respectively for type 1 and type 2 AGN, Lanzuisi et al. 2014). Nonetheless, it is important to note that high column densities of circumnuclear absorbing material can significantly affect the fraction of detected X-ray variable AGN, e.g. as a consequence of the increased contribution from a large scale, constant reflector (Paolillo et al. 2004; Hernández-García et al. 2015).
X-ray variability is also suitable for identifying LLAGN, which are missed by other selection criteria (Young et al. 2012). Systematic X-ray variability studies showed that, given good statistics, variability can be detected in a high fraction of AGN (e.g. Paolillo et al. 2004; Lanzuisi et al. 2014; Soldi et al. 2014; Yang et al. 2016) independently of the optical classification of the object or its radio loudness (note that in jetted AGN the X-ray variability can contain a very significant contribution from the jet: e.g. Lichti et al. 2008; see also Figs. 13 and 14).
The effectiveness of variability as a tool to select AGN is strongly related to the temporal baseline spanned by the observations and the depth of a single frame. Indeed, given the red-noise character of the PSD of AGN, the ability of detecting variability is higher at longer timescales (see Fig. 20, left panel), particularly when the low-frequency part of the PSD below is sampled. In the X-ray band, scales inversely with and directly with the accretion rate/bolometric luminosity (but see discussion in Sect. 7.1.1), thus the sampling of longer timescales also allows detection of variability over a wider range of and . In the UV/optical this scaling is not clearly observed (Simm et al. 2016), but the break is measured at systematically longer timescales than in the X-rays (Sect. 7.1.2). Therefore, the longer the maximum sampled timescales, the higher the detection fraction and, at least as far as the X-rays are concerned, the larger the range of and probed. Note that time dilation effects reduce the effective range of sampled timescales. Therefore, given a total exposure time, the more distant a quasar is the more likely it is to intercept the high-frequency part of the PSD, where the variability power drops rapidly, thus making detection of variability more difficult and limited by statistics.
7.2.3 Variability dependence on luminosity and redshift
In the presence of uneven, gappy data, variability can be quantified using the so-called normalized excess variance (; e.g. Nandra et al. 1997; Vaughan et al. 2003; Ponti et al. 2012; see also Kelly et al. 2014), which provides an estimate of the amplitude of intrinsic source variability over the sampled timescales. Biases associated with measurements of have been extensively studied by Allevato et al. (2013, see also ). These biases can be greatly reduced choosing an appropriate observing strategy (e.g. planning observations separated by constant temporal gaps), while “ensemble” estimates (i.e. obtained by averaging over single estimates from multiple light curves of the same source, or from single light curves of many sources with similar properties) should be preferred.
Deriving a reliable estimate of is important in order to properly analyze global variability properties of different AGN classes, to study correlations with fundamental parameters, and to investigate the evolution of variability with redshift. These studies have shown that variability is anti-correlated with luminosity in several wavebands (e.g. in the X-rays: Ponti et al. 2012; Lanzuisi et al. 2014 and references therein; in the optical/MIR: Hook et al. 1994; Kelly, Bechtold, & Siemiginowska 2009; MacLeod et al. 2010; Zuo et al. 2012; Kozłowski et al. 2016; Simm et al. 2016). The origin of this anti-correlation is currently unknown, but, at least in the X-rays and on relatively short timescales (shorter than ), this correlation seems to be the byproduct of a more fundamental anti-correlation of variability with ultimately driven by the scaling of the PSD break (e.g. Czerny et al. 2001; Papadakis 2004; O’Neill et al. 2005; Nikołajuk et al. 2006; Zhou et al. 2010; Ponti et al. 2012; Lanzuisi et al. 2014). The - relation is very tight, with an estimated scatter of the order of the uncertainties on (Zhou et al. 2010; Ponti et al. 2012). These findings reinforce early suggestions that could be used to estimate (Czerny et al. 2001; Nikołajuk, Papadakis, & Czerny, 2004; Nikołajuk et al., 2006, Gierliński, Nikołajuk, & Czerny 2008).
Several studies also showed that both X-ray and optical variability tend to be stronger at higher redshifts, but this appears to be a consequence of selection effects (e.g. Cid Fernandes, Aretxaga, & Terlevich 1996; Almaini et al. 2000; Manners, Almaini, & Lawrence 2002; Paolillo et al. 2004; Lanzuisi et al. 2014; Morganson et al. 2014; Simm et al. 2016; Yang et al. 2016; Paolillo et al. 2017). Therefore, to date there are no clear indications of an evolution of AGN variability with redshift.
7.3 The future of AGN variability studies
Variability is a defining property of AGN, therefore a fundamental tool to understand the AGN engine and map its close environments. Due to its diagnostic power and complementarity to other probes, variability is gaining increasing importance in the census of the AGN population. The recognized relevance of AGN variability studies is mirrored by the growing number of future missions and facilities that include the investigation of the variable Universe amongst their science goals. Among these is eROSITA (Merloni et al. 2012; see also Sect. 5.4), due to launch in spring 2018. During its four years of operation eROSITA will perform a deep survey of the entire sky at X-ray wavelengths. The planned monitoring strategy (eight all-sky surveys and a cadence of six months, with the ecliptic poles being monitored at higher pace) will provide repeated observations of the same portions of the sky. Ultimately, this will allow sampling AGN X-ray variability over time scales from 250 s (corresponding to the daily eROSITA exposure) up to 4 years (corresponding to the scheduled duration of the survey phase). Based on AGN X-ray variability characteristics and scaling properties (Sect. 7.1.1), eROSITA is expected to detect around 60,000 variable AGN in the full sky (and many more overall: Sect. 5.4).
In the far future, Athena (Nandra et al. 2013; see also Sect. 5.4) is expected to greatly advance our knowledge of AGN X-ray variability. Thanks to its large collecting area, the sensitivity of X-ray variability measurements will be significantly enhanced. This will have a great impact on our understanding of the accretion process variability, it will allow the mapping of the close environments of AGN and will assess the role of AGN winds and outflows and their influence on the observed X-ray variability properties.
The exploration of the transient and variable sky is one of the driving science theme of several future facilities that will operate at longer wavelengths. In the optical band these include the Zwicky Transient Facility (ZTF474747www.ptf.caltech.edu/ztf), a high-cadence, 3-year, time-domain survey, starting in summer 2017. However, the currently most ambitious planned survey in the optical band is the LSST, starting operations in 2022 (LSST Science Collaboration et al. 2009). LSST is designed to uniformly observe an area of deg2, with about visits per source for each of the six filters, over an operation period of ten years. This cadence will probe optical variability on time scales ranging between 1 minute and one decade, allowing selection of tens of millions of AGN and the construction of highly-complete catalogues with minimum contamination. Finally, variability studies of radio-emitting AGN will be one of the main science goals of the SKA (Sect. 2.4), which is expected to provide a deluge of AGN radio variability information.
8 Summary
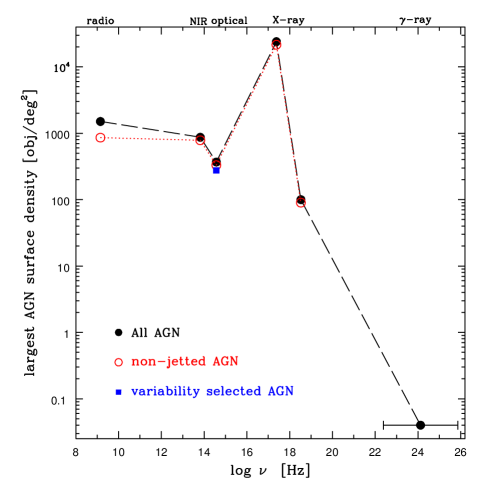
This review highlights the extraordinary diversity of observational signatures produced by growing SMBHs, and illustrates the challenges of placing all these observations into a coherent picture. AGN are complex systems exhibiting a wide range of phenomena, and different classes of AGN can be selected across the full range of the electromagnetic spectrum (Fig. 21). The efficiency of selection of AGN in various wavebands is the result of: (1) variations in the underlying physical properties of AGN; (2) observational capabilities; (3) selection effects.
The first consideration relates to physical effects (introduced in Sect. 1 and discussed throughout this review). The most straightforward of these is the presence or absence of a strong relativistic jet, leading to the distinction between jetted and non-jetted AGN as discussed in Sect. 2. As detailed in Sect. 2.1.3 and shown in Fig. 21, the latter class is fainter in the radio and absent in the -ray band (Sect. 6), highlighting how AGN selection can be affected by variations in the physical properties of different AGN populations. Other physical effects include changes in the accretion flow with (which can modify the shape of the intrinsic SED, in particular the relative outputs in the optical/UV and X-ray bands; e.g. Vasudevan & Fabian 2009; Yuan & Narayan 2014), and obscuration by gas and dust that can highly suppress emission in the NIR through soft X-rays (Sects. 3 – 5).
Second, observations in some wavebands are more sensitive than others relative to the typical AGN SED. For example, the current generation of radio telescopes (Sect. 2) can probe AGN with far smaller bolometric fluxes, compared to contemporary -ray observatories (Sect. 6), yielding a far higher surface density of detected AGN.
Third, AGN selection techniques (due to luminosity, colour, morphology, variability, etc.) have different levels of efficiency in different wavebands. Of particular importance is the relative emission of the AGN compared to its host galaxy. At wavelengths at which stellar processes in the host galaxy can be particularly luminous (e.g. optical, IR, and to some extent the radio), it is challenging to select extremely faint AGN even in the deepest observations (although well-designed techniques using colours or emission line characteristics can help minimize contamination). By contrast, host contamination is particularly low in the X-ray band (Sect. 5), and cutting-edge X-ray observatories are capable of extremely deep observations. Simple X-ray luminosity selection can therefore probe AGN at very faint fluxes, leading the detected AGN surface density to be highest in this band (Fig. 21).
We note that by multiplying the largest entry in Fig. 21 by the area of the sky we estimate that there are at least billion AGN in the Universe that could be detected with current technology. This number needs to be compared with the number of currently known AGN, of the order of a million (Fig. 6), which shows the exciting potential for discovery in future AGN surveys (as detailed in Sects. 2.4, 3.5, 4.6, 5.4, 6.7, and 7.3). We can also compare it with the number of currently observable galaxies in the Universe, billion (Conselice et al., 2016), indicating that bright AGN are found in approximately 1% of galaxies.
| Band | Type | Physics | Selection biases/weaknesses | Key capabilities/strengths |
|---|---|---|---|---|
| Radio, mJy | jetted | jet | non-jetted sources | high efficiency, |
| no obscuration bias | ||||
| Radio, mJy | jetted and non-jetted | jet and SF | host contamination | completeness, |
| no obscuration bias | ||||
| IR | type 1 and 2 | hot dust | completeness, reliability, | weak obscuration bias, |
| and SF | host contamination, no dust | high efficiency | ||
| Optical | type 1 | disk | completeness, low-luminosity, | high efficiency, |
| obscured sources, host contamination | detailed physics from lines | |||
| X-ray | type 1 and (most) 2 | corona | very low-luminosity, | completeness, low |
| heavy obscuration | host contamination | |||
| -ray | jetted | jet | non-jetted, | high reliability |
| unbeamed sources | ||||
| Variability | all (in principle) | corona, | host contamination, obscuration, | low-luminosity |
| disk, jet | cadence and depth of observations |
Table 3 summarizes the selection biases and key capabilities (in other words, the weaknesses and the strengths) in different bands, as described above and in detail throughout this review. Despite the significant differences between AGN classes detected in some bands, the observations highlighted in this review illustrate that AGN share some common components over a wide dynamic range (up to 12 orders of magnitude) in physical scales. In what follows, we will describe this basic “architecture” of an AGN in the context of the observational signatures described in the review. We will then discuss our present understanding of AGN unification models, highlighting the need for a more complex picture than the classic “strict” unification, and discussing the importance of understanding relevant timescales in interpreting observations. Finally, we will present a broad framework for an emerging picture of AGN and their host galaxies in light of the exciting recent advances such as those presented in this review and will conclude by highlighting some future prospects and open questions.
8.1 Fitting together the components of an AGN
Based on the current observational knowledge of AGN as discussed throughout this review, we can now assemble the different components, covering a wide range of physical scales, that together make up the complete picture of the AGN phenomenon.
Black hole (– pc)– The fundamental element common to all AGN is of course the central BH itself. Astrophysical BHs are simple objects whose only distinguishing characteristics are mass and spin, but as we have seen throughout this review, these two parameters are critically important in determining the observable features of an AGN. It is a nearly universal feature of AGN selection that more massive BHs are easier to detect, because the mass of the BH sets the Eddington limit, and so massive BHs are more luminous at a given (Sect. 3.2.5 and 5.3). (The exception here is selection via X-ray variability, for which characteristic frequencies vary inversely with , so that detecting more massive BHs requires longer timescale observations, as described in Sect. 7.1.1.) The effects of BH spin are far more difficult to understand observationally, but rapidly spinning BHs may have accretion disks that extend closer to the event horizon, producing a bluer SED (see below) with a higher radiative efficiency, and may influence the ability of accreting BHs to launch relativistic jets and radiation line-driven winds.(e.g. Tchekhovskoy et al., 2011; Narayan et al., 2014).
Accretion flow (– pc)– The accretion flow onto the BH is the ultimate energy source in AGN and the most important component in determining their observational characteristics. Indeed, turning a normal galaxy into an AGN merely requires a SMBH accreting at a relatively high accretion rate. There is compelling theoretical and observational evidence that the structure of the flow changes with (e.g. Narayan & Yi, 1994; Vasudevan & Fabian, 2009; Yuan & Narayan, 2014), with higher systems producing stronger emission from an optically-thick accretion disk in the optical and UV (e.g. Slone & Netzer, 2012; Netzer & Trakhtenbrot, 2014; Capellupo et al., 2015; Castelló-Mor, Netzer, & Kaspi, 2016; Bertemes et al., 2016) and stronger radiation line-driven winds (e.g. Laor & Davis, 2014).
The structure of the flow also appears to influence emission from the magnetic corona (with lower systems having stronger X-rays relative to the disk emission: Sect. 5.1) and is also connected to the launching of relativistic jets, with luminous radio emission observed to be more common in lower systems (see references in Sect. 2). Changes in the accretion flow are also the source of the bulk of observed variability in AGN. As discussed in Sect. 7, the variability is observed over a wide range of timescales from the optical to the X-rays, likely corresponding to characteristic (e.g. viscous) time scales at various radii in the accretion disk (although there is also some interplay due to reprocessing of emission from different regions). The nature of the variability changes with further illustrating the dependence on the structure of the flow.
Torus (– pc)– The putative torus of gas and dust surrounding the central engine in the AGN is critical to understanding two key observational phenomena: emission from the AGN in the IR, and obscuration of the accretion disk and corona emission (see also Netzer 2015 for a review). As discussed in Sect. 3.1, the majority of the MIR light from luminous AGN is emission from hot dust. The geometric distribution (smooth or clumpy, axisymmetric or polar) and kinematics (static, inflowing, or outflowing) of the dusty material are however still uncertain, as is their connection to the accretion flow on larger and smaller scales. At minimum, it is now well-established that the structure of the torus is not universal but vary significantly for AGN types and even within an individual class (Sect. 3.2.4). This variation in the dusty torus also has implications for AGN obscuration, as the covering factors of obscuring material can differ significantly for different AGN, and variations in torus structure can affect the observed column densities, extent, and time variability of the obscuration. We can ultimately conclude that the dusty torus is a common component of AGN that is critical for understanding observations, but its physical nature is uncertain, variable, and complex.
Jet (– pc)– Another important but poorly understood component of the AGN phenomenon is the presence and strength of a relativistic jet. Jets dominate the emission from AGN in the -rays and often in the radio band (as discussed in Sects. 2 and 6), and can make important contributions in the X-rays and (in the case of blazars) across the whole SED. The structure and orientation of the jet can influence a range of rich observational phenomena, particularly in the radio and -rays; indeed the majority of the AGN classes presented in Tab. 1 relate in some way to the presence of a jet. However, despite jet emission being among the best- (and earliest-) studied aspects of AGN, the physical nature of AGN jets and the prevalence of relativistic outflows, particularly low-luminosity jets on small scales, remain uncertain.
Host galaxy and dark matter halo (– pc)– In understanding the observational signatures of AGN it is essential to account for the host galaxies and large-scale structures in which the BHs reside (see Hickox et al. 2016 for a review). One important consideration is the effect of host galaxy dilution (or equivalently, “contamination”) on AGN selection, which are spelled out in detail in this review, particularly in the radio, IR, optical, and X-ray bands (Sects. 2 – 5). In all cases, this contamination leads to uncertainties in the population of faint AGN. It also produces a bias in AGN selection toward higher , an effect which is strongest in the IR and optical bands, and serves as motivation for observations at high angular resolution that can separate the AGN emission from the stellar processes in the surrounding galaxy (e.g. Gandhi et al., 2009; Simmons et al., 2011). The properties of gas in host galaxies can also have a physical influence on the fueling and emission from AGN. Some AGN obscuration originates on galaxy scales much larger than the putative dusty torus (e.g. Chen et al., 2015; Buchner et al., 2017), and connections between physical AGN properties (for example the distinction between HEG and LEG line classifications, indicating different : Sect. 2.1.4) and the stellar populations of host galaxies indicate that the gas supply for BH accretion can be connected to the larger-scale reservoir from which stars form in the host galaxy (e.g. Hickox et al., 2009; Smolčić et al., 2009; Smolčić, 2009; Azadi et al., 2015). Finally, the interaction between AGN and gas in surrounding dark matter halos can have important effects on observed phenomena, particularly with hot spots, lobes, and wide-angle tails in large-scale relativistic jets (e.g. Hardcastle, 2015).
8.2 Unification and the importance of timescales
Piecing together our current understanding of the various components of an AGN and their observational signatures, we can begin to re-assess the extent to which the full AGN population can be explained by a “unified” model that reduces the complex AGN “zoo” described in Sect. 1 (Tab. 1) to a relatively small set of parameters.
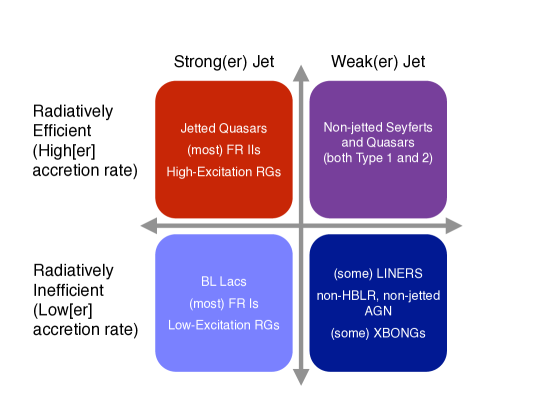
In the most straightforward “strict” unified model, the only parameter is orientation relative to an axisymmetric dusty torus and relativistic jet (Antonucci, 1993; Urry & Padovani, 1995). In broad terms this model has been remarkably successful in connecting type 1 and 2 Seyferts, and FSRQs and HEGs. In addition to the presence or absence broad lines, orientation can also help explain the details of the line profiles; for example, Shen & Ho (2014) suggest FWHM(H) is more of an indicator of orientation than mass. However, the evidence presented in this review and elsewhere (see Netzer 2015 for a comprehensive overview) suggests that a picture based primarily on orientation and obscuring material is incomplete. While the structure of AGN clearly deviates from spherical symmetry and so there is some orientation dependence on observed properties, other parameters also have key effects. Of particular importance is , which can change the structure and emission properties of the accretion flow and thus the SED shape and excitation properties of surrounding gas (Sect. 8.1), and can also impact the detectability of AGN over emission from the host galaxy.
Even at a fixed , the structure of the AGN is not universal. For example, the dusty torus can have a range of covering factors (producing a statistical difference in the intrinsic properties of objects that are observed to be type 2 as opposed to type 1: Sect. 3.2.4), and the strength of a relativistic jet can vary, yielding very different multi-wavelength signatures particularly in the radio and -rays (as discussed in Sects. 2 and 6). Further, obscuration of the AGN or dilution of stellar processes can be produced in the host galaxy, independent of the small-scale orientation of the central engine (e.g. Chen et al., 2015; Buchner et al., 2017). A more complete “weak” unified model is one in which all these components (, torus covering factor, jet strength, and host galaxy properties as well as orientation) come together to produce the observed signatures of an AGN. A schematic showing the effects of just two of these parameters, BH accretion rate (BHAR) and jet strength, is shown in Fig. 22. An important distinction is that these parameters, as well as the others described above, comprise a continuous distribution. Therefore the separate AGN classes sample different parts of this distribution rather than representing truly distinct populations, extending the picture for the dominance of radio jets presented by Padovani (2016).
It is also important to note that the parameters that determine AGN properties will naturally be expected to vary with time. This has motivated another sort of “unification”, in which AGN represent the same underlying objects viewed at different points in their evolution. One example of this is the classic merger evolution scenario, in which a galaxy merger triggers gas flows that fuel an AGN, starting off obscured until feedback clear the surroundings of the black hole producing an unobscured object (e.g. Sanders et al., 1988; Hopkins et al., 2008). While there is compelling evidence for time evolution in some cases (for example large-scale radio jets are likely to have evolved from more compact relativistic outflows) it is challenging to construct a successful unification picture based on time evolution alone. This difficulty arises from the relative time and spatial scales: while galaxy evolution processes can take years or more and on scales of kpc, variations in nuclear structures, gas flows, and BHARs can occur on timescales many orders of magnitude shorter (e.g. Hickox et al. 2014; Fig. 23) as evidenced by hydrodynamic simulations (e.g. Novak et al., 2011) and AGN light echoes (Keel et al., 2012; Schawinski et al., 2015) that point toward large-amplitude fluctuations in AGN luminosity on timescales of – years. Thus an AGN cannot directly “know” about a galaxy merger or other processes that happen on large galactic scales. While there may be some connection between galaxy-scale processes and the instantaneous observed signatures of an AGN, these will be primarily statistical in nature (e.g. Hickox et al., 2009; Goulding et al., 2014; Azadi et al., 2015).
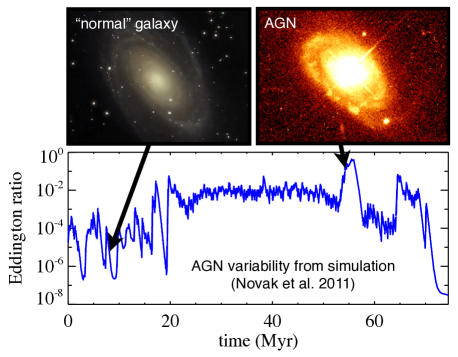
8.3 The emerging technicolor picture
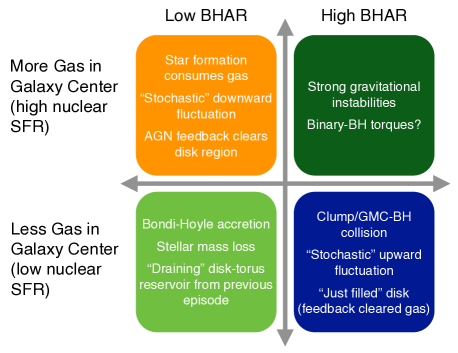
With this reasoning in mind, there is emerging a general picture to describe the “technicolor” properties of AGN and their host galaxies that is based on the statistical relationships between BH and galaxy evolution. In this picture, BHARs are broadly correlated with the supply of gas (and thus SFR) in the centres of galaxies, but can vary dramatically over several orders of magnitude in response to processes (instabilities, feedback, etc.) that occur on small scales. A schematic showing the range of physical processes involved in different regimes of BHAR and a galaxy’s central gas supply is shown in Fig. 24.
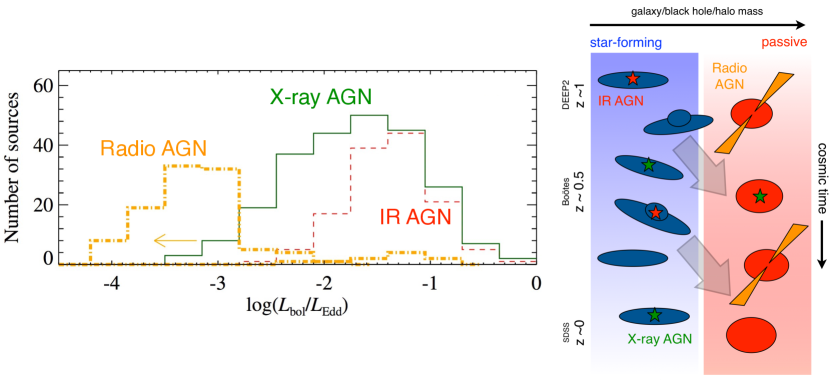
The key point is that any type of galaxy can in principle host AGN with a wide range of observational signatures, but broad correlations between gas supply and BHAR introduce some important general trends (e.g. high , IR-selected AGN being found in SFGs, while low LERGs are found primarily in passive galaxies; Fig. 25).
8.4 The future and open questions
There are exciting prospects for future progress in studies of AGN over the coming decades. Many of the potential breakthroughs come from new observational resources, in particular observations at high resolution and sensitivity. On the theoretical side, increasingly sophisticated and complex simulations of AGN will inform the nature of the central engine and of AGN feedback. Here we briefly discuss each of these avenues for progress, and conclude with a survey of interesting open questions in the field.
New observations at high resolution and sensitivity.– One critical observational capability in studying the AGN central engine is the ability to directly resolve the relevant small scales with correspondingly high sensitivity. Recently, NIR adaptive optics and particularly interferometric observations have provided new insights about the structure of the AGN torus (Sect. 3.1). ALMA is already resolving the innermost parts of nearby AGN, such as NGC 1068 (Gallimore et al., 2016; García-Burillo et al., 2016; Imanishi, Nakanishi, & Izumi, 2016) and NGC 1097 (Hatziminaoglou et al. in prep., Izumi et al. in prep.) down to a few parsec scales, providing new insights into the dynamics near the SMBH by resolving its sphere of influence, the existence of the torus and the feeding of the SMBH, and is promising more ground-breaking results once the high frequency bands are offered in the longest baselines (km). ALMA, in collaboration with the Global mm-Very Large Baseline Interferometry (VLBI) Array484848http://www3.mpifr-bonn.mpg.de/div/vlbi/globalmm/ and the Event Horizon Telescope494949www.eventhorizontelescope.org consortia, is also trying to directly observe for the first time the immediate environment of the SMBH in, amongst others, M 87, OJ 287, and Cen A, with angular resolution comparable to the event horizon, as part of the Cycle 4 mm-VLBI campaign, building on previous work (e.g. Johnson et al., 2015; Fish et al., 2016). With the launch of JWST and the advent of 30m class ground-based telescopes, we will see a dramatic improvement in the ability to study the morphologies and spectral properties of the central engine on small scales. In the radio and submm, advances in interferometry (including along Earth-scale baselines) have the potential to bring further insights into the nature of AGN jet acceleration, mechanical feedback, and gas content and kinematics. Planned or large space missions or concepts in the X-rays (e.g. Athena, Lynx505050wwwastro.msfc.nasa.gov/lynx/) and optical/UV (e.g. HabEx515151www.jpl.nasa.gov/habex/, LUVOIR525252asd.gsfc.nasa.gov/luvoir/), along with a range of other potential missions (some of which are discussed throughout this review), will enable the study of AGN phenomena with high sensitivity and spectral and/or spatial resolution.
Large sky survey data sets.– All areas of astronomy are being revolutionized by increasingly larger and deeper sky surveys at all wavelengths, and this flood of data has the potential for major breakthroughs in our understanding of AGN. As shown in Fig. 21, X-ray surveys are the most efficient for detecting a high surface density of AGN with minimal host galaxy contamination. The next major X-ray survey will be the eRosita All Sky Survey (eRASS) by the eROSITA instrument (Sect. 5.4), which will detect 3 million AGN over most of the sky, with ground-based optical spectroscopic follow-up from multiple planned surveys. Further deep, wide surveys with Athena, Lynx, and other future X-ray missions would probe large numbers of AGN over a wider parameter space in redshift and luminosity.
In the optical and NIR, the Euclid and WFIRST satellite missions will perform wide-area surveys characterizing millions of AGN (Sect. 3.5 and 4.6), while dedicated ground-based surveys (for example from the LSST, the Subaru Prime Focus Spectrograph535353pfs.ipmu.jp/, and the Multi Object Optical and Near-infrared Spectrograph for the VLT [MOONS]545454www.eso.org/sci/facilities/develop/instruments/MOONS.html) will build on the legacy of ongoing surveys (for example DES and SDSS-IV). At longer wavelengths, the growing number of sensitive, wide-area radio telescopes (leading ultimately toward the SKA) will provide increasing numbers (in the tens of millions: Sect. 2.4) of radio-selected AGN across most of the sky. Together, these surveys will produce massive data sets with huge statistical samples of images, spectra, and time variability of AGN over a wide range in redshift and luminosity, and will enable statistical analyses of AGN with precision comparable to what is currently possible for “normal” galaxies. Harnessing these large data sets represents a major challenge and opportunity for the future of AGN science.
Hydrodynamic simulations.– Major theoretical challenges in understanding the AGN arise from the complexity of the physical processes involved and the enormous dynamic range in the relevant physical scales. With continual advances in computing power and improvements in astrophysical codes, theorists will continue to approach the ultimate goal of resolving the physics of AGN on all the scales described in Sect. 8.1, the structure and kinematics of the torus and central engine (e.g. Chan & Krolik, 2016; Namekata & Umemura, 2016; Wada, Schartmann, & Meijerink, 2016), the physics of the inner accretion flow and the launching of winds and relativistic jets (e.g. Tchekhovskoy, 2015; Waters & Proga, 2016), and the impact of this feedback on host galaxies and halos (e.g. Dubois et al., 2016; McAlpine et al., 2017; Weinberger et al., 2017). Coupled with an improved understanding of the underlying physics, emission mechanisms, and prescriptions for radiative transfer (e.g. Jud et al., 2017; Hopkins et al., 2017), these simulations will be critical for interpreting the high-resolution, high-sensitivity observations described above.
Forward modelling of selection effects.– As discussed in depth throughout this review, an important difficulty in piecing together the AGN population is understanding the wide array of selection effects due to physical variation among AGN, host galaxy contamination, and observational limitation. Many previous studies have attempted to invert these selection effects to recover the intrinsic AGN population studied in a particular waveband. However, with a proliferation of multi-wavelength data on large samples of AGN, it is increasingly challenging to successfully account for selection effects across multiple bands simultaneously. There is therefore great potential for progress from forward-modelling these effects by producing a simulated population of AGN with various physical characteristics (e.g. luminosities, redshifts, , dust obscuration, and host galaxy properties) and then producing simulated SEDs and other observables for direct comparisons to data (for recent examples of this method see Jones et al. 2016).
This approach is made particularly powerful in combination with large hydrodynamic or semi-analytic simulations of galaxy formation (for just a few examples, see Hirschmann et al., 2014; Schaye et al., 2015; Dubois et al., 2016; Di Matteo et al., 2017), which provide realistic populations of galaxies that enable a robust accounting for host contamination and connections between AGN and galaxy properties. This forward-modelling approach, informed by a better understanding of AGN physics and future high-resolution and high-sensitivity AGN observations, will move us closer to a complete “unification” of AGN that can account for the properties of the large AGN populations to be discovered in the next generation of surveys.
These exciting observational and theoretical resources in the coming decades will be critical in answering the many interesting open questions that remain about the AGN phenomenon. Following the structure of this review, we discuss some outstanding problems related to AGN observed using each technique, plus general questions regarding the full AGN population:
-
•
Radio: What is the physical driver of AGN outflows, and in particular relativistic jets? How does the nature of these outflows change as a function of BH mass and accretion rate, and what processes (for example spin) explain the existence of jetted AGN that otherwise look (almost) identical to non-jetted AGN?
-
•
IR: What is the composition, geometry, and morphology of the AGN torus, and how is its structure related to the accretion flow and/or AGN feedback?
-
•
Optical: What is the physics of AGN emission lines and how can they be used to probe the physics of outflows? What are the emission line characteristics of high-redshift obscured quasars, and why are these currently rare in optical surveys?
-
•
X-rays: What is the origin, geometrical configuration, and energy source of the corona? How do the AGN detected in X-ray surveys (which are the most efficient method for uncovering AGN) trace the underlying full population of AGN?
-
•
-rays: What is the connection between -ray emission from AGN and high-energy particles (neutrinos and CRs), and how can these observations constrain theoretical models for particle acceleration in AGN?
-
•
Variability: What is the physical driver of AGN variability as observed in different wavebands? Can X-ray variability be used as an independent indicator of BH mass?
-
•
General: What is the complete census of the AGN population as observed at all wavebands (and those still undetected)? How does the cosmic history of BH accretion, as traced by the complete AGN population, compare to the history of SF? What are the physical connections between the evolution of BHs and that of their host galaxies and halos, and are these driven by common sources of gas, feedback processes, or other effects?
In summary, the future of AGN studies is very bright and we will soon be flooded with exciting new data. We need to be ready to extract as much information as possible from these observations by asking the right questions and using the appropriate tools, so that we can most effectively piece together the physical nature of AGN and uncover the full cosmic evolution of growing black holes.
Acknowledgements.
We thank the participants of the AGN Workshop “Active Galactic Nuclei: what’s in a name?” (see full list at www.eso.org/sci/meetings/2016/AGN2016/participants.html) for their presentations, Lisa Kewley, John Silverman, and Sylvain Veilleux for their role in the SOC, Phil Hopkins for his summary talk, Chris Harrison for producing Fig. 1, and Sarah Gallagher, Darshan Kakkad, Andrea Merloni, Kevin Schawinski, and an anonymous referee for reading the paper and providing helpful comments. DMA thanks the Science and Technology Facilities Council (STFC) for support through grant ST/L00075X/1, and James Aird and Bret Lehmer for useful critical feedback. RJA was supported by FONDECYT grant number 1151408. BDM thanks D. De Cicco for helpful discussions and acknowledges support from the European Union’s Horizon 2020 research and innovation programme under the Marie Skłodowska-Curie grant agreement No. 665778 via the Polish National Science Center grant Polonez UMO-2016/21/P/ST9/04025. GTR is grateful for the support of NASA-ADAP grant NNX12AI49G, NSF grant 1411773, and the Alexander von Humboldt Foundation. VS acknowledges support from the European Union’s Seventh Framework Programme under grant agreement 337595 (ERC Starting Grant, ’CoSMass’).References
- Abdo et al. (2010) Abdo A.A., Ackermann M., Ajello M., et al. (2010) The Spectral Energy Distribution of Fermi bright blazars. Astrophys J 716: 30-70. doi:10.1088/0004-637X/716/1/30
- Abdo et al. (2010b) Abdo A.A., Ackermann M., Ajello, M., et al. (2010b) The Fermi-LAT High-Latitude Survey: Source Count Distributions and the Origin of the Extragalactic Diffuse Background Astrophys J 720: 435. doi:10.1088/0004-637X/720/1/435
- Acciari et al. (2011) Acciari V.A., Aliu E., Arlen T., et al. (2011) TeV and Multi-wavelength Observations of Mrk 421 in 2006-2008 Astrophys J 738: 25. doi:10.1088/0004-637X/738/1/25
- Acero et al. (2015) Acero F., Ackermann M., Ajello M., Albert A., Atwood W. B., Axelsson M., Baldini L., Ballet J., et al. (2015) Fermi Large Area Telescope Third Source Catalog. Astrophys J Suppl 218: 23. doi:10.1088/0067-0049/218/2/23
- Ackermann et al. (2012a) Ackermann M., Ajello M., Allafort A., Baldini L., Ballet J., Barbiellini G., Bastieri D., Bechtol K., et al. (2012a) Search for Gamma-ray Emission from X-Ray-selected Seyfert Galaxies with Fermi-LAT. Astrophys J 747: 104. doi:10.1088/0004-637X/747/2/104
- Ackermann et al. (2012b) Ackermann M., Ajello M., Allafort A., Baldini L., Ballet J., Bastieri D., Bechtol K., Bellazzini R., et al. (2012b) GeV Observations of Star-forming Galaxies with the Fermi Large Area Telescope. Astrophys J 755: 164. doi:10.1088/0004-637X/755/2/164
- Ackermann et al. (2012c) Ackermann M., et al. (2012c) The Imprint of the Extragalactic Background Light in the Gamma-Ray Spectra of Blazars. Science 338: 1190. doi:10.1126/science.1227160
- Ackermann et al. (2013) Ackermann M., Ajello M., Allafort A., et al. (2013) The First Fermi-LAT Catalog of Sources above 10 GeV. Astrophys J Suppl , 209: 34. doi:10.1088/0067-0049/209/2/34
- Ackermann et al. (2015a) Ackermann M., Ajello, M., Albert, A., et al. (2015a) The Spectrum of Isotropic Diffuse Gamma-Ray Emission between 100 MeV and 820 GeV. Astrophys J 799: 86. doi:10.1088/0004-637X/799/1/86
- Ackermann et al. (2015b) Ackermann M., Ajello M., Atwood W. B., Baldini L., Ballet J., Barbiellini G., Bastieri D., Becerra Gonzalez J., et al. (2015b) The Third Catalog of Active Galactic Nuclei Detected by the Fermi Large Area Telescope. Astrophys J 810: 14. doi:10.1088/0004-637X/810/1/14
- Ackermann et al. (2016a) Ackermann M., Ajello M., Atwood W. B., et al. (2016a) 2FHL: The Second Catalog of Hard Fermi-LAT Sources. Astrophys J Suppl , 222: 5. doi:10.3847/0067-0049/222/1/5
- Ackermann et al. (2016b) Ackermann M., Ajello, M., Albert, A., et al. (2016b) Resolving the Extragalactic gamma-ray background above 50 GeV with the Fermi Large Area Telescope. PhRvL 116: 1105. doi:10.1103/PhysRevLett.116.151105
- Aharonian (2000) Aharonian F. A. (2000) TeV gamma rays from BL Lac objects due to synchrotron radiation of extremely high energy protons. New Astr. 5: 377. doi:10.1016/S1384-1076(00)00039-7
- Aharonian et al. (2005) Aharonian F., Akhperjanian A.G., Aye K.M., et al. (2005) Observations of Mkn 421 in 2004 with HESS at large zenith angles. Astron Astrophys 437: 95. doi:10.1051/0004-6361:20053050
- Aird et al. (2012) Aird J., Coil A. L., Moustakas J., Blanton M. R., Burles S. M., Cool R. J., Eisenstein D. J., Smith M. S. M., et al. (2012) PRIMUS: The Dependence of AGN Accretion on Host Stellar Mass and Color. Astrophys J 746: 90. doi:10.1088/0004-637X/746/1/90
- Aird et al. (2013) Aird J., Comastri A., Brusa M., Cappelluti N., Moretti A., Vanzella E., Volonteri M., Alexander D., et al. (2013) The Hot and Energetic Universe: The formation and growth of the earliest supermassive black holes. arXiv:1306.2325
- Aird et al. (2015) Aird J., Coil A. L., Georgakakis A., Nandra K., Barro G., Pérez-González P. G. (2015) The evolution of the X-ray luminosity functions of unabsorbed and absorbed AGNs out to 5. MNRAS 451: 1892-1927. doi:10.1093/mnras/stv1062
- Ajello et al. (2015) Ajello M., Gasparini D., Sanchez-Conde M. et al. (2015) The Origin of the Extragalactic Gamma-Ray Background and Implications for Dark Matter Annihilation. Astrophys J 800:L27-L34. doi:10.1088/2041-8205/800/2/L27.
- Akylas et al. (2016) Akylas A., Georgantopoulos I., Ranalli P., Gkiokas E., Corral A., Lanzuisi G. (2016) Compton-thick AGN in the 70-month Swift-BAT All-Sky Hard X-ray Survey: A Bayesian approach. Astron Astrophys 594: A73. doi:10.1051/0004-6361/201628711
- Albert et al. (2007) Albert J., et al. (2007) Observations of Markarian 421 with the MAGIC Telescope. Astrophys J 663: 125. doi:10.1086/518221
- Alexander et al. (2005) Alexander D. M., Bauer F. E., Chapman S. C., Smail I., Blain A. W., Brandt W. N., Ivison R. J. (2005) The X-Ray Spectral Properties of SCUBA Galaxies. Astrophys J 632: 736-750. doi:10.1086/444342
- Alexander et al. (2008) Alexander D. M., Chary R.-R., Pope A., Bauer F. E., Brandt W. N., Daddi E., Dickinson M., Elbaz D., et al. (2008) Reliable Identification of Compton-thick Quasars at 2: Spitzer Mid-Infrared Spectroscopy of HDF-oMD49. Astrophys J 687: 835-847. doi:10.1086/591928
- Alexander & Hickox (2012) Alexander D. M., Hickox R. C. (2012) What drives the growth of black holes?. New Astronom Rev 56: 93-121. doi:10.1016/j.newar.2011.11.003
- Alexandroff et al. (2013) Alexandroff R., Strauss M. A., Greene J. E., Zakamska N. L., Ross N. P., Brandt W. N., Liu G., Smith P. S., et al. (2013) Candidate type II quasars at in the Sloan Digital Sky Survey III. MNRAS 435: 3306-3325. doi:10.1093/mnras/stt1500
- Allen et al. (2006) Allen S. W., Dunn R. J. H., Fabian A. C., Taylor G. B., Reynolds C. S. (2006) The relation between accretion rate and jet power in X-ray luminous elliptical galaxies. MNRAS 372: 21-30. doi:10.1111/j.1365-2966.2006.10778.x
- Allevato et al. (2013) Allevato V., Paolillo M., Papadakis I., Pinto C. (2013) Measuring X-Ray Variability in Faint/Sparsely Sampled Active Galactic Nuclei. Astrophys J 771: 9. doi:10.1088/0004-637X/771/1/9
- Almaini et al. (2000) Almaini O., Lawrence A., Shanks T., Edge A., Boyle B. J., Georgantopoulos I., Gunn K. F., Stewart G. C., et al. (2000) X-ray variability in a deep, flux-limited sample of QSOs. MNRAS 315: 325-336. doi:10.1046/j.1365-8711.2000.03385.x
- Alonso-Herrero et al. (2016) Alonso-Herrero A., Esquej P., Roche P. F., Ramos Almeida C., González-Martín O., Packham C., Levenson N. A., Mason R. E., et al. (2016) A mid-infrared spectroscopic atlas of local active galactic nuclei on sub-arcsecond resolution using GTC/CanariCam. MNRAS 455: 563-583. doi:10.1093/mnras/stv2342
- Alston et al. (2015) Alston W. N., Parker M. L., Markevičiūtė J., Fabian A. C., Middleton M., Lohfink A., Kara E., Pinto C., et al. (2015) Discovery of an 2-h high-frequency X-ray QPO and iron K ; reverberation in the active galaxy MS 2254.9-3712. MNRAS 449: 467-476. doi:10.1093/mnras/stv351
- Amenomori et al. (2003) Amenomori M., Ayabe S., Cui S. W., et al. (2003) Multi-TeV Gamma-Ray Flares from Markarian 421 in 2000 and 2001 Observed with the Tibet Air Shower Array. Astrophys J 598: 242. doi:10.1086/378350
- Angione (1973) Angione R. J. (1973) QSO historical light curves. Astronom J 78: 353-368. doi:10.1086/111424
- Annuar et al. (2015) Annuar A., Gandhi P., Alexander D. M., Lansbury G. B., Arévalo P., Ballantyne D. R., Baloković M., Bauer F. E., et al. (2015) NuSTAR Observations of the Compton-thick Active Galactic Nucleus and Ultraluminous X-Ray Source Candidate in NGC 5643. Astrophys J 815: 36. doi:10.1088/0004-637X/815/1/36
- Annuar et al. (2017) Annuar, A., Alexander, D. M., Gandhi, P., Lansbury, G. B., Asmus, D., Ballantyne, D. R., Bauer, F. E., Boggs, S. E., et al. (2017) A New Compton-thick AGN in our Cosmic Backyard: Unveiling the Buried Nucleus in NGC 1448 with NuSTAR. Astrophys J 836: 165-doi:10.3847/1538-4357/836/2/165
- Antonucci (1993) Antonucci R. (1993) Unified models for active galactic nuclei and quasars. Annu Rev Astron Astr 31: 473-521. doi:10.1146/annurev.aa.31.090193.002353
- Antonucci & Miller (1985) Antonucci R. R. J., Miller J. S. (1985) Spectropolarimetry and the nature of NGC 1068. Astrophys J 297:621–632. doi:10.1086/163559
- Arsioli & Chang (2017) Arsioli B. & Chang Y.L. (2017) Searching for gamma-ray signature in WHSP blazars: Fermi-LAT detection of 150 excess signal in the 0.3-500 GeV band. Astron Astrophys 598: A134. doi:10.1051/0004-6361/201628691
- Arsioli, Giommi & Polenta (2017) Arsioli B., Giommi P., & Polenta G., (2017) Astron Astrophys submitted
- Arévalo & Uttley (2006) Arévalo P., Uttley P. (2006) Investigating a fluctuating-accretion model for the spectral-timing properties of accreting black hole systems. MNRAS 367: 801-814. doi:10.1111/j.1365-2966.2006.09989.x
- Arévalo et al. (2008) Arévalo P., Uttley P., Kaspi S., Breedt E., Lira P., McHardy I. M. (2008) Correlated X-ray/optical variability in the quasar MR2251-178. MNRAS 389: 1479-1488. doi:10.1111/j.1365-2966.2008.13719.x
- Arévalo et al. (2009) Arévalo P., Uttley P., Lira P., Breedt E., McHardy I. M., Churazov E. (2009) Correlation and time delays of the X-ray and optical emission of the Seyfert Galaxy NGC 3783. MNRAS 397: 2004-2014. doi:10.1111/j.1365-2966.2009.15110.x
- Armus et al. (2007) Armus L., Charmandaris V., Bernard-Salas J., et al. (2007) Observations of Ultraluminous Infrared Galaxies with the Infrared Spectrograph on the Spitzer Space Telescope. II. The IRAS Bright Galaxy Sample. Astrophys J 656:148–167. doi:10.1086/510107
- Asmus et al. (2015) Asmus, D., Gandhi, P., Hönig, S. F., Smette, A., Duschl, W. J. (2015) The subarcsecond mid-infrared view of local active galactic nuclei - II. The mid-infrared-X-ray correlation. MNRAS 454: 766-803. doi:10.1093/mnras/stv1950
- Asmus, Hönig, & Gandhi (2016) Asmus D., Hönig S. F., Gandhi P. (2016) The Subarcsecond Mid-infrared View of Local Active Galactic Nuclei. III. Polar Dust Emission. Astrophys J 822: 109. doi:10.3847/0004-637X/822/2/109
- Assef et al. (2010) Assef R. J., Kochanek C. S., Brodwin M., Cool R., Forman W., Gonzalez A. H., Hickox R. C., Jones C., et al. (2010) Low-Resolution Spectral Templates for Active Galactic Nuclei and Galaxies from 0.03 to 30 m. Astrophys J 713: 970-985. doi:10.1088/0004-637X/713/2/970
- Assef et al. (2011) Assef R. J., Kochanek C. S., Ashby M. L. N., Brodwin M., Brown M. J. I., Cool R., Forman W., Gonzalez A. H., et al. (2011) The Mid-IR- and X-ray-Selected QSO Luminosity Function. Astrophys J 728: 56. doi:10.1088/0004-637X/728/1/56
- Assef et al. (2013) Assef R. J., Stern D., Kochanek C. S., et al. (2013) Mid-infrared Selection of Active Galactic Nuclei with the Wide-field Infrared Survey Explorer. II. Properties of WISE-selected Active Galactic Nuclei in the NDWFS Boötes Field. Astrophys J 772:26. doi:10.1088/0004-637X/772/1/26
- Assef et al. (2015) Assef R. J., Eisenhardt P. R. M., Stern D., et al. (2015) Half of the Most Luminous Quasars May Be Obscured: Investigating the Nature of WISE-Selected Hot Dust-Obscured Galaxies. Astrophys J 804:27. doi:10.1088/0004-637X/804/1/27
- Atwood et al. (2009) Atwood W. B. Abdo A.A., Ackermann, M., Althouse W., Anderson B., Axelsson M., Baldini L., Ballet, J., Band D.L., Barbiellini G., et al. (2009) The Large Area Telescope on the Fermi Gamma-Ray Space Telescope Mission. Astrophys J 697: 1071-1102. doi:10.1088/0004-637X/697/2/1071
- Azadi et al. (2015) Azadi M., Aird J., Coil A. L., Moustakas J., Mendez A. J., Blanton M. R., Cool R. J., Eisenstein D. J., et al. (2015) PRIMUS: The Relationship between Star Formation and AGN Accretion. Astrophys J 806: 187. doi:10.1088/0004-637X/806/2/187
- Baade & Minkowski (1954) Baade W., Minkowski R. (1954) On the Identification of Radio Sources. Astrophys J 119: 215-231. doi:10.1086/145813
- Baldassare et al. (2015) Baldassare V. F., Reines A. E., Gallo E., Greene J. E. (2015) A 50,000 Solar Mass Black Hole in the Nucleus of RGG 118. Astrophys J Lett 809: L14. doi:10.1088/2041-8205/809/1/L14
- Baldi & Capetti (2010) Baldi R. D., Capetti A. (2010) Spectro-photometric properties of the bulk of the radio-loud AGN population. Astron Astrophys 519: A48. doi:10.1051/0004-6361/201014446
- Baldi, Capetti, & Giovannini (2015) Baldi R. D., Capetti A., Giovannini G. (2015) Pilot study of the radio-emitting AGN population: the emerging new class of FR 0 radio-galaxies. Astron Astrophys 576: A38. doi:10.1051/0004-6361/201425426
- Baldwin (1997) Baldwin J. A (1997) Luminosity Indicators in the Spectra of Quasi-Stellar Objects. Astrophys J 214:679-684. doi:10.1086/155294
- Baldwin, Phillips, & Terlevich (1981) Baldwin J. A., Phillips M. M., Terlevich R. (1981) Classification parameters for the emission-line spectra of extragalactic objects. Publications Astron Soc Pacific 93: 5-19. doi:10.1086/130766
- Baloković et al. (2014) Baloković, M., Comastri, A., Harrison, F. A., Alexander, D. M., Ballantyne, D. R., Bauer, F. E., Boggs, S. E., Brandt, W. N., et al. (2014) The NuSTAR View of Nearby Compton-thick Active Galactic Nuclei: The Cases of NGC 424, NGC 1320, and IC 2560. Astrophys J 794: 111. doi:10.1088/0004-637X/794/2/111
- Baloković et al. (2012) Baloković M., Smolčić V., Ivezić Ž., Zamorani G., Schinnerer E., Kelly B. C. (2012) Disclosing the Radio Loudness Distribution Dichotomy in Quasars: An Unbiased Monte Carlo Approach Applied to the SDSS-FIRST Quasar Sample. Astrophys J 759: 30. doi:10.1088/0004-637X/759/1/30
- Banerji et al. (2012) Banerji M., McMahon R. G., Hewett P. C., et al. (2012) Heavily reddened quasars at z 2 in the UKIDSS Large Area Survey: a transitional phase in AGN evolution. MNRAS 427:2275–2291. doi:10.1111/j.1365-2966.2012.22099.x
- Banerji et al. (2015) Banerji M., Alaghband-Zadeh S., Hewett P. C., McMahon R. G. (2015) Heavily reddened type 1 quasars at z 2 - I. Evidence for significant obscured black hole growth at the highest quasar luminosities. MNRAS 447:3368–3389. doi:10.1093/mnras/stu2649
- Barthel (1989) Barthel P. D. (1989) Is every quasar beamed?. Astrophys J 336: 606-611. doi:10.1086/167038
- Bartoli et al. (2011) Bartoli B., Bernardini P., Bi X.J., et al. (2011) Long-term Monitoring of the TeV Emission from Mrk 421 with the ARGO-YBJ Experiment. Astrophys J 734: 110. doi:10.1088/0004-637X/734/2/110
- Barvainis (1987) Barvainis R. (1987) Hot dust and the near-infrared bump in the continuum spectra of quasars and active galactic nuclei. Astrophys J 320: 537-544. doi:10.1086/165571
- Baskin & Laor (2005) Baskin A., Laor A. (2005) What controls the CIV line profile in active galactic nuclei?. MNRAS 356: 1029-1044. doi:10.1111/j.1365-2966.2004.08525.x
- Bañados et al. (2016) Bañados E., Venemans B. P., Decarli R., Farina E. P., Mazzucchelli C., Walter F., Fan X., Stern D., et al. (2016) The Pan-STARRS1 Distant Quasar Survey: More than 100 Quasars within the First Gyr of the Universe. Astrophys J Suppl 227: 11. doi:10.3847/0067-0049/227/1/11
- Benitez et al. (2014) Benitez N., Dupke R., Moles M., Sodre L., Cenarro J., Marin-Franch A., Taylor K., Cristobal D., et al. (2014) J-PAS: The Javalambre-Physics of the Accelerated Universe Astrophysical Survey. arXiv:1403.5237
- Bentz et al. (2009) Bentz M. C., Peterson B. M., Netzer H., Pogge R. W., Vestergaard M. (2009) The Radius-Luminosity Relationship for Active Galactic Nuclei: The Effect of Host-Galaxy Starlight on Luminosity Measurements. II. The Full Sample of Reverberation-Mapped AGNs. Astrophys J 697: 160-181. doi:10.1088/0004-637X/697/1/160
- Berta et al. (2013) Berta S., Lutz D., Santini P., Wuyts S., Rosario D., Brisbin D., Cooray A., Franceschini A., et al. (2013) Panchromatic spectral energy distributions of Herschel sources. Astron Astrophys 551: A100. doi:10.1051/0004-6361/201220859
- Bertemes et al. (2016) Bertemes C., Trakhtenbrot B., Schawinski K., Done C., Elvis M. (2016) Testing the Completeness of the SDSS Colour Selection for Ultramassive, Slowly Spinning Black Holes. MNRAS doi:10.1093/mnras/stw2207
- Best & Heckman (2012) Best P. N., Heckman T. M. (2012) On the fundamental dichotomy in the local radio-AGN population: accretion, evolution and host galaxy properties. MNRAS 421: 1569-1582. doi:10.1111/j.1365-2966.2012.20414.x
- Best et al. (2005) Best P. N., Kauffmann G., Heckman T. M., Ivezić Ž. (2005) A sample of radio-loud active galactic nuclei in the Sloan Digital Sky Survey. MNRAS 362: 9-24. doi:10.1111/j.1365-2966.2005.09283.x
- Bianchi et al. (2012) Bianchi S., Panessa F., Barcons X., Carrera F. J., La Franca F., Matt G., Onori F., Wolter A., et al. (2012) Simultaneous X-ray and optical observations of true type 2 Seyfert galaxies. MNRAS 426: 3225-3240. doi:10.1111/j.1365-2966.2012.21959.x
- Biteau & Williams (2015) Biteau J., Williams D. A., (2015) The Extragalactic Background Light, the Hubble Constant, and Anomalies: Conclusions from 20 Years of TeV Gamma-ray Observations. Astrophys J 812: 60. doi:10.1088/0004-637X/812/1/60
- Blandford & Begelman (1999) Blandford R. D., Begelman M. C. (1999) On the fate of gas accreting at a low rate on to a black hole. MNRAS 303: L1-L5. doi:10.1046/j.1365-8711.1999.02358.x
- Blandford & Payne (1982) Blandford R. D., Payne D. G. (1982) Hydromagnetic flows from accretion discs and the production of radio jets. MNRAS 199: 883-903. doi:10.1093/mnras/199.4.883
- Blandford & Znajek (1977) Blandford R. D., Znajek R. L. (1977) Electromagnetic extraction of energy from Kerr black holes. MNRAS 179: 433-456. doi:10.1093/mnras/179.3.433
- Böttcher & Dermer (2010) Böttcher M., Dermer C. D. (2010) Timing Signatures of the Internal-Shock Model for Blazars. Astrophys J 711: 445-460. doi:10.1088/0004-637X/711/1/445
- Böttcher et al. (2013) Böttcher M., Reimer A., Sweeney K., & Prakash A. (2013) Leptonic and Hadronic Modeling of Fermi-detected Blazars. Astrophys J 768: 54. doi:10.1088/0004-637X/768/1/54
- Bongiorno et al. (2012) Bongiorno A., Merloni A., Brusa M., Magnelli B., Salvato M., Mignoli M., Zamorani G., Fiore F., et al. (2012) Accreting supermassive black holes in the COSMOS field and the connection to their host galaxies. MNRAS 427: 3103-3133. doi:10.1111/j.1365-2966.2012.22089.x
- Bonzini et al. (2013) Bonzini M., Padovani P., Mainieri V., Kellermann K. I., Miller N., Rosati P., Tozzi P., Vattakunnel S., et al. (2013) The sub-mJy radio sky in the Extended Chandra Deep Field-South: source population. MNRAS 436: 3759-3771. doi:10.1093/mnras/stt1879
- Bonzini et al. (2015) Bonzini M., Mainieri V., Padovani P., Andreani P., Berta S., Bethermin M., Lutz D., Rodighiero G., et al. (2015) Star formation properties of sub-mJy radio sources. MNRAS 453: 1079-1094. doi:10.1093/mnras/stv1675
- Boroson & Green (1992) Boroson T. A., Green R. F. (1992) The emission-line properties of low-redshift quasi-stellar objects. Astrophys J Suppl 80: 109-135. doi:10.1086/191661
- Boroson, Kim, & Fabbiano (2011) Boroson B., Kim D.-W., Fabbiano G. (2011) Revisiting with Chandra the Scaling Relations of the X-ray Emission Components (Binaries, Nuclei, and Hot Gas) of Early-type Galaxies. Astrophys J 729: 12. doi:10.1088/0004-637X/729/1/12
- Bovy et al. (2011) Bovy J., Hennawi J. F., Hogg D. W., Myers A. D., Kirkpatrick J. A., Schlegel D. J., Ross N. P., Sheldon E. S., et al. (2011) Think Outside the Color Box: Probabilistic Target Selection and the SDSS-XDQSO Quasar Targeting Catalog. Astrophys J 729: 141. doi:10.1088/0004-637X/729/2/141
- Brandt & Alexander (2015) Brandt W. N., Alexander D. M. (2015) Cosmic X-ray surveys of distant active galaxies. The demographics, physics, and ecology of growing supermassive black holes. Astron Astrophys Rev 23: 1. doi:10.1007/s00159-014-0081-z
- Breedt et al. (2010) Breedt E., McHardy I. M., Arévalo P., Uttley P., Sergeev S. G., Minezaki T., Yoshii Y., Sakata Y., et al. (2010) Twelve years of X-ray and optical variability in the Seyfert galaxy NGC 4051. MNRAS 403: 605-619. doi:10.1111/j.1365-2966.2009.16146.x
- Brescia, Cavuoti, & Longo (2015) Brescia M., Cavuoti S., Longo G. (2015) Automated physical classification in the SDSS DR10. A catalogue of candidate quasars. MNRAS 450: 3893-3903. doi:10.1093/mnras/stv854
- Bridle et al. (1994) Bridle A. H., Hough D. H., Lonsdale C. J., Burns J. O., Laing R. A. (1994) Deep VLA imaging of twelve extended 3CR quasars. Astronom J 108: 766-820. doi:10.1086/117112
- Brotherton & Francis (1999) Brotherton M. S., Francis P. J. (1999) The Intermediate Line Region and the Baldwin Effect. Quasars and Cosmology 162: 395
- Brusa et al. (2009) Brusa M., Fiore F., Santini P., Grazian A., Comastri A., Zamorani G., Hasinger G., Merloni A., et al. (2009) Black hole growth and starburst activity at z = 0.6-4 in the Chandra Deep Field South. Host galaxies properties of obscured AGN. Astron Astrophys 507: 1277-1289. doi:10.1051/0004-6361/200912261
- Buchanan et al. (2006) Buchanan C. L., Gallimore J. F., O’Dea C. P., Baum S. A., Axon D. J., Robinson A., Elitzur M., Elvis M., et al. (2006) Spitzer IRS Spectra of a Large Sample of Seyfert Galaxies: A Variety of Infrared Spectral Energy Distributions in the Local Active Galactic Nucleus Population. Astronom J 132: 401-419. doi:10.1086/505022
- Buchner et al. (2015) Buchner J., Georgakakis A., Nandra K., Brightman M., Menzel M.-L., Liu Z., Hsu L.-T., Salvato M., et al. (2015) Obscuration-dependent Evolution of Active Galactic Nuclei. Astrophys J 802: 89. doi:10.1088/0004-637X/802/2/89
- Buchner et al. (2017) Buchner J., Schulze S., Bauer F. E. (2017) Galaxy gas as obscurer - I. GRBs x-ray galaxies and find an relation. MNRAS 464:4545–4566. doi:10.1093/mnras/stw2423
- Burtscher et al. (2016) Burtscher L., Davies R. I., Graciá-Carpio J., Koss M. J., Lin M.-Y., Lutz D., Nandra P., Netzer H., et al. (2016) On the relation of optical obscuration and X-ray absorption in Seyfert galaxies. Astron Astrophys 586: A28. doi:10.1051/0004-6361/201527575
- Buttiglione et al. (2009) Buttiglione S., Capetti A., Celotti A., Axon D. J., Chiaberge M., Macchetto F. D., Sparks W. B. (2009) An optical spectroscopic survey of the 3CR sample of radio galaxies with . I. Presentation of the data. Astron Astrophys 495: 1033-1060. doi:10.1051/0004-6361:200811102
- Buttiglione et al. (2010) Buttiglione S., Capetti A., Celotti A., Axon D. J., Chiaberge M., Macchetto F. D., Sparks W. B. (2010) An optical spectroscopic survey of the 3CR sample of radio galaxies with . II. Spectroscopic classes and accretion modes in radio-loud AGN. Astron Astrophys 509: A6. doi:10.1051/0004-6361/200913290
- Cackett, Horne, & Winkler (2007) Cackett E. M., Horne K., Winkler H. (2007) Testing thermal reprocessing in active galactic nuclei accretion disks. MNRAS 380: 669-682. doi:10.1111/j.1365-2966.2007.12098.x
- Capellupo et al. (2015) Capellupo D. M., Netzer H., Lira P., Trakhtenbrot B., Mejía-Restrepo J. (2015) Active galactic nuclei at - I. Spectral energy distribution and accretion discs. MNRAS 446: 3427-3446. doi:10.1093/mnras/stu2266
- Caplar et al. (2017) Caplar N., Lilly S. J., Trakhtenbrot B., (2017) Optical Variability of AGNs in the PTF/iPTF Survey. Astrophys J 834, 111. doi: 10.3847/1538-4357/834/2/111
- Cappi et al. (2013) Cappi M., Done C., Behar E., Bianchi S., Braito V., Costantini E., Dadina M., Feruglio C., et al. (2013) The Hot and Energetic Universe: Astrophysics of feedback in local AGN. arXiv:1306.2330
- Cappi et al. (2016) Cappi M., De Marco B., Ponti G., Ursini F., Petrucci P.-O., Bianchi S., Kaastra J. S., Kriss G. A., et al. (2016) Anatomy of the AGN in NGC 5548. VIII. XMM-Newton’s EPIC detailed view of an unexpected variable multilayer absorber. Astron Astrophys 592: A27. doi:10.1051/0004-6361/201628464
- Castelló-Mor, Netzer, & Kaspi (2016) Castelló-Mor N., Netzer H., Kaspi S. (2016) Super- and sub-Eddington accreting massive black holes: a comparison of slim and thin accretion discs through study of the spectral energy distribution. MNRAS 458: 1839-1858. doi:10.1093/mnras/stw445
- Chan & Krolik (2016) Chan C. H., Krolik J. H. (2016) Radiation-driven Outflows from and Radiative Support in Dusty Tori of Active Galactic Nuclei. Astrophys J 825:67. doi:10.3847/0004-637X/825/1/67
- Chandra et al. (2010) Chandra P., Yadav K. K., Rannot R. C. et al. (2010) TeV observations of Mrk 421 with the TACTIC gamma-ray telescope during 2006-8. Journal of Physics G, 37: 125201. doi:10.1088/0954-3899/37/12/125201
- Chang et al. (2017) Chang Y.-L., Arsioli B., Giommi P., Padovani P. (2017) 2WHSP: A multi-frequency selected catalogue of high energy and very high energy -ray blazars and blazar candidates. Astron Astrophys 598: A17. doi:10.1051/0004-6361/201629487
- Chen et al. (2015) Chen C.-T.J., Hickox R. C., Alberts S., et al. (2015) A Connection between Obscuration and Star Formation in Luminous Quasars. Astrophys J 802:50. doi:10.1088/0004-637X/802/1/50
- Chen et al. (2017) Chen, C.-T. J., Brandt, W. N., Reines, A. E., Lansbury, G., Stern, D., Alexander, D. M., Bauer, F. E., Del Moro, A., et al. (2017) Hard X-ray selected AGNs in low-mass galaxies from the NuSTAR serendipitous survey. Astrophys J 837: 48-doi:10.3847/1538-4357/aa5d5b
- Chi, Barthel, & Garrett (2013) Chi S., Barthel P. D., Garrett M. A. (2013) Deep, wide-field, global VLBI observations of the Hubble deep field north (HDF-N) and flanking fields (HFF). Astron Astrophys 550: A68. doi:10.1051/0004-6361/201220783
- Chiaberge et al. (1999) Chiaberge M., Capetti A., Celotti A. (1999) The HST view of FR I radio galaxies: evidence for non-thermal nuclear sources. Astron Astrophys 349:77–87
- Chiaberge et al. (2002) Chiaberge M., Macchetto F. D., Sparks W. B., Capetti A., Allen M. G., Martel A. R. (2002) The Nuclei of Radio Galaxies in the Ultraviolet: The Signature of Different Emission Processes. Astrophys J 571: 247-255. doi:10.1086/339846
- Churazov, Gilfanov, & Revnivtsev (2001) Churazov E., Gilfanov M., Revnivtsev M. (2001) Soft state of Cygnus X-1: stable disk and unstable corona. MNRAS 321: 759-766. doi:10.1046/j.1365-8711.2001.04056.x
- Cid Fernandes, Aretxaga, & Terlevich (1996) Cid Fernandes R., Jr., Aretxaga I., Terlevich R. (1996) The QSO variability-luminosity-redshift relation. MNRAS 282: 1191-1202. doi:10.1093/mnras/282.4.1191
- Coatman et al. (2016) Coatman L., Hewett P. C., Banerji M., Richards G. T. (2016) C IV emission-line properties and systematic trends in quasar black hole mass estimates. MNRAS 461: 647-665. doi:10.1093/mnras/stw1360
- Coatman et al. (2017) Coatman L., Hewett P. C., Banerji M., Richards G. T., Hennawi J. F., Prochaska J. X. (2017) Correcting C IV-based virial black hole masses. MNRAS 465: 2120-2142. doi:10.1093/mnras/stw2797
- Comastri (2004) Comastri A. (2004) Compton-Thick AGN: The Dark Side of the X-Ray Background. Supermassive Black Holes in the Distant Universe 308: 245. doi:10.1007/978-1-4020-2471-9_8
- Condon (1992) Condon J. J. (1992) Radio emission from normal galaxies. Annu Rev Astron Astr 30: 575-611. doi:10.1146/annurev.aa.30.090192.003043
- Condon et al. (2013) Condon J. J., Kellermann K. I., Kimball A. E., Ivezić Ž., Perley R. A. (2013) Active Galactic Nucleus and Starburst Radio Emission from Optically Selected Quasi-stellar Objects. Astrophys J 768: 37. doi:10.1088/0004-637X/768/1/37
- Conselice et al. (2016) Conselice C. J., Wilkinson A., Duncan K., Mortlock A. (2016) The Evolution of Galaxy Number Density at and its Implications. Astrophys J 830: 83. doi:10.3847/0004-637X/830/2/83
- Croton et al. (2016) Croton D. J., Stevens A. R. H., Tonini C., Garel T., Bernyk M., Bibiano A., Hodkinson L., Mutch S. J., et al. (2016) Semi-Analytic Galaxy Evolution (SAGE): Model Calibration and Basic Results. Astrophys J Suppl 222: 22. doi:10.3847/0067-0049/222/2/22
- Cutri et al. (2012) Cutri R. M., Wright E. L., Conrow T., et al. (2012) Explanatory Supplement to the WISE All-Sky Data Release Products. Tech. rep.
- Czerny et al. (2001) Czerny B., Nikołajuk M., Piasecki M., Kuraszkiewicz J. (2001) Black hole masses from power density spectra: determinations and consequences. MNRAS 325: 865-874. doi:10.1046/j.1365-8711.2001.04522.x
- D’Abrusco, Longo, & Walton (2009) D’Abrusco R., Longo G., Walton N. A. (2009) Quasar candidates selection in the Virtual Observatory era. MNRAS 396: 223-262. doi:10.1111/j.1365-2966.2009.14754.x
- Dadina et al. (2010) Dadina M., Guainazzi M., Cappi M., Bianchi S., Vignali C., Malaguti G., Comastri A. (2010) X-ray imaging of the ionisation cones in NGC 5252. Astron Astrophys 516: A9-doi:10.1051/0004-6361/200913727
- Davies, Schirmer, & Turner (2015) Davies R. L., Schirmer M., Turner J. E. H. (2015) The ‘Green Bean’ Galaxy SDSS J224024.1-092748: unravelling the emission signature of a quasar ionization echo. MNRAS 449: 1731-1752. doi:10.1093/mnras/stv343 2801d2799
- D’Onofrio, Marziani, & Sulentic (2012) D’Onofrio M., Marziani P., Sulentic J. W. (2012) Fifty Years of Quasars: From Early Observations and Ideas to Future Research. Springer-Verlag Berlin Heidelberg. doi:10.1007/978-3-642-27564-7
- De Breuck et al. (2001) De Breuck C., van Breugel W., Röttgering H., Stern D., Miley G., de Vries W., Stanford S. A., Kurk J., et al. (2001) Spectroscopy of Ultra-steep-Spectrum Radio Sources. Astronom J 121: 1241-1265. doi:10.1086/319392
- De Cicco et al. (2015) De Cicco D., Paolillo M., Covone G., Falocco S., Longo G., Grado A., Limatola L., Botticella M. T., et al. (2015) Variability-selected active galactic nuclei in the VST-SUDARE/VOICE survey of the COSMOS field. Astron Astrophys 574: A112. doi:10.1051/0004-6361/201424906
- de Grijp et al. (1985) de Grijp M. H. K., Miley G. K., Lub J., de Jong T. (1985) Infrared Seyferts - A new population of active galaxies? Nature 314:240–242. doi:10.1038/314240a0
- de Grijp et al. (1987) de Grijp M. H. K., Lub J., Miley G. K. (1987) Warm IRAS sources. I. A. Catalogue of AGN candidates from the point source catalog. Astron Astrophys Suppl 70:95–114
- De Marco et al. (2013) De Marco B., Ponti G., Cappi M., Dadina M., Uttley P., Cackett E. M., Fabian A. C., Miniutti G., et al. (2013) Discovery of a relation between black hole mass and soft X-ray time lags in active galactic nuclei. MNRAS 431: 2441-2452. doi:10.1093/mnras/stt339
- De Marco et al. (2015) De Marco B., Ponti G., Muñoz-Darias T., Nandra K. (2015) Tracing the Reverberation Lag in the Hard State of Black Hole X-Ray Binaries. Astrophys J 814: 50. doi:10.1088/0004-637X/814/1/50
- Del Moro et al. (2013) Del Moro A., Alexander D. M., Mullaney J. R., Daddi E., Pannella M., Bauer F. E., Pope A., Dickinson M., et al. (2013) GOODS-Herschel: radio-excess signature of hidden AGN activity in distant star-forming galaxies. Astron Astrophys 549: A59. doi:10.1051/0004-6361/201219880
- Del Moro et al. (2014) Del Moro A., Mullaney J. R., Alexander D. M., Comastri A., Bauer F. E., Treister E., Stern D., Civano F., et al. (2014) NuSTAR J033202-2746.8: Direct Constraints on the Compton Reflection in a Heavily Obscured Quasar at z 2. Astrophys J 786: 16. doi:10.1088/0004-637X/786/1/16n
- Del Moro et al. (2016) Del Moro A., Alexander D. M., Bauer F. E., Daddi E., Kocevski D. D., McIntosh D. H., Stanley F., Brandt W. N., et al. (2016) Mid-infrared luminous quasars in the GOODS-Herschel fields: a large population of heavily obscured, Compton-thick quasars at 2. MNRAS 456: 2105-2125. doi:10.1093/mnras/stv2748
- Delvecchio et al. (2014) Delvecchio I., Gruppioni C., Pozzi F., Berta S., Zamorani G., Cimatti A., Lutz D., Scott D., et al. (2014) Tracing the cosmic growth of supermassive black holes to with Herschel. MNRAS 439: 2736-2754. doi:10.1093/mnras/stu130
- Delvecchio et al. (2017) Delvecchio I., Smolčić V., Zamorani G., Lagos C. D. P., Berta S., Delhaize J., Baran N., Rosario D. J., et al. (2017) The VLA-COSMOS 3 GHz Large Project: AGN and host-galaxy properties out to z6. Astron Astrophys 602: A3. doi:10.1051/0004-6361/201629367
- DeNaurois & Mazin (2015) de Naurois M., & Mazin D., (2015) Ground-based detectors in very-high-energy gamma-ray astronomy. C.R. Physique, 16: 610-627. doi:10.1016/j.crhy.2015.08.011
- Dennett-Thorpe et al. (2002) Dennett-Thorpe J., Scheuer P. A. G., Laing R. A., Bridle A. H., Pooley G. G., Reich W. (2002) Jet reorientation in active galactic nuclei: two winged radio galaxies. MNRAS 330: 609-620. doi:10.1046/j.1365-8711.2002.05106.x
- Denney (2012) Denney K. D. (2012) Are Outflows Biasing Single-epoch C IV Black Hole Mass Estimates?. Astrophys J 759: 44. doi:10.1088/0004-637X/759/1/44
- Denney et al. (2013) Denney K. D., Pogge R. W., Assef R. J., Kochanek C. S., Peterson B. M., Vestergaard M. (2013) C IV Line-width Anomalies: The Perils of Low Signal-to-noise Spectra. Astrophys J 775: 60. doi:10.1088/0004-637X/775/1/60
- Deo et al. (2009) Deo R. P., Richards G. T., Crenshaw D. M., Kraemer S. B. (2009) The Mid-Infrared Continua of Seyfert Galaxies. Astrophys J 705:14–31. doi:10.1088/0004-637X/705/1/14
- Dey et al. (2008) Dey A., Soifer B. T., Desai V., et al. (2008) A Significant Population of Very Luminous Dust-Obscured Galaxies at Redshift . Astrophys J 677:943-956. doi:10.1086/529516
- Díaz-Santos et al. (2016) Díaz-Santos T., Assef R. J., Blain A. W., et al. (2016) The Strikingly Uniform, Highly Turbulent Interstellar Medium of the Most Luminous Galaxy in the Universe. Astrophys J Lett 816:L6. doi:10.3847/2041-8205/816/1/L6
- Di Matteo et al. (2017) Di Matteo T., Croft R. A. C., Feng Y., Waters D., Wilkins S. (2017) The origin of the most massive black holes at high-z: BlueTides and the next quasar frontier. MNRAS 467:4243–4251. doi:10.1093/mnras/stx319
- DiPompeo et al. (2015) DiPompeo M. A., Bovy J., Myers A. D., Lang D. (2015) Quasar probabilities and redshifts from WISE mid-IR through GALEX UV photometry. MNRAS 452: 3124-3138. doi:10.1093/mnras/stv1562
- Done (2010) Done C. (2010) Observational characteristics of accretion onto black holes. arXiv:1008.2287
- Done, Gierliński, & Kubota (2007) Done C., Gierliński M., Kubota A. (2007) Modelling the behaviour of accretion flows in X-ray binaries. Everything you always wanted to know about accretion but were afraid to ask. Astron Astrophys Rev 15: 1-66. doi:10.1007/s00159-007-0006-1
- Donley et al. (2007) Donley J. L., Rieke G. H., Pérez-González P. G., Rigby J. R., Alonso-Herrero A. (2007) Spitzer Power-Law Active Galactic Nucleus Candidates in the Chandra Deep Field-North. Astrophys J 660:167–190. doi:10.1086/512798
- Donley et al. (2012) Donley J. L., Koekemoer A. M., Brusa M., Capak P., Cardamone C. N., Civano F., Ilbert O., Impey C. D., et al. (2012) Identifying Luminous Active Galactic Nuclei in Deep Surveys: Revised IRAC Selection Criteria. Astrophys J 748: 142. doi:10.1088/0004-637X/748/2/142
- Donoso, Best, & Kauffmann (2009) Donoso E., Best P. N., Kauffmann G. (2009) Evolution of the radio-loud galaxy population. MNRAS 392: 617-629. doi:10.1111/j.1365-2966.2008.14068.x
- Dovciak et al. (2013) Dovciak M., Matt G., Bianchi S., Boller T., Brenneman L., Bursa M., D’Ai A., di Salvo T., et al. (2013) The Hot and Energetic Universe: The close environments of supermassive black holes. arXiv:1306.2331
- Dubois et al. (2016) Dubois Y., Peirani S., Pichon C., et al. (2016) The HORIZON-AGN simulation: morphological diversity of galaxies promoted by AGN feedback. MNRAS 463:3948–3964. doi:10.1093/mnras/stw2265
- Dullemond & van Bemmel (2005) Dullemond C. P., van Bemmel I. M. (2005) Clumpy tori around active galactic nuclei. Astron Astrophys 436:47–56. doi:10.1051/0004-6361:20041763
- Dunlop & Peacock (1990) Dunlop J. S., Peacock J. A. (1990) The Redshift Cut-Off in the Luminosity Function of Radio Galaxies and Quasars. MNRAS 247: 19-42.
- Ebeling et al. (2010) Ebeling H., Edge A. C., Mantz A., Barrett E., Henry J. P., Ma C. J., van Speybroeck L. (2010) The X-ray brightest clusters of galaxies from the Massive Cluster Survey. MNRAS 407: 83-93. doi:10.1111/j.1365-2966.2010.16920.x
- Edelson & Nandra (1999) Edelson R., Nandra K. (1999) A Cutoff in the X-Ray Fluctuation Power Density Spectrum of the Seyfert 1 Galaxy NGC 3516. Astrophys J 514: 682-690. doi:10.1086/306980
- Edelson et al. (2015) Edelson R., Gelbord J. M., Horne K., McHardy I. M., Peterson B. M., Arévalo P., Breeveld A. A., De Rosa G., et al. (2015) Space Telescope and Optical Reverberation Mapping Project. II. Swift and HST Reverberation Mapping of the Accretion Disk of NGC 5548. Astrophys J 806: 129. doi:10.1088/0004-637X/806/1/129
- Eisenhardt et al. (2004) Eisenhardt P. R., Stern D., Brodwin M., et al. (2004) The Infrared Array Camera (IRAC) Shallow Survey. Astrophys J Suppl 154:48–53. doi:10.1086/423180
- Eisenhardt et al. (2012) Eisenhardt P. R. M., Wu J., Tsai C. W., et al. (2012) The First Hyper-luminous Infrared Galaxy Discovered by WISE. Astrophys J 755:173. doi:10.1088/0004-637X/755/2/173
- Elitzur & Netzer (2016) Elitzur M., Netzer H. (2016) Disc outflows and high-luminosity true type 2 AGN. MNRAS 459:585–594. doi:10.1093/mnras/stw657
- Elitzur & Shlosman (2006) Elitzur M., Shlosman I. (2006) The AGN-obscuring Torus: The End of the “Doughnut” Paradigm?. Astrophys J Lett 648: L101-L104. doi:10.1086/508158
- Elvis et al. (1994) Elvis M., Wilkes B. J., McDowell J. C., Green R. F., Bechtold J., Willner S. P., Oey M. S., Polomski E., et al. (1994) Atlas of quasar energy distributions. Astrophys J Suppl 95: 1-68. doi:10.1086/192093
- Esin (1997) Esin A. A. (1997) Heating and Cooling of Hot Accretion Flows by Nonlocal Radiation. Astrophys J 482: 400-413. doi:10.1086/304129
- Evans et al. (2006) Evans D. A., Worrall D. M., Hardcastle M. J., Kraft R. P., Birkinshaw M. (2006) Chandra and XMM-Newton Observations of a Sample of Low-Redshift FR I and FR II Radio Galaxy Nuclei. Astrophys J 642: 96-112. doi:10.1086/500658
- Fabbiano (2006) Fabbiano G. (2006) Populations of X-Ray Sources in Galaxies. Annu Rev Astron Astr 44: 323-366. doi:10.1146/annurev.astro.44.051905.092519
- Fabian et al. (2009) Fabian A. C., Zoghbi A., Ross R. R., Uttley P., Gallo L. C., Brandt W. N., Blustin A. J., Boller T., et al. (2009) Broad line emission from iron K- and L-shell transitions in the active galaxy 1H0707-495. Nature 459: 540-542. doi:10.1038/nature08007
- Falcke & Biermann (1995) Falcke H., Biermann P. L. (1995) The jet-disk symbiosis. I. Radio to X-ray emission models for quasars. Astron Astrophys 293: 665-682
- Falcke & Biermann (1999) Falcke H., Biermann P. L. (1999) The jet/disk symbiosis. III. What the radio cores in GRS 1915+105, NGC 4258, M 81 and SGR A* tell us about accreting black holes. Astron Astrophys 342: 49-56
- Falcke, Malkan, & Biermann (1995) Falcke H., Malkan M. A., Biermann P. L. (1995) The jet-disk symbiosis. II.Interpreting the radio/UV correlations in quasars.. Astron Astrophys 298: 375
- Fanaroff & Riley (1974) Fanaroff B. L., Riley J. M. (1974) The morphology of extragalactic radio sources of high and low luminosity. MNRAS 167: 31P-36P
- Fanidakis et al. (2011) Fanidakis N., Baugh C. M., Benson A. J., Bower R. G., Cole S., Done C., Frenk C. S. (2011) Grand unification of AGN activity in the CDM cosmology. MNRAS 410: 53-74. doi:10.1111/j.1365-2966.2010.17427.x
- Fazio et al. (2004) Fazio G. G., Hora J. L., Allen L. E., et al. (2004) The Infrared Array Camera (IRAC) for the Spitzer Space Telescope. Astrophys J Suppl 154:10–17. doi:10.1086/422843
- Feltre et al. (2012) Feltre A., Hatziminaoglou E., Fritz J., Franceschini A. (2012) Smooth and clumpy dust distributions in AGN: a direct comparison of two commonly explored infrared emission models. MNRAS 426:120–127. doi:10.1111/j.1365-2966.2012.21695.x
- Feltre et al. (2013) Feltre A., Hatziminaoglou E., Hernán-Caballero A. et al. (2013) The roles of star formation and AGN activity of IRS sources in the HerMES fields. MNRAS 434:2426–2437. doi:10.1093/mnras/stt1177
- Feltre et al. (2016) Feltre A., Charlot S., Gutkin J. (2016) Nuclear activity versus star formation: emission-line diagnostics at ultraviolet and optical wavelengths. MNRAS 456:3354-3374. doi:10.1093/mnras/stv2794
- The Fermi-LAT Collaboration (2017) The Fermi-LAT Collaboration (2017) 3FHL: The Third Catalog of Hard Fermi-LAT Sources. arXiv:1702.00664
- Filho, Barthel, & Ho (2006) Filho M. E., Barthel P. D., Ho L. C. (2006) A radio census of nuclear activity in nearby galaxies. Astron Astrophys 451: 71-83. doi:10.1051/0004-6361:20054510
- Filippenko & Sargent (1985) Filippenko A. V., Sargent W. L. W. (1985) A search for ’dwarf’ Seyfert 1 nuclei. I - The initial data and results. Astrophys J Suppl 57: 503-522. doi:10.1086/191012
- Fish et al. (2016) Fish V., Akiyama K., Bouman K., et al. (2016) Observing and Imaging Active Galactic Nuclei with the Event Horizon Telescope. Galaxies 4:54, doi:10.3390/galaxies4040054
- Flesch (2015) Flesch E. W. (2015) The Half Million Quasars (HMQ) Catalogue. Publications Astron Soc Australia 32: e010. doi:10.1017/pasa.2015.10
- Francis, Hewett, Foltz, & Chaffee (1992) Francis P. J., Hewett P. C., Foltz C. B., Chaffee F. H. (1992) An objective classification scheme for QSO spectra. Astrophys J 398: 476-490. doi:10.1086/171870
- Francis et al. (2004) Francis P. J., Nelson B. O., Cutri R. M. (2004) An Unbiased Census of Active Galactic Nuclei in the Two Micron All Sky Survey. Astronom J 127:646–655. doi:10.1086/380939
- Fritz, Franceschini, & Hatziminaoglou (2006) Fritz J., Franceschini A., Hatziminaoglou E. (2006) Revisiting the infrared spectra of active galactic nuclei with a new torus emission model. MNRAS 366: 767-786. doi:10.1111/j.1365-2966.2006.09866.x
- Gagne et al. (2014) Gagne J. P., Crenshaw D. M., Kraemer S. B., Schmitt H. R., Keel W. C., Rafter S., Fischer T. C., Bennert V. N., et al. (2014) Spatially Resolved Spectra of the ”Teacup” Active Galactic Nucleus: Tracing the History of a Dying Quasar. Astrophys J 792: 72-doi:10.1088/0004-637X/792/1/72
- Gallimore et al. (2016) Gallimore J. F., Elitzur M., Maiolino R., Marconi A., O’Dea C. P., Lutz D., Baum S. A., Nikutta R., et al. (2016) High-velocity Bipolar Molecular Emission from an AGN Torus. Astrophys J Lett 829: L7-doi:10.3847/2041-8205/829/1/L7
- Gandhi et al. (2009) Gandhi, P., Horst, H., Smette, A., Hönig, S., Comastri, A., Gilli, R., Vignali, C., Duschl, W. (2009) Resolving the mid-infrared cores of local Seyferts. Astron Astrophys 502: 457-472. doi:10.1051/0004-6361/200811368
- Gandhi et al. (2014) Gandhi, P., Lansbury, G. B., Alexander, D. M., Stern, D., Arévalo, P., Ballantyne, D. R., Baloković, M., Bauer, F. E., et al. (2014) NuSTAR Unveils a Compton-thick Type 2 Quasar in Mrk 34. Astrophys J 792: 117. doi:10.1088/0004-637X/792/2/117
- García-Burillo et al. (2016) García-Burillo S., Combes F., Ramos Almeida C., Usero A., Krips M., Alonso-Herrero A., Aalto S., Casasola V., et al. (2016) ALMA Resolves the Torus of NGC 1068: Continuum and Molecular Line Emission. Astrophys J Lett 823: L12-doi:10.3847/2041-8205/823/1/L12
- Gardner et al. (2006) Gardner J. P., Mather J. C., Clampin M., et al. (2006) The James Webb Space Telescope. Space Science Reviews, 123: 485-606. doi:10.1007/s11214-006-8315-7
- Gaskell (2004) Gaskell C. M. (2004) Lognormal X-Ray Flux Variations in an Extreme Narrow-Line Seyfert 1 Galaxy. Astrophys J Lett 612: L21-L24. doi:10.1086/424565
- Gendre et al. (2013) Gendre M. A., Best P. N., Wall J. V., Ker L. M. (2013) The relation between morphology, accretion modes and environmental factors in local radio AGN. MNRAS 430: 3086-3101. doi:10.1093/mnras/stt116
- Georgakakis et al. (2013) Georgakakis A., Carrera F., Lanzuisi G., Brightman M., Buchner J., Aird J., Page M., Cappi M., et al. (2013) The Hot and Energetic Universe: Understanding the build-up of supermassive black holes and galaxies at the heyday of the Universe. arXiv:1306.2328
- Georgantopoulos et al. (2011) Georgantopoulos I., Rovilos E., Akylas A., Comastri A., Ranalli P., Vignali C., Balestra I., Gilli R., et al. (2011) On the - ratio as a diagnostic for Compton-thick AGN. Astron Astrophys 534: A23. doi:10.1051/0004-6361/201117400
- Georgantopoulos et al. (2013) Georgantopoulos I., Comastri A., Vignali C., Ranalli P., Rovilos E., Iwasawa K., Gilli R., Cappelluti N., et al. (2013) The XMM deep survey in the CDF-S. IV. Compton-thick AGN candidates. Astron Astrophys 555: A43. doi:10.1051/0004-6361/201220828
- Ghisellini (2010) Ghisellini G. (2010) The jet/disk connection in blazars. American Institute of Physics Conference Series 1242: 43-54. doi:10.1063/1.3460151
- Giacconi (2009) Giacconi R. (2009) History of X-ray telescopes and astronomy. Experimental Astronomy 25: 143-156. doi:10.1007/s10686-009-9139-8
- Gierliński et al. (2008) Gierliński M., Middleton M., Ward M., Done C. (2008) A periodicity of hour in X-ray emission from the active galaxy RE J1034+396. Nature 455: 369-371. doi:10.1038/nature07277
- Gierliński, Nikołajuk, & Czerny (2008) Gierliński M., Nikołajuk M., Czerny B. (2008) High-frequency X-ray variability as a mass estimator of stellar and supermassive black holes. MNRAS 383: 741-749. doi:10.1111/j.1365-2966.2007.12584.x
- Gilfanov & Merloni (2014) Gilfanov M., Merloni A. (2014) Observational Appearance of Black Holes in X-Ray Binaries and AGN. Space Science Rev 183: 121-148. doi:10.1007/s11214-014-0071-5
- Gilli, Comastri, & Hasinger (2007) Gilli R., Comastri A., Hasinger G. (2007) The synthesis of the cosmic X-ray background in the Chandra and XMM-Newton era. Astron Astrophys 463: 79-96. doi:10.1051/0004-6361:20066334
- Giommi et al. (2012) Giommi P., Padovani P., Polenta G., Turriziani S., D’Elia V. & Piranomonte S. (2012) A simplified view of blazars: clearing the fog around long-standing selection effects. MNRAS 420: 2899-2911. doi:10.1111/j.1365-2966.2011.20044.x
- Giommi, Padovani & Polenta (2013) Giommi P., Padovani P., & Polenta G. (2013) A simplified view of blazars: the -ray case. MNRAS 431: 1914-1922. doi:10.1093/mnras/stt305
- Giommi & Padovani (2015) Giommi P., & Padovani P., (2015) A simplified view of blazars: contribution to the X-ray and gamma-ray cosmic backgrounds. MNRAS 450: 2404. doi:10.1093/mnras/stv793
- Glikman et al. (2007) Glikman E., Helfand D. J., White R. L., et al. (2007) The FIRST-2MASS Red Quasar Survey. Astrophys J 667:673–703. doi:10.1086/521073
- Glikman et al. (2011) Glikman E., Djorgovski S. G., Stern D., Dey A., Jannuzi B. T., Lee K.-S. (2011) The Faint End of the Quasar Luminosity Function at z 4: Implications for Ionization of the Intergalactic Medium and Cosmic Downsizing. Astrophys J Lett 728: L26. doi:10.1088/2041-8205/728/2/L26
- González-Martín & Vaughan (2012) González-Martín O., Vaughan S. (2012) X-ray variability of 104 active galactic nuclei. XMM-Newton power-spectrum density profiles. Astron Astrophys 544: A80. doi:10.1051/0004-6361/201219008
- Goosmann & Matt (2011) Goosmann R. W., Matt G. (2011) Spotting the misaligned outflows in NGC 1068 using X-ray polarimetry. MNRAS 415: 3119-3128. doi:10.1111/j.1365-2966.2011.18923.x
- Gorjian et al. (2008) Gorjian V., Brodwin M., Kochanek C. S., et al. (2008) The Mid-Infrared Properties of X-Ray Sources. Astrophys J 679:1040-1046. doi:10.1086/587431
- Goulding et al. (2012) Goulding A. D., Alexander D. M., Bauer F. E., Forman W. R., Hickox R. C., Jones C., Mullaney J. R., Trichas M., et al. (2012) Deep Silicate Absorption Features in Compton-thick Active Galactic Nuclei Predominantly Arise due to Dust in the Host Galaxy. Astrophys J 755: 5. doi:10.1088/0004-637X/755/1/5
- Goulding et al. (2014) Goulding A. D., Forman W. R., Hickox R. C., et al. (2014) Tracing the Evolution of Active Galactic Nuclei Host Galaxies over the Last 9 Gyr of Cosmic Time. Astrophys J 783:40. doi:10.1088/0004-637X/783/1/40
- Greene & Ho (2007) Greene J. E., Ho L. C. (2007) The Mass Function of Active Black Holes in the Local Universe. Astrophys J 667: 131-148. doi:10.1086/520497
- Gültekin et al. (2009) Gültekin K., Richstone D. O., Gebhardt K., et al. (2009) The M- and M-L Relations in Galactic Bulges, and Determinations of Their Intrinsic Scatter. Astrophys J 698:198–221. doi:10.1088/0004-637X/698/1/198
- Gürkan et al. (2015) Gürkan G., Hardcastle M. J., Jarvis M. J., Smith D. J. B., Bourne N., Dunne L., Maddox S., Ivison R. J., et al. (2015) Herschel-ATLAS: the connection between star formation and AGN activity in radio-loud and radio-quiet active galaxies. MNRAS 452: 3776-3794. doi:10.1093/mnras/stv1502
- Hainline et al. (2016) Hainline K. N., Reines A. E., Greene J. E., Stern D. (2016) Mid-Infrared Colors of Dwarf Galaxies: Young Starbursts Mimicking Active Galactic Nuclei. Astrophys J 832: 119-doi:10.3847/0004-637X/832/2/119
- Hamann et al. (2011) Hamann F., Kanekar N., Prochaska J. X., Murphy M. T., Ellison S., Malec A. L., Milutinovic N., Ubachs W., et al. (2011) A high-velocity narrow absorption line outflow in the quasar J212329.46 - 005052.9. MNRAS 410: 1957-1974. doi:10.1111/j.1365-2966.2010.17575.x
- Hao et al. (2005) Hao L., Spoon H. W. W., Sloan G. C., Marshall J. A., Armus L., Tielens A. G. G. M., Sargent B., van Bemmel I. M., et al. (2005) The Detection of Silicate Emission from Quasars at 10 and 18 Microns. Astrophys J Lett 625: L75-L78. doi:10.1086/431227
- Hao et al. (2010) Hao H., Elvis M., Civano F., et al. (2010) Hot-dust-poor Type 1 Active Galactic Nuclei in the COSMOS Survey. Astrophys J Lett 724:L59–L63. doi:10.1088/2041-8205/724/1/L59
- Hao et al. (2011) Hao H., Elvis M., Civano F., Lawrence A. (2011) Hot-dust-poor Quasars in Mid-infrared and Optically Selected Samples. Astrophys J 733:108. doi:10.1088/0004-637X/733/2/108
- Hardcastle et al. (2013) Hardcastle M. J., Ching J. H. Y., Virdee J. S., Jarvis M. J., Croom S. M., Sadler E. M., Mauch T., Smith D. J. B., et al. (2013) Herschel-ATLAS/GAMA: a difference between star formation rates in strong-line and weak-line radio galaxies. MNRAS 429: 2407-2424. doi:10.1093/mnras/sts510
- Hardcastle, Evans, & Croston (2006) Hardcastle M. J., Evans D. A., Croston J. H. (2006) The X-ray nuclei of intermediate-redshift radio sources. MNRAS 370: 1893-1904. doi:10.1111/j.1365-2966.2006.10615.x
- Hardcastle, Evans, & Croston (2007) Hardcastle M. J., Evans D. A., Croston J. H. (2007) Hot and cold gas accretion and feedback in radio-loud active galaxies. MNRAS 376: 1849-1856. doi:10.1111/j.1365-2966.2007.11572.x
- Hardcastle, Evans, & Croston (2009) Hardcastle M. J., Evans D. A., Croston J. H. (2009) The active nuclei of 3CRR radio sources. MNRAS 396: 1929-1952. doi:10.1111/j.1365-2966.2009.14887.x
- Hardcastle (2015) Hardcastle M. (2015) Kiloparsec-Scale AGN Jets. In: Contopoulos I., Gabuzda D., Kylafis N. (eds) The Formation and Disruption of Black Hole Jets, Astrophysics and Space Science Library, vol 414, p 83. doi:10.1007/978-3-319-10356-3_4
- Harrison (2014) Harrison, C. M. (2014) Observational constraints on the influence of active galactic nuclei on the evolution of galaxies. PhD Thesis. doi:10.1007/978-3-319-28454-5
- Harrison et al. (2013) Harrison F. A., Craig W. W., Christensen F. E., Hailey C. J., Zhang W. W., Boggs S. E., Stern D., Cook W. R., et al. (2013) The Nuclear Spectroscopic Telescope Array (NuSTAR) High-energy X-Ray Mission. Astrophys J 770: 103. doi:10.1088/0004-637X/770/2/103
- Hasinger (2004) Hasinger G. (2004) The X-ray background and AGNs. Nuclear Physics B Proceedings Supplements 132:86–96. doi:10.1016/j.nuclphysbps.2004.04.127
- Hatziminaoglou, Mathez & Pelló (2000) Hatziminaoglou E., Mathez G., Pelló R. (2000) Quasar candidate multicolor selection technique: a different approach. Astron Astrophys 359: 9-17
- Hatziminaoglou et al. (2005) Hatziminaoglou E., Pérez-Fournon I., Polletta M. et al. (2005) Sloan Digital Sky Survey Quasars in the Spitzer Wide-Area Infrared Extragalactic Survey (SWIRE) ELAIS N1 Field: Properties and Spectral Energy Distributions. Astronom J 129:1198–1211. doi:10.1086/428003
- Hatziminaoglou et al. (2008) Hatziminaoglou E., Fritz J., Franceschini A., Afonso-Luis A., Hernán-Caballero A., Pérez-Fournon I., Serjeant S., Lonsdale C., et al. (2008) Properties of dusty tori in active galactic nuclei - I. The case of SWIRE/SDSS quasars. MNRAS 386: 1252-1264. doi:10.1111/j.1365-2966.2008.13119.x
- Hatziminaoglou et al. (2009) Hatziminaoglou E., Fritz J., and Jarrett T. H. (2009) Properties of dusty tori in active galactic nuclei - II. Type 2 AGN. MNRAS 399:1206–1222. doi:10.1111/j.1365-2966.2009.15390.x
- Hatziminaoglou et al. (2010) Hatziminaoglou E., Omont A., Stevens J. A., et al. (2010) HerMES: Far infrared properties of known AGN in the HerMES fields. Astron Astrophys 518:L33. doi:10.1051/0004-6361/201014679
- Hatziminaoglou et al. (2015) Hatziminaoglou E., Hernán-Caballero A., Feltre A. and Piñol Ferrer N. (2015) A Complete Census of Silicate Features in the Mid-infrared Spectra of Active Galaxies. Astrophys J 803:110. doi:10.1088/0004-637X/803/2/110
- Heckman (1980) Heckman T. M. (1980) An optical and radio survey of the nuclei of bright galaxies - Activity in normal galactic nuclei. Astron Astrophys 87: 152-164
- Heckman et al. (2004) Heckman T. M., Kauffmann G., Brinchmann J., Charlot S., Tremonti C., White S. D. M. (2004) Present-Day Growth of Black Holes and Bulges: The Sloan Digital Sky Survey Perspective. Astrophys J 613: 109-118. doi:10.1086/422872
- Heckman & Best (2014) Heckman T. M., Best P. N. (2014) The Coevolution of Galaxies and Supermassive Black Holes: Insights from Surveys of the Contemporary Universe. Annu Rev Astron Astr 52: 589-660. doi:10.1146/annurev-astro-081913-035722
- Hernández-García et al. (2015) Hernández-García L., Masegosa J., González-Martín O., Márquez I. (2015) X-ray spectral variability of Seyfert 2 galaxies. Astron Astrophys 579: A90. doi:10.1051/0004-6361/201526127
- Hernán-Caballero & Hatziminaoglou (2011) Hernán-Caballero A. & Hatziminaoglou E. (2011) An atlas of mid-infrared spectra of star-forming and active galaxies. MNRAS 414:500–511. doi = 10.1111/j.1365-2966.2011.18413.x
- Hernán-Caballero et al. (2016) Hernán-Caballero A., Hatziminaoglou E., Alonso-Herrero A., Mateos S. (2016) The near-to-mid infrared spectrum of quasars. MNRAS 463:2064–2078. doi:10.1093/mnras/stw2107
- Herrera Ruiz et al. (2016) Herrera Ruiz N., Middelberg E., Norris R. P., Maini A. (2016) Unveiling the origin of the radio emission in radio-quiet quasars. Astron Astrophys 589: L2. doi:10.1051/0004-6361/201628302
- Hewett & Foltz (2003) Hewett P. C., Foltz C. B. (2003) The Frequency and Radio Properties of Broad Absorption Line Quasars. Astronom J 125: 1784-1794. doi:10.1086/368392
- Hewett & Wild (2010) Hewett P. C., Wild V. (2010) Improved redshifts for SDSS quasar spectra. MNRAS 405: 2302-2316. doi:10.1111/j.1365-2966.2010.16648.x
- Hickox et al. (2007) Hickox R. C., Jones C., Forman W. R., Murray S. S., Brodwin M., Brown M. J. I., Eisenhardt P. R., Stern D., et al. (2007) A Large Population of Mid-Infrared-selected, Obscured Active Galaxies in the Bootes Field. Astrophys J 671: 1365-1387. doi:10.1086/523082
- Hickox et al. (2009) Hickox R. C., Jones C., Forman W. R., Murray S. S., Kochanek C. S., Eisenstein D., Jannuzi B. T., Dey A., et al. (2009) Host Galaxies, Clustering, Eddington Ratios, and Evolution of Radio, X-Ray, and Infrared-Selected AGNs. Astrophys J 696: 891-919. doi:10.1088/0004-637X/696/1/891
- Hickox et al. (2014) Hickox R. C., Mullaney J. R., Alexander D. M., et al. (2014) Black Hole Variability and the Star Formation-Active Galactic Nucleus Connection: Do All Star-forming Galaxies Host an Active Galactic Nucleus? Astrophys J 782:9. doi:10.1088/0004-637X/782/1/9
- Hickox et al. (2016) Hickox R. C., Lamassa S. M., Silverman J. D., Kolodzig A. (2016) Host galaxies and large-scale structures of active galactic nuclei. IAU Focus Meeting 29:113–123. doi:10.1017/S1743921316004592
- Hine & Longair (1979) Hine R. G., Longair M. S. (1979) Optical spectra of 3CR radio galaxies. MNRAS 188: 111-130. doi:10.1093/mnras/188.1.111
- Hirschmann et al. (2014) Hirschmann M., Dolag K., Saro A., et al (2014) Cosmological simulations of black hole growth: AGN luminosities and downsizing. MNRAS 442:2304–2324. doi:10.1093/mnras/stu1023
- Ho (2008) Ho L. C. (2008) Nuclear Activity in Nearby Galaxies. Annu Rev Astron Astr 46: 475-539. doi:10.1146/annurev.astro.45.051806.110546
- Hönig et al. (2011) Hönig S. F., Leipski C., Antonucci R., Haas M. (2011) Quantifying the Anisotropy in the Infrared Emission of Powerful Active Galactic Nuclei. Astrophys J 736:26. doi:10.1088/0004-637X/736/1/26
- Hogg & Reynolds (2016) Hogg J. D., Reynolds C. S. (2016) Testing the Propagating Fluctuations Model with a Long, Global Accretion Disk Simulation. Astrophys J 826: 40. doi:10.3847/0004-637X/826/1/40
- Hook et al. (1994) Hook I. M., McMahon R. G., Boyle B. J., Irwin M. J. (1994) The Variability of Optically Selected Quasars. MNRAS 268: 305. doi:10.1093/mnras/268.2.305
- Hopkins, Richards, & Hernquist (2007) Hopkins P. F., Richards G. T., Hernquist L. (2007) An Observational Determination of the Bolometric Quasar Luminosity Function. Astrophys J 654: 731-753. doi:10.1086/509629
- Hopkins et al. (2008) Hopkins P. F., Hernquist L., Cox T. J., Kereš D. (2008) A Cosmological Framework for the Co-Evolution of Quasars, Supermassive Black Holes, and Elliptical Galaxies. I. Galaxy Mergers and Quasar Activity. Astrophys J Suppl 175:356-389. doi:10.1086/524362
- Hopkins et al. (2017) Hopkins P. F., Wetzel A., Keres D., et al. (2017) FIRE-2 Simulations: Physics versus Numerics in Galaxy Formation. MNRAS submitted (arXiv:170206148)
- Hornschemeier et al. (2005) Hornschemeier A. E., Heckman T. M., Ptak A. F., Tremonti C. A., Colbert E. J. M. (2005) Chandra-SDSS Normal and Star-Forming Galaxies. I. X-Ray Source Properties of Galaxies Detected by the Chandra X-Ray Observatory in SDSS DR2. Astronom J 129: 86-103. doi:
- Houck et al. (2004) Houck J. R., Roellig T. L., van Cleve J., et al. (2004) The Infrared Spectrograph (IRS) on the Spitzer Space Telescope. Astrophys J Suppl 154:18–24. doi:10.1086/423134
- Hsu et al. (2014) Hsu L.-T., Salvato M., Nandra K., Brusa M., Bender R., Buchner J., Donley J. L., Kocevski D. D., et al. (2014) CANDELS/GOODS-S, CDFS, and ECDFS: Photometric Redshifts for Normal and X-Ray-Detected Galaxies. Astrophys J 796: 60. doi:10.1088/0004-637X/796/1/60
- Hubeny et al. (2001) Hubeny I., Blaes O., Krolik J. H., Agol E. (2001) Non-LTE Models and Theoretical Spectra of Accretion Disks in Active Galactic Nuclei. IV. Effects of Compton Scattering and Metal Opacities. Astrophys J 559:680-702. doi:10.1086/322344
- Ilbert et al. (2009) Ilbert O., Capak P., Salvato M., Aussel H., McCracken H. J., Sanders D. B., Scoville N., Kartaltepe J., et al. (2009) Cosmos Photometric Redshifts with 30-Bands for 2-deg2. Astrophys J 690: 1236-1249. doi:10.1088/0004-637X/690/2/1236
- Ilbert et al. (2010) Ilbert O., Salvato M., Le Floc’h E., Aussel H., Capak P., McCracken H. J., Mobasher B., Kartaltepe J., et al. (2010) Galaxy Stellar Mass Assembly Between from the S-COSMOS Survey. Astrophys J 709: 644-663. doi:10.1088/0004-637X/709/2/644
- Imanishi, Nakanishi, & Izumi (2016) Imanishi M., Nakanishi K., Izumi T. (2016) ALMA 0.1-0.2 arcsec Resolution Imaging of the NGC 1068 Nucleus: Compact Dense Molecular Gas Emission at the Putative AGN Location. Astrophys J Lett 822: L10-doi:10.3847/2041-8205/822/1/L10
- Ingram & van der Klis (2013) Ingram A., van der Klis M. (2013) An exact analytic treatment of propagating mass accretion rate fluctuations in X-ray binaries. MNRAS 434: 1476-1485. doi:10.1093/mnras/stt1107
- Ivezić et al. (2002) Ivezić Ž., Menou K., Knapp G. R., Strauss M. A., Lupton R. H., Vanden Berk D. E., Richards G. T., Tremonti C., et al. (2002) Optical and Radio Properties of Extragalactic Sources Observed by the FIRST Survey and the Sloan Digital Sky Survey. Astronom J 124: 2364-2400. doi:10.1086/344069
- Jaffe et al. (2004) Jaffe W., Meisenheimer K., Röttgering H. J. A. et al. (2004) The central dusty torus in the active nucleus of NGC 1068. Nature 429:47-49. doi:10.1038/nature02531
- Jansen et al. (2001) Jansen F., Lumb D., Altieri B., Clavel J., Ehle M., Erd C., Gabriel C., Guainazzi M., et al. (2001) XMM-Newton observatory. I. The spacecraft and operations. Astron Astrophys 365: L1-L6. doi:10.1051/0004-6361:20000036
- Jarrett et al. (2011) Jarrett T. H., Cohen M., Masci F., et al. (2011) The Spitzer-WISE Survey of the Ecliptic Poles. Astrophys J 735:112. doi:10.1088/0004-637X/735/2/112
- Jiang et al. (2010) Jiang L., Fan X., Brandt W. N., et al. (2010) Dust-free quasars in the early Universe. Nature 464:380–383. doi:10.1038/nature08877
- Johnson et al. (2015) Johnson M. D., Fish V. L., Doeleman S. S., et al. (2015) Resolved magnetic-field structure and variability near the event horizon of Sagittarius A*. Science 350:1242–1245. doi:10.1126/science.aac7087
- Jones et al. (2014) Jones S. F., Blain A. W., Stern D., et al. (2014) Submillimetre observations of WISE-selected high-redshift, luminous, dusty galaxies. MNRAS 443:146–157. doi:10.1093/mnras/stu1157
- Jones et al. (2016) Jones M. L., Hickox R. C., Black C. S., et al. (2016) The Intrinsic Eddington Ratio Distribution of Active Galactic Nuclei in Star-forming Galaxies from the Sloan Digital Sky Survey. Astrophys J 826:12. doi:10.3847/0004-637X/826/1/12
- Jud et al. (2017) Jud H., Schartmann M., Mould J., Burtscher L., Tristram K. R. W. (2017) Radiative transfer modelling of parsec-scale dusty warped discs. MNRAS 465:248–259. doi:10.1093/mnras/stw2755
- Jun & Im (2013) Jun H. D., Im M. (2013) Physical Properties of Luminous Dust-poor Quasars. Astrophys J 779: 104-doi:10.1088/0004-637X/779/2/104
- Kara et al. (2016) Kara E., Alston W. N., Fabian A. C., Cackett E. M., Uttley P., Reynolds C. S., Zoghbi A. (2016) A global look at X-ray time lags in Seyfert galaxies. MNRAS 462: 511-531. doi:10.1093/mnras/stw1695
- Kauffmann et al. (2003a) Kauffmann G., Heckman T. M., Tremonti C., Brinchmann J., Charlot S., White S. D. M., Ridgway S. E., Brinkmann J., et al. (2003a) The host galaxies of active galactic nuclei. MNRAS 346: 1055-1077. doi:10.1111/j.1365-2966.2003.07154.x
- Kauffmann et al. (2003b) Kauffmann G., Heckman T. M., White S. D. M., Charlot S., Tremonti C., Brinchmann J., Bruzual G., Peng E. W., et al. (2003b) Stellar masses and star formation histories for galaxies from the Sloan Digital Sky Survey. MNRAS 341: 33-53. doi:10.1046/j.1365-8711.2003.06291.x
- Keel et al. (2012) Keel W. C., Lintott C. J., Schawinski K., Bennert V. N., Thomas D., Manning A., Chojnowski S. D., van Arkel H., et al. (2012) The History and Environment of a Faded Quasar: Hubble Space Telescope Observations of Hanny’s Voorwerp and IC 2497. Astronom J 144: 66-doi:10.1088/0004-6256/144/2/66
- Kellermann et al. (1989) Kellermann K. I., Sramek R., Schmidt M., Shaffer D. B., Green R. (1989) VLA observations of objects in the Palomar Bright Quasar Survey. Astronom J 98: 1195-1207. doi:10.1086/115207
- Kellermann (2015) Kellermann K. I. (2015) The road to quasars. IAU Symposium 313: 190-195. doi:10.1017/S1743921315002185
- Kelly et al. (2014) Kelly B. C., Becker A. C., Sobolewska M., Siemiginowska A., Uttley P. (2014) Flexible and Scalable Methods for Quantifying Stochastic Variability in the Era of Massive Time-domain Astronomical Data Sets. Astrophys J 788: 33. doi:10.1088/0004-637X/788/1/33
- Kelly, Bechtold, & Siemiginowska (2009) Kelly B. C., Bechtold J., Siemiginowska A. (2009) Are the Variations in Quasar Optical Flux Driven by Thermal Fluctuations?. Astrophys J 698: 895-910. doi:10.1088/0004-637X/698/1/895
- Kewley et al. (2001) Kewley L. J., Dopita M. A., Sutherland R. S., Heisler C. A., Trevena J. (2001) Theoretical Modeling of Starburst Galaxies. Astrophys J 556: 121-140. doi:10.1086/321545
- Kewley, Groves, Kauffmann, & Heckman (2006) Kewley L. J., Groves B., Kauffmann G., Heckman T. (2006) The host galaxies and classification of active galactic nuclei. MNRAS 372: 961-976. doi:10.1111/j.1365-2966.2006.10859.x
- Kimball & Ivezić (2008) Kimball A. E., Ivezić Ž. (2008) A Unified Catalog of Radio Objects Detected by NVSS, First, WENSS, GB6, and SDSS. Astronom J 136: 684-712. doi:10.1088/0004-6256/136/2/684
- Kimball et al. (2011) Kimball A. E., Kellermann K. I., Condon J. J., Ivezić Ž., Perley R. A. (2011) The Two-component Radio Luminosity Function of Quasi-stellar Objects: Star Formation and Active Galactic Nucleus. Astrophys J Lett 739: L29. doi:10.1088/2041-8205/739/1/L29
- Kirkpatrick et al. (2012) Kirkpatrick A., Pope A., Alexander D. M., et al. (2012) GOODS-Herschel: Impact of Active Galactic Nuclei and Star Formation Activity on Infrared Spectral Energy Distributions at High Redshift. Astrophys J 759:139. doi:10.1088/0004-637X/759/2/139
- Koenig et al. (2012) Koenig X. P., Leisawitz D. T., Benford D. J., Rebull L. M., Padgett D. L., Assef R. J. (2012) Wide-field Infrared Survey Explorer Observations of the Evolution of Massive Star-forming Regions. Astrophys J 744: 130. doi:10.1088/0004-637X/744/2/130
- Körding et al. (2007) Körding E. G., Migliari S., Fender R., Belloni T., Knigge C., McHardy I. (2007) The variability plane of accreting compact objects. MNRAS 380: 301-310. doi:10.1111/j.1365-2966.2007.12067.x
- Korol, Ciotti, & Pellegrini (2016) Korol V., Ciotti L., Pellegrini S. (2016) Bondi accretion in early-type galaxies. MNRAS 460: 1188-1200. doi:10.1093/mnras/stw1029
- Koss et al. (2016) Koss M. J., Assef R., Baloković M., Stern D., Gandhi P., Lamperti I., Alexander D. M., Ballantyne D. R., et al. (2016) A New Population of Compton-thick AGNs Identified Using the Spectral Curvature above 10 keV. Astrophys J 825: 85. doi:10.3847/0004-637X/825/2/85
- Kotov, Churazov, & Gilfanov (2001) Kotov O., Churazov E., Gilfanov M. (2001) On the X-ray time-lags in the black hole candidates. MNRAS 327: 799-807. doi:10.1046/j.1365-8711.2001.04769.x
- Kouzuma & Yamaoka (2010) Kouzuma S., Yamaoka H. (2010) Near-infrared colours of active galactic nuclei. Astron Astrophys 509:A64. doi:10.1051/0004-6361/200912863
- Kozłowski et al. (2016) Kozłowski S., Kochanek C. S., Ashby M. L. N., Assef R. J., Brodwin M., Eisenhardt P. R., Jannuzi B. T., Stern D., et al. (2016) Quasar Variability in the Mid-Infrared. Astrophys J 817: 119. doi:10.3847/0004-637X/817/2/119
- Krolik & Begelman (1988) Krolik J. H., Begelman M. C. (1988) Molecular tori in Seyfert galaxies - Feeding the monster and hiding it. Astrophys J 329:702–711. doi:10.1086/166414
- Kuehr et al. (1981) Kühr H., Witzel A., Pauliny-Toth I. I. K., Nauber U. (1981) A catalogue of extragalactic radio sources having flux densities greater than 1 Jy at 5 GHz. Astron Astrophys Suppl 45: 367-430
- LSST Science Collaboration et al. (2009) LSST Science Collaboration, Abell P. A., Allison J., Anderson S. F., Andrew J. R., Angel J. R. P., Armus L., Arnett D., et al. (2009) LSST Science Book, Version 2.0. arXiv:0912.0201
- La Franca et al. (2005) La Franca F., Fiore F., Comastri A., Perola G. C., Sacchi N., Brusa M., Cocchia F., Feruglio C., et al. (2005) The HELLAS2XMM Survey. VII. The Hard X-Ray Luminosity Function of AGNs up to z = 4: More Absorbed AGNs at Low Luminosities and High Redshifts. Astrophys J 635: 864-879. doi:10.1086/497586
- LaMassa et al. (2016) LaMassa S. M., Urry C. M., Cappelluti N., Böhringer H., Comastri A., Glikman E., Richards G., Ananna T., et al. (2016) The 31 Deg2 Release of the Stripe 82 X-Ray Survey: The Point Source Catalog. Astrophys J 817: 172. doi:10.3847/0004-637X/817/2/172
- Lacy et al. (2004) Lacy M., Storrie-Lombardi L. J., Sajina A., Appleton P. N., Armus L., Chapman S. C., Choi P. I., Fadda D., et al. (2004) Obscured and Unobscured Active Galactic Nuclei in the Spitzer Space Telescope First Look Survey. Astrophys J Suppl 154: 166-169. doi:10.1086/422816
- Lacy et al. (2007) Lacy M., Petric A. O., Sajina A., et al. (2007) Optical Spectroscopy and X-Ray Detections of a Sample of Quasars and Active Galactic Nuclei Selected in the Mid-Infrared from Two Spitzer Space Telescope Wide-Area Surveys. Astronom J 133:186–205. doi:10.1086/509617
- Lacy et al. (2013) Lacy M., Ridgway S. E., Gates E. L., et al. (2013) The Spitzer Mid-infrared Active Galactic Nucleus Survey. I. Optical and Near-infrared Spectroscopy of Obscured Candidates and Normal Active Galactic Nuclei Selected in the Mid-infrared. Astrophys J Suppl 208:24. doi:10.1088/0067-0049/208/2/24
- Laigle et al. (2016) Laigle C., McCracken H. J., Ilbert O., Hsieh B. C., Davidzon I., Capak P., Hasinger G., Silverman J. D., et al. (2016) The COSMOS2015 Catalog: Exploring the Universe with Half a Million Galaxies. Astrophys J Suppl 224: 24. doi:10.3847/0067-0049/224/2/24
- Laing, Riley, & Longair (1983) Laing R. A., Riley J. M., Longair M. S. (1983) Bright radio sources at 178 MHz - Flux densities, optical identifications and the cosmological evolution of powerful radio galaxies. MNRAS 204: 151-187. doi:10.1093/mnras/204.1.151
- Laing et al. (1994) Laing R. A., Jenkins C. R., Wall J. V., Unger S. W. (1994) Spectrophotometry of a Complete Sample of 3CR Radio Sources: Implications for Unified Models. The Physics of Active Galaxies 54: 201
- Lanzuisi et al. (2014) Lanzuisi G., Ponti G., Salvato M., Hasinger G., Cappelluti N., Bongiorno A., Brusa M., Lusso E., et al. (2014) Active Galactic Nucleus X-Ray Variability in the XMM-COSMOS Survey. Astrophys J 781: 105. doi:10.1088/0004-637X/781/2/105
- Laor & Davis (2014) Laor A., Davis S. W. (2014) Line-driven winds and the UV turnover in AGN accretion discs. MNRAS 438: 3024-3038. doi:10.1093/mnras/stt2408
- Laor & Netzer (1989) Laor A., Netzer H. (1989) Massive thin accretion discs. I - Calculated spectra. MNRAS 238:897-916. doi:10.1093/mnras/238.3.897
- Lawrence et al. (1987) Lawrence A., Watson M. G., Pounds K. A., Elvis M. (1987) Low-frequency divergent X-ray variability in the Seyfert galaxy NGC4051. Nature 325: 694-696. doi:10.1038/325694a0
- Lawrence (1991) Lawrence A. (1991) The relative frequency of broad-lined and narrow-lined active galactic nuclei - Implications for unified schemes. MNRAS 252:586–592. doi:10.1093/mnras/252.4.586
- Lawrence & Elvis (2010) Lawrence A., Elvis M. (2010) Misaligned Disks as Obscurers in Active Galaxies. Astrophys J 714:561–570. doi:10.1088/0004-637X/714/1/561
- Ledlow & Owen (1996) Ledlow M. J., Owen F. N. (1996) 20 CM VLA Survey of Abell Clusters of Galaxies. VI. Radio/Optical Luminosity Functions. Astronom J 112: 9. doi:10.1086/117985
- Leech et al. (1989) Leech K. J., Penston M. V., Terlevich R., et al. (1989) High-luminosity IRAS galaxies. II - Optical spectroscopy, modelling of starburst regions and comparison with structure. MNRAS 240:349–372. doi:10.1093/mnras/240.2.349
- Lehmer et al. (2010) Lehmer B. D., Alexander D. M., Bauer F. E., Brandt W. N., Goulding A. D., Jenkins L. P., Ptak A., Roberts T. P., et al. (2010) A Chandra Perspective on Galaxy-wide X-ray Binary Emission and its Correlation with Star Formation Rate and Stellar Mass: New Results from Luminous Infrared Galaxies. Astrophys J 724: 559-571. doi:10.1088/0004-637X/724/1/559
- Lehmer et al. (2012) Lehmer B. D., Xue Y. Q., Brandt W. N., Alexander D. M., Bauer F. E., Brusa M., Comastri A., Gilli R., et al. (2012) The 4 Ms Chandra Deep Field-South Number Counts Apportioned by Source Class: Pervasive Active Galactic Nuclei and the Ascent of Normal Galaxies. Astrophys J 752: 46. doi:10.1088/0004-637X/752/1/46
- Lehto (1989) Lehto H. J. (1989) A model for 1/f-type variability in active galactic nuclei. Two Topics in X-Ray Astronomy, Volume 1: X Ray Binaries. Volume 2: AGN and the X Ray Background 296: 499-503
- Leighly (2004) Leighly K. M. (2004) Hubble Space Telescope STIS Ultraviolet Spectral Evidence of Outflow in Extreme Narrow-Line Seyfert 1 Galaxies. II. Modeling and Interpretation. Astrophys J 611: 125-152. doi:10.1086/422089
- LHAASO Collaboration (2016) LHAASO Collaboration (2016) Gamma Ray Astronomy with LHAASO. Journal of Physics Conference Series 718: 052043. doi:10.1088/1742-6596/718/5/052043
- Lichti et al. (2008) Lichti G. G., Bottacini E., Ajello M., Charlot P., Collmar W., Falcone A., Horan D., Huber S., et al. (2008) INTEGRAL observations of the blazar Mrk 421 in outburst. Results of a multi-wavelength campaign. Astron Astrophys 486: 721-734. doi:10.1051/0004-6361:20079199
- Longair (1966) Longair M. S. (1966) On the interpretation of radio source counts. MNRAS 133: 421-436. doi:10.1093/mnras/133.4.421
- López-Gonzaga et al. (2017) López-Gonzaga N., Asmus D., Bauer F. E., Tristram K. R. W., Burtscher L., Marinucci A., Matt G., Harrison F. A., et al. (2017) NGC 1068: No change in the mid-IR torus structure despite X-ray variability. Astron Astrophys Astron Astrophys 602: A78. doi:10.1051/0004-6361/201629600
- Luo et al. (2014) Luo B., Brandt W. N., Alexander D. M., Stern D., Teng S. H., Arévalo P., Bauer F. E., Boggs S. E., et al. (2014) Weak Hard X-Ray Emission from Broad Absorption Line Quasars: Evidence for Intrinsic X-Ray Weakness. Astrophys J 794: 70. doi:10.1088/0004-637X/794/1/70
- Luo et al. (2017) Luo B., Brandt W. N., Xue Y. Q., Lehmer B., Alexander D. M., Bauer F. E., Vito F., Yang G., et al. (2017) The Chandra Deep Field-South Survey: 7 Ms Source Catalogs. Astrophys J Suppl 228: 2. doi:10.3847/1538-4365/228/1/2
- Lusso & Risaliti (2016) Lusso E., Risaliti G. (2016) The Tight Relation between X-Ray and Ultraviolet Luminosity of Quasars. Astrophys J 819: 154. doi:10.3847/0004-637X/819/2/154
- Lyu, Rieke, & Shi (2017) Lyu J., Rieke G. H., Shi Y. (2017) Dust-deficient Palomar-Green Quasars and the Diversity of AGN Intrinsic IR Emission. Astrophys J 835: 257. doi:10.3847/1538-4357/835/2/257
- Lyubarskii (1997) Lyubarskii Y. E. (1997) Flicker noise in accretion disks. MNRAS 292: 679. doi:10.1093/mnras/292.3.679
- MacLeod et al. (2010) MacLeod C. L., Ivezić Ž., Kochanek C. S., Kozłowski S., Kelly B., Bullock E., Kimball A., Sesar B., et al. (2010) Modeling the Time Variability of SDSS Stripe 82 Quasars as a Damped Random Walk. Astrophys J 721: 1014-1033. doi:10.1088/0004-637X/721/2/1014
- MacLeod et al. (2016) MacLeod C. L., Ross N. P., Lawrence A., Goad M., Horne K., Burgett W., Chambers K. C., Flewelling H., et al. (2016) A systematic search for changing-look quasars in SDSS. MNRAS 457: 389-404. doi:10.1093/mnras/stv2997
- Magnelli et al. (2012) Magnelli B., Lutz D., Santini P., et al. (2012) A Herschel view of the far-infrared properties of submillimetre galaxies. Astron Astrophys 539:A155. doi:10.1051/0004-6361/201118312
- Magorrian et al. (1998) Magorrian J., Tremaine S., Richstone D., et al. (1998) The Demography of Massive Dark Objects in Galaxy Centers. Astronom J 115:2285–2305. doi:10.1086/300353
- Maini et al. (2016) Maini A., Prandoni I., Norris R. P., Giovannini G., Spitler L. R. (2016) Compact radio cores in radio-quiet active galactic nuclei. Astron Astrophys 589: L3. doi:10.1051/0004-6361/201628305
- Malizia et al. (2012) Malizia A., Bassani L., Bazzano A., Bird A. J., Masetti N., Panessa F., Stephen J. B., Ubertini P., et al. (2012) The INTEGRAL/IBIS AGN catalogue - I. X-ray absorption properties versus optical classification. MNRAS 426: 1750-1766. doi:10.1111/j.1365-2966.2012.21755.x
- Malzac (2014) Malzac J. (2014) The spectral energy distribution of compact jets powered by internal shocks. MNRAS 443: 299-317. doi:10.1093/mnras/stu1144
- Manners, Almaini, & Lawrence (2002) Manners J., Almaini O., Lawrence A. (2002) The X-ray variability of high-redshift QSOs. MNRAS 330: 390-398. doi:10.1046/j.1365-8711.2002.05065.x
- Mannheim (1993) Mannheim K., (1993) The proton blazar. Astron Astrophys 269: 67
- Maoz et al. (2005) Maoz D., Nagar N. M., Falcke H., Wilson A. S. (2005) The Murmur of the Sleeping Black Hole: Detection of Nuclear Ultraviolet Variability in LINER Galaxies. Astrophys J 625:699–715. doi:10.1086/429795
- Maraschi, Ghisellini & Celotti (1992) Maraschi L., Ghisellini G., & Celotti A. (1992) A jet model for the gamma-ray emitting blazar 3C 279. Astrophys J Lett 397: L5. doi:10.1086/186531
- Marchesi et al. (2016) Marchesi S., Civano F., Elvis M., Salvato M., Brusa M., Comastri A., Gilli R., Hasinger G., et al. (2016) The Chandra COSMOS Legacy survey: optical/IR identifications. Astrophys J 817: 34-doi:10.3847/0004-637X/817/1/34
- Marconi & Hunt (2003) Marconi A., Hunt L. K. (2003) The Relation between Black Hole Mass, Bulge Mass, and Near-Infrared Luminosity. Astrophys J Lett 589:L21–L24. doi:10.1086/375804
- Marscher & Gear (1985) Marscher A. P., Gear W. K. (1985) Models for high-frequency radio outbursts in extragalactic sources, with application to the early 1983 millimeter-to-infrared flare of 3C 273. Astrophys J 298: 114-127. doi:10.1086/163592
- Marshall, Warwick, & Pounds (1981) Marshall N., Warwick R. S., Pounds K. A. (1981) The variability of X-ray emission from active galaxies. MNRAS 194: 987-1002. doi:10.1093/mnras/194.4.987
- Mateos et al. (2012) Mateos S., Alonso-Herrero A., Carrera F. J., et al. (2012) Using the Bright Ultrahard XMM-Newton survey to define an IR selection of luminous AGN based on WISE colours. MNRAS 426:3271–3281. doi:10.1111/j.1365-2966.2012.21843.x
- Mateos et al. (2016) Mateos S., Carrera F. J., Alonso-Herrero A., et al. (2016) X-Ray Absorption, Nuclear Infrared Emission, and Dust Covering Factors of AGNs: Testing Unification Schemes. Astrophys J 819:166. doi:10.3847/0004-637X/819/2/166
- Matt, Guainazzi, & Maiolino (2003) Matt G., Guainazzi M., Maiolino R. (2003) Changing look: from Compton-thick to Compton-thin, or the rebirth of fossil active galactic nuclei. MNRAS 342: 422-426. doi:10.1046/j.1365-8711.2003.06539.x
- Max-Moerbeck et al. (2014) Max-Moerbeck W., Hovatta T., Richards J. L., King O. G., Pearson T. J., Readhead A. C. S. et al. (2014) Time correlation between the radio and gamma-ray activity in blazars and the production site of the gamma-ray emission. MNRAS 445: 428-436. doi: 10.1093/mnras/stu1749
- McAlpine et al. (2017) McAlpine S., Bower R. G., Harrison C. M., et al. (2017) The link between galaxy and black hole growth in the eagle simulation. MNRAS 468:3395–3407. doi:10.1093/mnras/stx658
- McGreer et al. (2013) McGreer I. D., Jiang L., Fan X., Richards G. T., Strauss M. A., Ross N. P., White M., Shen Y., et al. (2013) The z = 5 Quasar Luminosity Function from SDSS Stripe 82. Astrophys J 768: 105. doi:10.1088/0004-637X/768/2/105
- McHardy et al. (2004) McHardy I. M., Papadakis I. E., Uttley P., Page M. J., Mason K. O. (2004) Combined long and short time-scale X-ray variability of NGC 4051 with RXTE and XMM-Newton. MNRAS 348: 783-801. doi:10.1111/j.1365-2966.2004.07376.x
- McHardy et al. (2006) McHardy I. M., Koerding E., Knigge C., Uttley P., Fender R. P. (2006) Active galactic nuclei as scaled-up Galactic black holes. Nature 444: 730-732. doi:10.1038/nature05389
- McHardy et al. (2007) McHardy I. M., Arévalo P., Uttley P., Papadakis I. E., Summons D. P., Brinkmann W., Page M. J. (2007) Discovery of multiple Lorentzian components in the X-ray timing properties of the Narrow Line Seyfert 1 Ark 564. MNRAS 382: 985-994. doi:10.1111/j.1365-2966.2007.12411.x
- McHardy et al. (2014) McHardy I. M., Cameron D. T., Dwelly T., Connolly S., Lira P., Emmanoulopoulos D., Gelbord J., Breedt E., et al. (2014) Swift monitoring of NGC 5548: X-ray reprocessing and short-term UV/optical variability. MNRAS 444: 1469-1474. doi:10.1093/mnras/stu1636
- Meier (2002) Meier D. L. (2002) Grand unification of AGN and the accretion and spin paradigms. New Astronom Rev 46: 247-255. doi:10.1016/S1387-6473(01)00189-0
- Mejia-Restrepo et al. (2016) Mejia-Restrepo J. E., Trakhtenbrot B., Lira P., Netzer H., Capellupo D. M. (2016) Active galactic nuclei at - II. Black hole mass estimation by means of broad emission lines. MNRAS 460:187-211. doi:10.1093/mnras/stw568
- Melbourne et al. (2012) Melbourne J., Soifer B. T., Desai V., et al. (2012) The Spectral Energy Distributions and Infrared Luminosities of z 2 Dust-obscured Galaxies from Herschel and Spitzer. Astronom J 143:125. doi:10.1088/0004-6256/143/5/125
- Mendez et al. (2013) Mendez A. J., Coil A. L., Aird J., et al. (2013) PRIMUS: Infrared and X-Ray AGN Selection Techniques at . Astrophys J 770:40. doi:10.1088/0004-637X/770/1/40
- Merloni & Heinz (2008) Merloni A., Heinz S. (2008) A synthesis model for AGN evolution: supermassive black holes growth and feedback modes. MNRAS 388: 1011-1030. doi:10.1111/j.1365-2966.2008.13472.x
- Merloni et al. (2012) Merloni A., Predehl P., Becker W., Böhringer H., Boller T., Brunner H., Brusa M., Dennerl K., et al. (2012) eROSITA Science Book: Mapping the Structure of the Energetic Universe. arXiv:1209.3114
- Merloni & Heinz (2013) Merloni A., Heinz S. (2013) Evolution of Active Galactic Nuclei. Planets, Stars and Stellar Systems. Volume 6: Extragalactic Astronomy and Cosmology 6: 503-566. doi:10.1007/978-94-007-5609-0_11
- Merloni et al. (2014) Merloni A., Bongiorno A., Brusa M., Iwasawa K., Mainieri V., Magnelli B., Salvato M., Berta S., et al. (2014) The incidence of obscuration in active galactic nuclei. MNRAS 437: 3550-3567. doi:10.1093/mnras/stt2149
- Merloni (2016) Merloni A. (2016) Observing Supermassive Black Holes Across Cosmic Time: From Phenomenology to Physics. Lecture Notes in Physics, Berlin Springer Verlag 905: 101:10.1007/978-3-319-19416-5_4
- Messias et al. (2012) Messias H., Afonso J., Salvato M., Mobasher B., Hopkins A. M. (2012) A New Infrared Color Criterion for the Selection of 0 z 7 AGNs: Application to Deep Fields and Implications for JWST Surveys. Astrophys J 754:120. doi:10.1088/0004-637X/754/2/120
- Miley (1980) Miley G. 1980, Annu Rev Astron Astr 18, 165
- Miller, Peacock, & Mead (1990) Miller L., Peacock J. A., Mead A. R. G. (1990) The bimodal radio luminosity function of quasars. MNRAS 244: 207-213
- Mineo, Gilfanov, & Sunyaev (2012a) Mineo S., Gilfanov M., Sunyaev R. (2012a) X-ray emission from star-forming galaxies - I. High-mass X-ray binaries. MNRAS 419: 2095-2115. doi:10.1111/j.1365-2966.2011.19862.x
- Mineo, Gilfanov, & Sunyaev (2012b) Mineo S., Gilfanov M., Sunyaev R. (2012b) X-ray emission from star-forming galaxies - II. Hot interstellarmedium. MNRAS 426: 1870-1883. doi:10.1111/j.1365-2966.2012.21831.x
- Mingo et al. (2014) Mingo B., Hardcastle M. J., Croston J. H., Dicken D., Evans D. A., Morganti R., Tadhunter C. (2014) An X-ray survey of the 2 Jy sample - I. Is there an accretion mode dichotomy in radio-loud AGN?. MNRAS 440: 269-297. doi:10.1093/mnras/stu263
- Miyaji et al. (2015) Miyaji T., Hasinger G., Salvato M., Brusa M., Cappelluti N., Civano F., Puccetti S., Elvis M., et al. (2015) Detailed Shape and Evolutionary Behavior of the X-Ray Luminosity Function of Active Galactic Nuclei. Astrophys J 804: 104:10.1088/0004-637X/804/2/104
- Miyamoto et al. (1988) Miyamoto S., Kitamoto S., Mitsuda K., Dotani T. (1988) Delayed hard X-rays from Cygnus X-1. Nature 336: 450-452. doi:10.1038/336450a0
- Moles et al. (2008) Moles M. et al. (2008) The Alhambra Survey: a Large Area Multimedium-Band Optical and Near-Infrared Photometric Survey. Astronom J 136:1325-1339. doi:10.1088/0004-6256/136/3/1325
- Mor & Trakhtenbrot (2011) Mor R., Trakhtenbrot B. (2011) Hot-dust Clouds with Pure-graphite Composition around type-I Active Galactic Nuclei. Astrophys J Lett 737:L36. doi:10.1088/2041-8205/737/2/L36
- Morganson et al. (2014) Morganson E., Burgett W. S., Chambers K. C., Green P. J., Kaiser N., Magnier E. A., Marshall P. J., Morgan J. S., et al. (2014) Measuring Quasar Variability with Pan-STARRS1 and SDSS. Astrophys J 784: 92. doi:10.1088/0004-637X/784/2/92
- Morić et al. (2010) Morić I., Smolčić V., Kimball A., Riechers D. A., Ivezić Ž., Scoville N. (2010) A Closer View of the Radio-FIR Correlation: Disentangling the Contributions of Star Formation and Active Galactic Nucleus Activity. Astrophys J 724: 779-790. doi:10.1088/0004-637X/724/1/779
- Mortlock et al. (2011) Mortlock D. J., Warren S. J., Venemans B. P., Patel M., Hewett P. C., McMahon R. G., Simpson C., Theuns T., et al. (2011) A luminous quasar at a redshift of z = 7.085. Nature 474: 616-619. doi:10.1038/nature10159
- Murakami et al. (2007) Murakami H., Baba H., Barthel P., et al. (2007) The Infrared Astronomical Mission AKARI. Publications Astron Soc Japan 59:S369. doi:10.1093/pasj/59.sp2.S369
- Müller-Sánchez et al. (2013) Müller-Sánchez F., Prieto M. A., Mezcua M., et al. (2013) The Central Molecular Gas Structure in LINERs with Low-luminosity Active Galactic Nuclei: Evidence for Gradual Disappearance of the Torus. Astrophys J Lett 763:L1. doi:10.1088/2041-8205/763/1/L1
- Murray et al. (2005) Murray S. S., Kenter A., Forman W. R., et al. (2005) XBootes: An X-Ray Survey of the NDWFS Bootes Field. I. Overview and Initial Results. Astrophys J Suppl 161:1–8. doi:10.1086/444378
- Mushotzky et al. (2011) Mushotzky R. F., Edelson R., Baumgartner W., Gandhi P. (2011) Kepler Observations of Rapid Optical Variability in Active Galactic Nuclei. Astrophys J Lett 743: L12. doi:10.1088/2041-8205/743/1/L12
- Mushotzky, Done, & Pounds (1993) Mushotzky R. F., Done C., Pounds K. A. (1993) X-ray spectra and time variability of active galactic nuclei. Annu Rev Astron Astr 31: 717-761. doi:10.1146/annurev.aa.31.090193.003441
- Nagar, Falcke, & Wilson (2005) Nagar N. M., Falcke H., Wilson A. S. (2005) Radio sources in low-luminosity active galactic nuclei. IV. Radio luminosity function, importance of jet power, and radio properties of the complete Palomar sample. Astron Astrophys 435: 521-543. doi:10.1051/0004-6361:20042277
- Nakagawa et al. (2015) Nakagawa T., Shibai H., Onaka T., Matsuhara H., Kaneda H., Kawakatsu Y. (2015) The Next-Generation Infrared Astronomy Mission SPICA Under the New Framework. Publication of Korean Astron Soc 30: 621-624. doi:10.5303/PKAS.2015.30.2.621
- Namekata & Umemura (2016) Namekata D., Umemura M. (2016) Sub-parsec-scale dynamics of a dusty gas disc exposed to anisotropic AGN radiation with frequency-dependent radiative transfer. MNRAS 460:980–1018. doi:10.1093/mnras/stw862
- Nandra et al. (1997) Nandra K., George I. M., Mushotzky R. F., Turner T. J., Yaqoob T. (1997) ASCA Observations of Seyfert 1 Galaxies. I. Data Analysis, Imaging, and Timing. Astrophys J 476: 70-82. doi:
- Nandra et al. (2013) Nandra K., Barret D., Barcons X., Fabian A., den Herder J.-W., Piro L., Watson M., Adami C., et al. (2013) The Hot and Energetic Universe: A White Paper presenting the science theme motivating the Athena+ mission. arXiv:1306.2307
- Narayan & Yi (1994) Narayan R., Yi I. (1994) Advection-dominated accretion: A self-similar solution. Astrophys J Lett 428: L13-L16. doi:10.1086/187381
- Narayan et al. (1998) Narayan R., Mahadevan R., Grindlay J. E., Popham R. G., Gammie C. (1998) Advection-dominated accretion model of Sagittarius A*: evidence for a black hole at the Galactic center.. Astrophys J 492: 554-568. doi:10.1086/305070
- Narayan, Igumenshchev, & Abramowicz (2003) Narayan R., Igumenshchev I. V., Abramowicz M. A. (2003) Magnetically Arrested Disk: an Energetically Efficient Accretion Flow. Publications Astron Soc Japan 55: L69-L72. doi:10.1093/pasj/55.6.L69
- Narayan et al. (2014) Narayan R, McClintock JE, Tchekhovskoy A (2014) Energy Extraction from Spinning Black Holes Via Relativistic Jets, p 523. doi:10.1007/978-3-319-06349-2_25
- Nardini et al. (2008) Nardini E., Risaliti G., Salvati M., et al. (2008) Spectral decomposition of starbursts and active galactic nuclei in 5-8 m Spitzer-IRS spectra of local ultraluminous infrared galaxies. MNRAS 385:L130–L134. doi:10.1111/j.1745-3933.2008.00450.x
- Nenkova, Ivezić, & Elitzur (2002) Nenkova M., Ivezić Ž., Elitzur M. (2002) Dust Emission from Active Galactic Nuclei. Astrophys J Lett 570: L9-L12. doi:10.1086/340857
- Nenkova et al. (2008) Nenkova M., Sirocky M. M., Nikutta R., Ivezić Ž., Elitzur M. (2008) AGN Dusty Tori. II. Observational Implications of Clumpiness. Astrophys J 685:160-180. doi:10.1086/590483
- Netzer & Trakhtenbrot (2014) Netzer H., Trakhtenbrot B. (2014) Bolometric luminosity black hole growth time and slim accretion discs in active galactic nuclei. MNRAS 438: 672-679. doi:10.1093/mnras/stt2238
- Netzer (2015) Netzer H. (2015) Revisiting the Unified Model of Active Galactic Nuclei. Annu Rev Astron Astr 53: 365-408. doi:10.1146/annurev-astro-082214-122302
- Nikołajuk et al. (2006) Nikołajuk M., Czerny B., Ziółkowski J., Gierliński M. (2006) Consistency of the black hole mass determination in AGN from the reverberation and the X-ray excess variance method. MNRAS 370: 1534-1540. doi:10.1111/j.1365-2966.2006.10576.x
- Nikołajuk, Papadakis, & Czerny (2004) Nikolajuk M., Papadakis I. E., Czerny B. (2004) Black hole mass estimation from X-ray variability measurements in active galactic nuclei. MNRAS 350: L26-L30. doi:10.1111/j.1365-2966.2004.07829.x
- Nikutta et al. (2009) Nikutta R., Elitzur M., Lacy M. (2009) On the 10 m Silicate Feature in Active Galactic Nuclei. Astrophys J 707:1550-1559. doi:10.1088/0004-637X/707/2/1550
- Norris et al. (2005) Norris R. P., Huynh M. T., Jackson C. A., Boyle B. J., Ekers R. D., Mitchell D. A., Sault R. J., Wieringa M. H., et al. (2005) Radio Observations of the Hubble Deep Field-South Region. I. Survey Description and Initial Results. Astronom J 130: 1358-1372. doi:10.1086/432872
- Norris et al. (2006) Norris R. P., Afonso J., Appleton P. N., Boyle B. J., Ciliegi P., Croom S. M., Huynh M. T., Jackson C. A., et al. (2006) Deep ATLAS Radio Observations of the Chandra Deep Field-South/Spitzer Wide-Area Infrared Extragalactic Field. Astronom J 132: 2409-2423. doi:10.1086/508275
- Norris et al. (2011) Norris R. P., Hopkins A. M., Afonso J., Brown S., Condon J. J., Dunne L., Feain I., Hollow R., et al. (2011) EMU: Evolutionary Map of the Universe. Publications Astron Soc Australia 28: 215-248. doi:10.1071/AS11021
- Norris et al. (2013) Norris R. P., Afonso J., Bacon D., Beck R., Bell M., Beswick R. J., Best P., Bhatnagar S., et al. (2013) Radio Continuum Surveys with Square Kilometre Array Pathfinders. Publications Astron Soc Australia 30: e020. doi:10.1017/pas.2012.020
- Novak et al. (2011) Novak G. S., Ostriker J. P., Ciotti L. (2011) Feedback from Central Black Holes in Elliptical Galaxies: Two-dimensional Models Compared to One-dimensional Models. Astrophys J 737:26. doi:10.1088/0004-637X/737/1/26
- Nowak et al. (1999) Nowak M. A., Wilms J., Vaughan B. A., Dove J. B., Begelman M. C. (1999) Rossi X-Ray Timing Explorer Observation of Cygnus X-1. III. Implications for Compton Corona and Advection-dominated Accretion Flow Models. Astrophys J 515: 726-737. doi:10.1086/307039
- O’Dea (1998) O’Dea C. P. (1998) The Compact Steep-Spectrum and Gigahertz Peaked-Spectrum Radio Sources. Publications Astron Soc Pacific 110: 493-532. doi:10.1086/316162
- O’Dea, Baum, & Stanghellini (1991) O’Dea C. P., Baum S. A., Stanghellini C. (1991) What are the gigahertz peaked-spectrum radio sources?. Astrophys J 380: 66-77. doi:10.1086/170562
- O’Neill et al. (2005) O’Neill P. M., Nandra K., Papadakis I. E., Turner T. J. (2005) The relationship between X-ray variability amplitude and black hole mass in active galactic nuclei. MNRAS 358: 1405-1416. doi:10.1111/j.1365-2966.2005.08860.x
- Orr & Browne (1982) Orr M. J. L., Browne I. W. A. (1982) Relativistic beaming and quasar statistics. MNRAS 200: 1067-1080. doi:10.1093/mnras/200.4.1067
- Osterbrock (1981) Osterbrock D. E. (1981) Seyfert galaxies with weak broad H alpha emission lines. Astrophys J 249: 462-470. doi:10.1086/159306
- Osterbrock & Pogge (1985) Osterbrock D. E., Pogge R. W. (1985) The spectra of narrow-line Seyfert 1 galaxies. Astrophys J 297: 166-176. doi:10.1086/163513
- Owen, Burns, & Rudnick (1978) Owen F. N., Burns J. O., Rudnick L. (1978) VLA observations of NGC 1265 at 4886 MHz. Astrophys J Lett 226: L119-L123. doi:10.1086/182845
- Oyabu et al. (2011) Oyabu S., Ishihara D., Malkan M., et al. (2011) AKARI detections of hot dust in luminous infrared galaxies. Search for dusty active galactic nuclei. Astron Astrophys 529:A122. doi:10.1051/0004-6361/201014221
- Padovani & Giommi (1995) Padovani P., Giommi P. (1995) The connection between x-ray- and radio-selected BL Lacertae objects. Astrophys J 444: 567-581. doi:10.1086/175631
- Padovani (2011) Padovani P. (2011) The microjansky and nanojansky radio sky: source population and multiwavelength properties. MNRAS 411: 1547-1561. doi:10.1111/j.1365-2966.2010.17789.x
- Padovani et al. (2011) Padovani P., Miller N., Kellermann K. I., Mainieri V., Rosati P., Tozzi P. (2011) The VLA Survey of Chandra Deep Field South. V. Evolution and Luminosity Functions of Sub-millijansky Radio Sources and the Issue of Radio Emission in Radio-quiet Active Galactic Nuclei. Astrophys J 740: 20. doi:10.1088/0004-637X/740/1/20
- Padovani & Giommi (2015) Padovani P., & Giommi P. (2015) A simplified view of blazars: the very high energy -ray vision. MNRAS 446: L41-L45. doi:10.1093/mnrasl/slu164
- Padovani et al. (2015) Padovani P., Bonzini M., Kellermann K. I., Miller N., Mainieri V., Tozzi P. (2015) Radio-faint AGN: a tale of two populations. MNRAS 452: 1263-1279. doi:10.1093/mnras/stv1375
- Padovani et al. (2016) Padovani P., Resconi E., Giommi P., Arsioli B., Chang Y. L. (2016) Extreme blazars as counterparts of IceCube astrophysical neutrinos. MNRAS 457: 3582-3592. doi:10.1093/mnras/stw228
- Padovani (2016) Padovani P. (2016) The faint radio sky: radio astronomy becomes mainstream. Astron Astrophys Rev 24: 13. doi:10.1007/s00159-016-0098-6
- Padovani (2017) Padovani P. (2017) On the two main classes of active galactic nuclei. Nature Astronomy, in press
- Page et al. (2014) Page M. J., Simpson C., Mortlock D. J., Warren S. J., Hewett P. C., Venemans B. P., McMahon R. G. (2014) X-rays from the redshift 7.1 quasar ULAS J1120+0641. MNRAS 440: L91-L95. doi:10.1093/mnrasl/slu022
- Panessa & Bassani (2002) Panessa F., Bassani L. (2002) Unabsorbed Seyfert 2 galaxies. Astron Astrophys 394: 435-442. doi:10.1051/0004-6361:20021161
- Paolillo et al. (2004) Paolillo M., Schreier E. J., Giacconi R., Koekemoer A. M., Grogin N. A. (2004) Prevalence of X-Ray Variability in the Chandra Deep Field-South. Astrophys J 611: 93-106. doi:10.1086/421967
- Paolillo et al. (2017) Paolillo M., Papadakis I., Brandt W. N., Luo B., Xue Y. Q., Tozzi P., Shemmer O., Allevato V., et al. (2017) Tracing the accretion history of supermassive Black Holes through X-ray variability: results from the Chandra Deep Field-South. MNRAS , in press (arXiv:1707.05332)
- Papadakis (2004) Papadakis I. E. (2004) The scaling of the X-ray variability with black hole mass in active galactic nuclei. MNRAS 348: 207-213. doi:10.1111/j.1365-2966.2004.07351.x
- Pâris et al. (2017) Pâris I., Petitjean P., Ross N. P., Myers A. D., Aubourg É., Streblyanska A., Bailey S., Armengaud É., et al. (2017) The Sloan Digital Sky Survey Quasar Catalog: Twelfth data release. Astron Astrophys 597: A79. doi:10.1051/0004-6361/201527999
- Peacock & Gull (1981) Peacock J. A., Gull S. F. (1981) Multifrequency models for the cosmological evolution of extragalactic radio sources. MNRAS 196: 611-633. doi:10.1093/mnras/196.3.611
- Peacock, Miller, & Longair (1986) Peacock J. A., Miller L., Longair M. S. (1986) The statistics of radio emission from quasars. MNRAS 218: 265-278. doi:10.1093/mnras/218.2.265
- Pellegrini (2010) Pellegrini S. (2010) The Nuclear X-ray Emission of Nearby Early-type Galaxies. Astrophys J 717: 640-652. doi:10.1088/0004-637X/717/2/640
- Perley, Willis, & Scott (1979) Perley R. A., Willis A. G., Scott J. S. (1979) The structure of the radio jets in 3C449. Nature 281: 437-442. doi:10.1038/281437a0
- Perlman et al. (2007) Perlman E. S., Mason R. E., Packham C., et al. (2007) The Mid-Infrared Emission of M87. Astrophys J 663:808–815. doi:10.1086/518781
- Peters et al. (2015) Peters C. M., Richards G. T., Myers A. D., Strauss M. A., Schmidt K. B., Ivezić Ž., Ross N. P., MacLeod C. L., et al. (2015) Quasar Classification Using Color and Variability. Astrophys J 811: 95. doi:10.1088/0004-637X/811/2/95
- Peterson (1993) Peterson B. M. (1993) Reverberation mapping of active galactic nuclei. Publications Astron Soc Pacific 105: 247-268. doi:10.1086/133140
- Peterson et al. (2004) Peterson B. M., Ferrarese L., Gilbert K. M., Kaspi S., Malkan M. A., Maoz D., Merritt D., Netzer H., et al. (2004) Central Masses and Broad-Line Region Sizes of Active Galactic Nuclei. II. A Homogeneous Analysis of a Large Reverberation-Mapping Database. Astrophys J 613: 682-699. doi:10.1086/423269
- Piccinotti et al. (1982) Piccinotti G., Mushotzky R. F., Boldt E. A., Holt S. S., Marshall F. E., Serlemitsos P. J., Shafer R. A. (1982) A complete X-ray sample of the high-latitude /absolute value of B greater than 20 deg/ sky from HEAO 1 A-2 - Log N-log S and luminosity functions. Astrophys J 253: 485-503. doi:10.1086/159651
- Pier & Krolik (1992) Pier EA and Krolik J. H. (1992) Infrared spectra of obscuring dust tori around active galactic nuclei. I - Calculational method and basic trends. Astrophys J 401:99–109. doi:10.1086/172042
- Pittori et al. (2009) Pittori C., Verrecchia F., Chen A.W., et al. (2009) First AGILE catalog of high-confidence gamma-ray sources. Astron Astrophys 506: 1563-1574. doi:10.1051/0004-6361/200911783
- Ponti et al. (2012) Ponti G., Papadakis I., Bianchi S., Guainazzi M., Matt G., Uttley P., Bonilla N. F. (2012) CAIXA: a catalogue of AGN in the XMM-Newton archive. III. Excess variance analysis. Astron Astrophys 542: A83. doi:10.1051/0004-6361/201118326
- Pracy et al. (2016) Pracy M. B., Ching J. H. Y., Sadler E. M., Croom S. M., Baldry I. K., Bland-Hawthorn J., Brough S., Brown M. J. I., et al. (2016) GAMA/WiggleZ: the 1.4 GHz radio luminosity functions of high- and low-excitation radio galaxies and their redshift evolution to z = 0.75. MNRAS 460: 2-17. doi:10.1093/mnras/stw910
- Prescott et al. (2016) Prescott M., Mauch T., Jarvis M. J., McAlpine K., Smith D. J. B., Fine S., Johnston R., Hardcastle M. J., et al. (2016) Galaxy And Mass Assembly (GAMA): the 325 MHz radio luminosity function of AGN and star-forming galaxies. MNRAS 457: 730-744. doi:10.1093/mnras/stv3020
- Quataert & Gruzinov (2000) Quataert E., Gruzinov A. (2000) Convection-dominated Accretion Flows. Astrophys J 539: 809-814. doi:10.1086/309267
- Rees, Begelman, Blandford, & Phinney (1982) Rees M. J., Begelman M. C., Blandford R. D., Phinney E. S. (1982) Ion-supported tori and the origin of radio jets. Nature 295: 17-21. doi:10.1038/295017a0
- Remillard & McClintock (2006) Remillard R. A., McClintock J. E. (2006) X-Ray Properties of Black-Hole Binaries. Annu Rev Astron Astr 44: 49-92. doi:10.1146/annurev.astro.44.051905.092532
- Resconi et al. (2017) Resconi E., Coenders S., Padovani P., Giommi P., Caccianiga L. (2017) Connecting blazars with ultrahigh-energy cosmic rays and astrophysical neutrinos. MNRAS 468: 597-606. doi:10.1093/mnras/stx498
- Reyes et al. (2008) Reyes R., Zakamska N. L., Strauss M. A., Green J., Krolik J. H., Shen Y., Richards G. T., Anderson S. F., et al. (2008) Space Density of Optically Selected Type 2 Quasars. Astronom J 136: 2373-2390. doi:10.1088/0004-6256/136/6/2373
- Ricci et al. (2016) Ricci C., Bauer F. E., Treister E., Romero-Cañizales C., Arevalo P., Iwasawa K., Privon G. C., Sanders D. B., et al. (2016) NUSTAR Unveils a Heavily Obscured Low-luminosity Active Galactic Nucleus in the Luminous Infrared Galaxy NGC 6286. Astrophys J 819: 4:10.3847/0004-637X/819/1/4
- Ricci et al. (2017) Ricci F., La Franca F., Onori F., Bianchi S. (2017) Novel calibrations of virial black hole mass estimators in active galaxies based on X-ray luminosity and optical/near-infrared emission lines. Astron Astrophys 598: A51. doi:10.1051/0004-6361/201629380
- Richards et al. (2001) Richards G. T., Fan X., Schneider D. P., Vanden Berk D. E., Strauss M. A., York D. G., Anderson J. E. Jr. et al. (2001) Colors of 2625 Quasars at Measured in the Sloan Digital Sky Survey Photometric System. Astronom J 121:2308-2330. doi:10.1086/320392
- Richards et al. (2002) Richards G. T., Fan X., Newberg H. J., Strauss M. A., Vanden Berk D. E., Schneider D. P., Yanny B., Boucher A., et al. (2002) Spectroscopic Target Selection in the Sloan Digital Sky Survey: The Quasar Sample. Astronom J 123: 2945-2975. doi:10.1086/340187
- Richards et al. (2006a) Richards G. T., Lacy M., Storrie-Lombardi L. J., Hall P. B., Gallagher S. C., Hines D. C., Fan X., Papovich C., et al. (2006a) Spectral Energy Distributions and Multiwavelength Selection of Type 1 Quasars. Astrophys J Suppl 166: 470-497. doi:10.1086/506525
- Richards et al. (2006b) Richards G. T., Strauss M. A., Fan X., Hall P. B., Jester S., Schneider D. P., Vanden Berk D. E., Stoughton C., et al. (2006b) The Sloan Digital Sky Survey Quasar Survey: Quasar Luminosity Function from Data Release 3. Astronom J 131: 2766-2787. doi:10.1086/503559
- Richards et al. (2009b) Richards G. T., Deo R. P., Lacy M., Myers A. D., Nichol R. C., Zakamska N. L., Brunner R. J., Brandt W. N., et al. (2009b) Eight-Dimensional Mid-Infrared/Optical Bayesian Quasar Selection. Astronom J 137: 3884-3899. doi:10.1088/0004-6256/137/4/3884
- Richards et al. (2009a) Richards G. T., Myers A. D., Gray A. G., Riegel R. N., Nichol R. C., Brunner R. J., Szalay A. S., Schneider D. P., et al. (2009a) Efficient Photometric Selection of Quasars from the Sloan Digital Sky Survey. II. 1,000,000 Quasars from Data Release 6. Astrophys J Suppl 180: 67-83. doi:10.1088/0067-0049/180/1/67
- Richards et al. (2011) Richards G. T., Kruczek N. E., Gallagher S. C., Hall P. B., Hewett P. C., Leighly K. M., Deo R. P., Kratzer R. M., et al. (2011) Unification of Luminous Type 1 Quasars through C IV Emission. Astronom J 141: 167. doi:10.1088/0004-6256/141/5/167
- Richards et al. (2015) Richards G. T., Myers A. D., Peters C. M., Krawczyk C. M., Chase G., Ross N. P., Fan X., Jiang L., et al. (2015) Bayesian High-redshift Quasar Classification from Optical and Mid-IR Photometry. Astrophys J Suppl 219: 39. doi:10.1088/0067-0049/219/2/39
- Rieke et al. (2004) Rieke G. H., Young E. T., Engelbracht C. W., et al. (2004) The Multiband Imaging Photometer for Spitzer (MIPS). Astrophys J Suppl 154:25–29. doi:10.1086/422717
- Rigby et al. (2015) Rigby E. E., Argyle J., Best P. N., Rosario D., Röttgering H. J. A. (2015) Cosmic downsizing of powerful radio galaxies to low radio luminosities. Astron Astrophys 581: A96. doi:10.1051/0004-6361/201526475
- Risaliti, Elvis, & Nicastro (2002) Risaliti G., Elvis M., Nicastro F. (2002) Ubiquitous Variability of X-Ray-absorbing Column Densities in Seyfert 2 Galaxies. Astrophys J 571: 234-246. doi:10.1086/324146
- Risaliti et al. (2005) Risaliti G., Elvis M., Fabbiano G., Baldi A., Zezas A. (2005) Rapid Compton-thick/Compton-thin Transitions in the Seyfert 2 Galaxy NGC 1365. Astrophys J Lett 623: L93-L96. doi:10.1086/430252
- Risaliti et al. (2011) Risaliti G., Nardini E., Salvati M., Elvis M., Fabbiano G., Maiolino R., Pietrini P., Torricelli-Ciamponi G., et al. (2011) X-ray absorption by broad-line region clouds in Mrk 766. MNRAS 410: 1027-1035. doi:10.1111/j.1365-2966.2010.17503.x
- Roseboom et al. (2013) Roseboom I. G., Lawrence A., Elvis M., et al. (2013) IR-derived covering factors for a large sample of quasars from WISE-UKIDSS-SDSS. MNRAS 429:1494–1501. doi:10.1093/mnras/sts441
- Ross et al. (2013) Ross N. P., McGreer I. D., White M., Richards G. T., Myers A. D., Palanque-Delabrouille N., Strauss M. A., Anderson S. F., et al. (2013) The SDSS-III Baryon Oscillation Spectroscopic Survey: The Quasar Luminosity Function from Data Release Nine. Astrophys J 773: 14. doi:10.1088/0004-637X/773/1/14
- Ross et al. (2015) Ross N. P., Hamann F., Zakamska N. L., et al. (2015) Extremely red quasars from SDSS, BOSS and WISE: classification of optical spectra. MNRAS 453:3932–3952. doi:10.1093/mnras/stv1710
- Ruan et al. (2016) Ruan J. J., Anderson S. F., Cales S. L., Eracleous M., Green P. J., Morganson E., Runnoe J. C., Shen Y., et al. (2016) Toward an Understanding of Changing-look Quasars: An Archival Spectroscopic Search in SDSS. Astrophys J 826: 188:10.3847/0004-637X/826/2/188
- Runnoe et al. (2013) Runnoe J. C., Brotherton M. S., Shang Z., DiPompeo M. A. (2013) Rehabilitating C IV-based black hole mass estimates in quasars. MNRAS 434: 848-861. doi:10.1093/mnras/stt1077
- Sadler et al. (2007) Sadler E. M., Cannon R. D., Mauch T., Hancock P. J., Wake D. A., Ross N., Croom S. M., Drinkwater M. J., et al. (2007) Radio galaxies in the 2SLAQ Luminous Red Galaxy Survey - I. The evolution of low-power radio galaxies to . MNRAS 381: 211-227. doi:10.1111/j.1365-2966.2007.12231.x
- Sadler (2016) Sadler E. M. (2016) GPS/CSS radio sources and their relation to other AGN. Astronomische Nachrichten 337: 105. doi:10.1002/asna.201512274
- Salvato et al. (2009) Salvato M., Hasinger G., Ilbert O., Zamorani G., Brusa M., Scoville N. Z., Rau A., Capak P., et al. (2009) Photometric Redshift and Classification for the XMM-COSMOS Sources. Astrophys J 690: 1250-1263. doi:10.1088/0004-637X/690/2/1250
- Sánchez et al. (2016) Sánchez P., Lira P., & Cartier R. (2016) Characterization of the AGN variability in the optical and Near Infrared regimes. Zenodo. http://doi.org/10.5281/zenodo.60353
- Sanders et al. (1988) Sanders D. B., Soifer B. T., Elias J. H., et al. (1988) Ultraluminous infrared galaxies and the origin of quasars. Astrophys J 325:74–91. doi:10.1086/165983
- Sarzi et al. (2010) Sarzi M., Shields J. C., Schawinski K., Jeong H., Shapiro K., Bacon R., Bureau M., Cappellari M., et al. (2010) The SAURON project - XVI. On the sources of ionization for the gas in elliptical and lenticular galaxies. MNRAS 402: 2187-2210. doi:10.1111/j.1365-2966.2009.16039.x
- Satyapal et al. (2014) Satyapal S., Secrest N. J., McAlpine W., et al. (2014) Discovery of a Population of Bulgeless Galaxies with Extremely Red Mid-IR Colors: Obscured AGN Activity in the Low-mass Regime? Astrophys J 784:113. doi:10.1088/0004-637X/784/2/113
- Satyapal et al. (2016) Satyapal S., Secrest N. J., Rothberg B., et al. (2016) Obscured AGNs in Bulgeless Hosts discovered by WISE: The Case Study of SDSS J1224+5555. Astrophys J 827:58. doi:10.3847/0004-637X/827/1/58
- Scaringi et al. (2015) Scaringi S., Maccarone T. J., Kording E., Knigge C., Vaughan S., Marsh T. R., Aranzana E., Dhillon V. S., et al. (2015) Accretion-induced variability links young stellar objects, white dwarfs, and black holes. Science Advances 1: e1500686-e1500686. doi:10.1126/sciadv.1500686
- Schawinski et al. (2015) Schawinski, K., Koss, M., Berney, S., Sartori, L. F. (2015) Active galactic nuclei flicker: an observational estimate of the duration of black hole growth phases of 105 yr. MNRAS 451:2517-2523. doi:10.1093/mnras/stv1136
- Schaye et al. (2015) Schaye J., Crain R. A., Bower R. G., et al. (2015) The EAGLE project: simulating the evolution and assembly of galaxies and their environments. MNRAS 446:521–554. doi:10.1093/mnras/stu2058
- Schmidt (1963) Schmidt M. (1963) 3C 273: A Star-Like Object with Large Red-Shift. Nature 197: 1040. doi:10.1038/1971040a0
- Schmidt (1970) Schmidt M. (1970) Space Distribution and Luminosity Functions of Quasars. Astrophys J 162: 371. doi:10.1086/150668
- Schneider et al. (2010) Schneider D. P., Richards G. T., Hall P. B., Strauss M. A., Anderson S. F., Boroson T. A., Ross N. P., Shen Y., et al. (2010) The Sloan Digital Sky Survey Quasar Catalog. V. Seventh Data Release. Astronom J 139: 2360. doi:10.1088/0004-6256/139/6/2360
- Schulze et al. (2015) Schulze A., Bongiorno A., Gavignaud I., Schramm M., Silverman J., Merloni A., Zamorani G., Hirschmann M., et al. (2015) The cosmic growth of the active black hole population at in zCOSMOS, VVDS and SDSS. MNRAS 447: 2085-2111. doi:10.1093/mnras/stu2549
- Schweitzer et al. (2008) Schweitzer M., Groves B., Netzer H., et al. (2008) Extended Silicate Dust Emission in Palomar-Green QSOs. Astrophys J 679:101-117. doi:10.1086/587097
- Sergeev et al. (2005) Sergeev S. G., Doroshenko V. T., Golubinskiy Y. V., Merkulova N. I., Sergeeva E. A. (2005) Lag-Luminosity Relationship for Interband Lags between Variations in B, V, R, and I Bands in Active Galactic Nuclei. Astrophys J 622: 129-135. doi:10.1086/427820
- Seyfert (1943) Seyfert C. K. (1943) Nuclear Emission in Spiral Nebulae. Astrophys J 97: 28. doi:10.1086/144488
- Shakura & Sunyaev (1973) Shakura N. I., Sunyaev R. A. (1973) Black holes in binary systems. Observational appearance. Astron Astrophys 24: 337-355.
- Shanks et al. (2015) Shanks T., Metcalfe N., Chehade B., Findlay J. R., Irwin M. J., Gonzalez-Solares E., Lewis J. R., Yoldas A. K., et al. (2015) The VLT Survey Telescope ATLAS. MNRAS 451: 4238-4252. doi:10.1093/mnras/stv1130
- Sharma et al. (2015) Sharma M., Nayak J., Koul M., K. et al. (2015) Validation of a new background discrimination method for the TACTIC TeV gamma-ray telescope with Markarian 421 data Nuclear Inst. and Methods in Physics Research, A, 770: 42. doi:10.1016/j.nima.2014.10.012
- Shen & Ho (2014) Shen Y., Ho L. C. (2014) The diversity of quasars unified by accretion and orientation. Nature 513: 210-213. doi:10.1038/nature13712
- Shen & Kelly (2012) Shen Y., Kelly B. C. (2012) The Demographics of Broad-line Quasars in the Mass-Luminosity Plane. I. Testing FWHM-based Virial Black Hole Masses. Astrophys J 746: 169. doi:10.1088/0004-637X/746/2/169
- Shen (2013) Shen Y. (2013) The mass of quasars. Bulletin of the Astronomical Society of India 41: 61-115.
- Shi et al. (2006) Shi Y., Rieke G. H., Hines D. C., Gorjian V., Werner M. W., Cleary K., Low F. J., Smith P. S., et al. (2006) 9.7 m Silicate Features in Active Galactic Nuclei: New Insights into Unification Models. Astrophys J 653: 127-136. doi:10.1086/508737
- Siebenmorgen et al. (2005) Siebenmorgen R., Haas M., Krügel E., Schulz B. (2005) Discovery of 10 m silicate emission in quasars. Evidence of the AGN unification scheme. Astron Astrophys 436: L5-L8. doi:10.1051/0004-6361:200500109
- Simm et al. (2016) Simm T., Salvato M., Saglia R., Ponti G., Lanzuisi G., Trakhtenbrot B., Nandra K., Bender R., et al. (2016) Pan-STARRS1 variability of XMM-COSMOS AGN. II. Physical correlations and power spectrum analysis. Astron Astrophys 585: A129. doi:10.1051/0004-6361/201527353
- Simmons et al. (2011) Simmons B. D., Van Duyne J., Urry C. M., et al. (2011) Obscured GOODS Active Galactic Nuclei and Their Host Galaxies at : The Slow Black Hole Growth Phase. Astrophys J 734:121. doi:10.1088/0004-637X/734/2/121
- Simpson (2005) Simpson C. (2005) The luminosity dependence of the type 1 active galactic nucleus fraction. MNRAS 360:565–572. doi:10.1111/j.1365-2966.2005.09043.x
- Slone & Netzer (2012) Slone O., Netzer H. (2012) The effects of disc winds on the spectrum and black hole growth rate of active galactic nuclei. MNRAS 426: 656-664. doi:10.1111/j.1365-2966.2012.21699.x
- Smith et al. (2015) Smith, K. L., Boyd P. T., Mushotzky R. F., Gehrels N., Edelson R., Howell S. B., Gelino D. M., Brown, A., Young S. (2015) KSwAGS: A Swift X-Ray and UV Survey of the Kepler Field. I. Astronom J 150, 126. doi: 10.1088/0004-6256/150/4/126
- Smolčić et al. (2006) Smolčić V., Ivezić Ž., Gaćeša M., Rakos K., Pavlovski K., Ilijić S., Obrić M., Lupton R. H., et al. (2006) The rest-frame optical colours of 99000 Sloan Digital Sky Survey galaxies. MNRAS 371: 121-137. doi:10.1111/j.1365-2966.2006.10662.x
- Smolčić et al. (2008) Smolčić V., Schinnerer E., Scodeggio M., Franzetti P., Aussel H., Bondi M., Brusa M., Carilli C. L., et al. (2008) A New Method to Separate Star-forming from AGN Galaxies at Intermediate Redshift: The Submillijansky Radio Population in the VLA-COSMOS Survey. Astrophys J Suppl 177: 14-38. doi:10.1086/588028
- Smolčić (2009) Smolčić V. (2009) The Radio AGN Population Dichotomy: Green Valley Seyferts Versus Red Sequence Low-Excitation Active Galactic Nuclei. Astrophys J Lett 699: L43-L47. doi:10.1088/0004-637X/699/1/L43
- Smolčić et al. (2009) Smolčić V., Zamorani G., Schinnerer E., Bardelli S., Bondi M., Bîrzan L., Carilli C. L., Ciliegi P., et al. (2009) Cosmic Evolution of Radio Selected Active Galactic Nuclei in the Cosmos Field. Astrophys J 696: 24-39. doi:10.1088/0004-637X/696/1/24
- Smolčić (2016) Smolčić V. (2016) Radio continuum surveys and galaxy evolution: The AGN view. arXiv:1603.05687
- Smolčić et al. (2017a) Smolčić V., Delvecchio I., Zamorani G., Baran N., Novak M., Delhaize J., Schinnerer E., Berta S., et al. (2017a) The VLA-COSMOS 3 GHz Large Project: Multiwavelength counterparts and the composition of the faint radio population. Astron Astrophys 602: A2. doi:10.1051/0004-6361/201630223
- Smolčić et al. (2017b) Smolčić V., Novak M., Delvecchio I., Ceraj L., Bondi M., Delhaize J., Marchesi S., Murphy E., et al. (2017b) The VLA-COSMOS 3 GHz Large Project: Cosmic evolution of radio AGN and implications for radio-mode feedback since z 5. Astron Astrophys 602: A6. doi:10.1051/0004-6361/201730685
- Sobolewska, Siemiginowska, & Życki (2004) Sobolewska M. A., Siemiginowska A., Życki P. T. (2004) High-Redshift Radio-quiet Quasars: Exploring the Parameter Space of Accretion Models. II. Patchy Corona Model. Astrophys J 617: 102-112. doi:10.1086/425262
- Soldi et al. (2014) Soldi S., Beckmann V., Baumgartner W. H., Ponti G., Shrader C. R., Lubiński P., Krimm H. A., Mattana F., et al. (2014) Long-term variability of AGN at hard X-rays. Astron Astrophys 563: A57. doi:10.1051/0004-6361/201322653
- Soffitta et al. (2016) Soffitta P., Bellazzini R., Bozzo E., Burwitz V., Castro-Tirado A., Costa E., Courvoisier T., Feng H., et al. (2016) XIPE: the x-ray imaging polarimetry explorer. Proc. of the SPIE 9905: 990515:10.1117/12.2233046
- Spergel et al. (2015) Spergel D., Gehrels N., Baltay C., et al. (2015) Wide-Field InfrarRed Survey Telescope-Astrophysics Focused Telescope Assets WFIRST-AFTA 2015 Report. ArXiv e-prints
- Spoon et al. (2007) Spoon H. W. W., Marshall J. A., Houck J. R., et al. (2007) Mid-Infrared Galaxy Classification Based on Silicate Obscuration and PAH Equivalent Width. Astrophys J Lett 654:L49–L52. doi:10.1086/511268
- Stanek et al. (2006) Stanek R., Evrard A. E., Böhringer H., Schuecker P., Nord B. (2006) The X-Ray Luminosity-Mass Relation for Local Clusters of Galaxies. Astrophys J 648: 956-968. doi:10.1086/506248
- Steffen et al. (2006) Steffen A. T., Strateva I., Brandt W. N., Alexander D. M., Koekemoer A. M., Lehmer B. D., Schneider D. P., Vignali C., et al. (2006) The X-Ray-to-Optical Properties of Optically Selected Active Galaxies over Wide Luminosity and Redshift Ranges. Astronom J 131: 2826-2842. doi:10.1086/503627
- Stern et al. (2005) Stern D., Eisenhardt P., Gorjian V., Kochanek C. S., Caldwell N., Eisenstein D., Brodwin M., Brown M. J. I., et al. (2005) Mid-Infrared Selection of Active Galaxies. Astrophys J 631: 163-168. doi:10.1086/432523
- Stern et al. (2007) Stern D., Kirkpatrick J. D., Allen L. E., et al. (2007) Mid-Infrared Selection of Brown Dwarfs and High-Redshift Quasars. Astrophys J 663:677–685. doi:10.1086/516833
- Stern et al. (2012) Stern D., Assef R. J., Benford D. J., et al. (2012) Mid-infrared Selection of Active Galactic Nuclei with the Wide-Field Infrared Survey Explorer. I. Characterizing WISE-selected Active Galactic Nuclei in COSMOS. Astrophys J 753:30. doi:10.1088/0004-637X/753/1/30
- Strateva et al. (2001) Strateva I., Ivezić Ž., Knapp G. R., Narayanan V. K., Strauss M. A., Gunn J. E., Lupton R. H., Schlegel D., et al. (2001) Color Separation of Galaxy Types in the Sloan Digital Sky Survey Imaging Data. Astronom J 122: 1861-1874. doi:10.1086/323301
- Sturm et al. (2005) Sturm E., Schweitzer M., Lutz D., Contursi A., Genzel R., Lehnert M. D., Tacconi L. J., Veilleux S., et al. (2005) Silicate Emissions in Active Galaxies: From LINERs to QSOs. Astrophys J Lett 629: L21-L23. doi:10.1086/444359
- Sulentic, Marziani, & Dultzin-Hacyan (2000) Sulentic J. W., Marziani P., Dultzin-Hacyan D. (2000) Phenomenology of Broad Emission Lines in Active Galactic Nuclei. Annu Rev Astron Astr 38: 521-571. doi:10.1146/annurev.astro.38.1.521
- Sulentic et al. (2002) Sulentic J. W., Marziani P., Zamanov R., Bachev R., Calvani M., Dultzin-Hacyan D. (2002) Average Quasar Spectra in the Context of Eigenvector 1. Astrophys J Lett 566: L71-L75. doi:10.1086/339594
- Sulentic et al. (2007) Sulentic J. W., Bachev R., Marziani P., Negrete C. A., Dultzin D. (2007) C IV 1549 as an Eigenvector 1 Parameter for Active Galactic Nuclei. Astrophys J 666: 757-777. doi:10.1086/519916
- Sun & Malkan (1989) Sun W. -H., Malkan M. A. (1989) Fitting improved accretion disk models to the multiwavelength continua of quasars and active galactic nuclei. Astrophys J 346: 68-100. doi:10.1086/167986
- Stalevski et al. (2012) Stalevski M., Fritz J., Baes M., Nakos T., Popović L. Č. (2012) 3D radiative transfer modelling of the dusty tori around active galactic nuclei as a clumpy two-phase medium. MNRAS 420:2756–2772. doi:10.1111/j.1365-2966.2011.19775.x
- Stalevski et al. (2016) Stalevski M., Ricci C., Ueda Y., Lira P., Fritz J., Baes M. (2016) The dust covering factor in active galactic nuclei. MNRAS 458: 2288–2302. doi:10.1093/mnras/stw444
- Szokoly et al. (2004) Szokoly G. P., Bergeron J., Hasinger G., Lehmann I., Kewley L., Mainieri V., Nonino M., Rosati P., et al. (2004) The Chandra Deep Field-South: Optical Spectroscopy. I. Astrophys J Suppl 155: 271-349. doi:10.1086/424707
- Tadhunter et al. (1998) Tadhunter C. N., Morganti R., Robinson A., Dickson R., Villar-Martin M., Fosbury R. A. E. (1998) The nature of the optical-radio correlations for powerful radio galaxies. MNRAS 298: 1035-1047. doi:10.1046/j.1365-8711.1998.01706.x
- Tadhunter (2016) Tadhunter C. (2016) Radio AGN in the local universe: unification, triggering and evolution. Astron Astrophys Rev 24: 10. doi:10.1007/s00159-016-0094-x
- Tavani et al. (2009) Tavani M., et al. (2009) The AGILE mission. Astron Astrophys 502: 995-1013. doi:10.1051/0004-6361/200810527
- Tchekhovskoy et al. (2011) Tchekhovskoy A, Narayan R, McKinney JC (2011) Efficient generation of jets from magnetically arrested accretion on a rapidly spinning black hole. MNRAS 418:L79–L83. doi:10.1111/j.1745-3933.2011.01147.x
- Tchekhovskoy (2015) Tchekhovskoy A. (2015) Launching of Active Galactic Nuclei Jets. In: Contopoulos I., Gabuzda D., Kylafis N. (eds) The Formation and Disruption of Black Hole Jets, Astrophysics and Space Science Library, vol 414, p 45. doi:10.1007/978-3-319-10356-3_3
- Terrell (1967) Terrell J. (1967) Luminosity Fluctuations and a Local Model of Quasi-Stellar Objects. Astrophys J 147: 827. doi:10.1086/149065
- Thompson et al. (1993) Thompson D. J., Bertsch D. L., Fichtel C. E. et al. (1993) Calibration of the Energetic Gamma-Ray Experiment Telescope (EGRET) for the Compton Gamma-Ray Observatory. Astrophys J Suppl , 86: 629. doi:10.1086/191793
- Trakhtenbrot & Netzer (2012) Trakhtenbrot B., Netzer H. (2012) Black hole growth to z = 2 - I. Improved virial methods for measuring MBH and L/LEdd. MNRAS 427: 3081-3102. doi:10.1111/j.1365-2966.2012.22056.x
- Treister et al. (2004) Treister E., Urry C. M., Chatzichristou E., et al. (2004) Obscured Active Galactic Nuclei and the X-Ray, Optical, and Far-Infrared Number Counts of Active Galactic Nuclei in the GOODS Fields. Astrophys J 616:123–135. doi:10.1086/424891
- Tremaine et al. (2002) Tremaine S., Gebhardt K., Bender R., Bower G., Dressler A., Faber S. M., Filippenko A. V., Green R., et al. (2002) The Slope of the Black Hole Mass versus Velocity Dispersion Correlation. Astrophys J 574: 740-753. doi:10.1086/341002
- Treves, Maraschi, & Abramowicz (1988) Treves A., Maraschi L., Abramowicz M. (1988) Basic elements of the theory of accretion. Publications Astron Soc Pacific 100: 427-451. doi:10.1086/132189
- Tristram et al. (2007) Tristram K. R. W., Meisenheimer K., Jaffe W., et al. (2007) Resolving the complex structure of the dust torus in the active nucleus of the Circinus galaxy. Astron Astrophys 474:837–850. doi:10.1051/0004-6361:20078369
- Tsai et al. (2015) Tsai C. W., Eisenhardt P. R. M., Wu J., et al. (2015) The Most Luminous Galaxies Discovered by WISE. Astrophys J 805:90. doi:10.1088/0004-637X/805/2/90
- Ueda et al. (2003) Ueda Y., Akiyama M., Ohta K., Miyaji T. (2003) Cosmological Evolution of the Hard X-Ray Active Galactic Nucleus Luminosity Function and the Origin of the Hard X-Ray Background. Astrophys J 598:886–908. doi:10.1086/378940
- Ueda et al. (2014) Ueda Y., Akiyama M., Hasinger G., Miyaji T., Watson M. G. (2014) Toward the Standard Population Synthesis Model of the X-Ray Background: Evolution of X-Ray Luminosity and Absorption Functions of Active Galactic Nuclei Including Compton-thick Populations. Astrophys J 786: 104:10.1088/0004-637X/786/2/104
- Ulrich, Maraschi, & Urry (1997) Ulrich M.-H., Maraschi L., Urry C. M. (1997) Variability of Active Galactic Nuclei. Annu Rev Astron Astr 35: 445-502. doi:10.1146/annurev.astro.35.1.445
- Urry & Padovani (1995) Urry C. M., Padovani P. (1995) Unified Schemes for Radio-Loud Active Galactic Nuclei. Publications Astron Soc Pacific 107: 803-845. doi:10.1086/133630
- Uttley & McHardy (2001) Uttley P., McHardy I. M. (2001) The flux-dependent amplitude of broadband noise variability in X-ray binaries and active galaxies. MNRAS 323: L26-L30. doi:10.1046/j.1365-8711.2001.04496.x
- Uttley, McHardy, & Papadakis (2002) Uttley P., McHardy I. M., Papadakis I. E. (2002) Measuring the broad-band power spectra of active galactic nuclei with RXTE. MNRAS 332: 231-250. doi:10.1046/j.1365-8711.2002.05298.x
- Uttley et al. (2003) Uttley P., Edelson R., McHardy I. M., Peterson B. M., Markowitz A. (2003) Correlated Long-Term Optical and X-Ray Variations in NGC 5548. Astrophys J Lett 584: L53-L56. doi:10.1086/373887
- Uttley, McHardy, & Vaughan (2005) Uttley P., McHardy I. M., Vaughan S. (2005) Non-linear X-ray variability in X-ray binaries and active galaxies. MNRAS 359: 345-362. doi:10.1111/j.1365-2966.2005.08886.x
- Uttley et al. (2011) Uttley P., Wilkinson T., Cassatella P., Wilms J., Pottschmidt K., Hanke M., Böck M. (2011) The causal connection between disc and power-law variability in hard state black hole X-ray binaries. MNRAS 414: L60-L64. doi:10.1111/j.1745-3933.2011.01056.x
- Vanden Berk et al. (2004) Vanden Berk D. E., Wilhite B. C., Kron R. G., Anderson S. F., Brunner R. J., Hall P. B., Ivezić Ž., Richards G. T., et al. (2004) The Ensemble Photometric Variability of 25,000 Quasars in the Sloan Digital Sky Survey. Astrophys J 601: 692-714. doi:10.1086/380563
- Vasudevan & Fabian (2009) Vasudevan RV, Fabian AC (2009) Simultaneous X-ray/optical/UV snapshots of active galactic nuclei from XMM-Newton: spectral energy distributions for the reverberation mapped sample. MNRAS 392:1124–1140. doi:10.1111/j.1365-2966.2008.14108.x
- Vaughan et al. (2003) Vaughan S., Edelson R., Warwick R. S., Uttley P. (2003) On characterizing the variability properties of X-ray light curves from active galaxies. MNRAS 345: 1271-1284. doi:10.1046/j.1365-2966.2003.07042.x
- Vazquez et al. (2015) Vazquez B., Galianni P., Richmond M., Robinson A., Axon D. J., Horne K., Almeyda T., Fausnaugh M., et al. (2015) Spitzer Space Telescope Measurements of Dust Reverberation Lags in the Seyfert 1 Galaxy NGC 6418. Astrophys J 801: 127. doi:10.1088/0004-637X/801/2/127
- Veilleux & Osterbrock (1987) Veilleux S., Osterbrock D. E. (1987) Spectral classification of emission-line galaxies. Astrophys J Suppl 63: 295-310. doi:10.1086/191166
- Veilleux et al. (2009) Veilleux S., Rupke D. S. N., Kim D. C., et al. (2009) Spitzer Quasar and Ulirg Evolution Study (QUEST). IV. Comparison of 1 Jy Ultraluminous Infrared Galaxies with Palomar-Green Quasars. Astrophys J Suppl 182:628-666. doi:10.1088/0067-0049/182/2/628
- Vestergaard & Peterson (2006) Vestergaard M., Peterson B. M. (2006) Determining Central Black Hole Masses in Distant Active Galaxies and Quasars. II. Improved Optical and UV Scaling Relationships. Astrophys J 641: 689-709. doi:10.1086/500572
- Vestergaard et al. (2008) Vestergaard M., Fan X., Tremonti C. A., Osmer P. S., Richards G. T. (2008) Mass Functions of the Active Black Holes in Distant Quasars from the Sloan Digital Sky Survey Data Release 3. Astrophys J Lett 674: L1. doi:10.1086/528981
- Voges et al. (1999) Voges W., Aschenbach B., Boller T., Bräuninger H., Briel U., Burkert W., Dennerl K., Englhauser J., et al. (1999) The ROSAT all-sky survey bright source catalogue. Astron Astrophys 349: 389-405
- Wada, Schartmann, & Meijerink (2016) Wada K., Schartmann M., Meijerink R. (2016) Multi-phase Nature of a Radiation-driven Fountain with Nuclear Starburst in a Low-mass Active Galactic Nucleus. Astrophys J Lett 828:L19. doi:10.3847/2041-8205/828/2/L19
- Waddington, Dunlop, Peacock, & Windhorst (2001) Waddington I., Dunlop J. S., Peacock J. A., Windhorst R. A. (2001) The LBDS Hercules sample of mJy radio sources at 1.4 GHz - II. Redshift distribution, radio luminosity function, and the high-redshift cut-off. MNRAS 328: 882-896. doi:10.1046/j.1365-8711.2001.04934.x
- Wall (1975) Wall J. V. (1975) The quasars from the Parkes 2700-MHz survey. The Observatory 95: 196-204
- Wang & Jiang (2006) Wang J. X., Jiang P. (2006) On the Fraction of X-Ray-obscured Quasars in the Local Universe. Astrophys J Lett 646:L103–L106. doi:10.1086/507100
- Wang et al. (2013) Wang S. X., Brandt W. N., Luo B., Smail I., Alexander D. M., Danielson A. L. R., Hodge J. A., Karim A., et al. (2013) An ALMA Survey of Submillimeter Galaxies in the Extended Chandra Deep Field-South: The AGN Fraction and X-Ray Properties of Submillimeter Galaxies. Astrophys J 778: 179:10.1088/0004-637X/778/2/179
- Warren et al. (2000) Warren S. J., Hewett P. C., Foltz C. B. (2000) The KX method for producing K-band flux-limited samples of quasars. MNRAS 312:827–832. doi:10.1046/j.1365-8711.2000.03206.x
- Waters & Proga (2016) Waters T., Proga D. (2016) On the efficient acceleration of clouds in active galactic nuclei. MNRAS 460:L79–L83. doi:10.1093/mnrasl/slw056
- Weinberger et al. (2017) Weinberger R., Springel V., Hernquist L., et al. (2017) Simulating galaxy formation with black hole driven thermal and kinetic feedback. MNRAS 465:3291–3308. doi:10.1093/mnras/stw2944
- Weisskopf et al. (2002) Weisskopf M. C., Brinkman B., Canizares C., Garmire G., Murray S., Van Speybroeck L. P. (2002) An Overview of the Performance and Scientific Results from the Chandra X-Ray Observatory. Publications Astron Soc Pacific 114: 1-24. doi:10.1086/338108
- Werner et al. (2004) Werner M. W., Roellig T. L., Low F. J., et al. (2004) The Spitzer Space Telescope Mission. Astrophys J Suppl 154:1–9. doi:10.1086/422992
- Weymann, Carswell, & Smith (1981) Weymann R. J., Carswell R. F., Smith M. G. (1981) Absorption lines in the spectra of quasistellar objects. Annu Rev Astron Astr 19: 41-76. doi:10.1146/annurev.aa.19.090181.000353
- Weymann, Morris, Foltz, & Hewett (1991) Weymann R. J., Morris S. L., Foltz C. B., Hewett P. C. (1991) Comparisons of the emission-line and continuum properties of broad absorption line and normal quasi-stellar objects. Astrophys J 373: 23-53. doi:10.1086/170020
- Whysong & Antonucci (2004) Whysong D., Antonucci R. (2004) Thermal Emission as a Test for Hidden Nuclei in Nearby Radio Galaxies. Astrophys J 602:116–122. doi:10.1086/380828
- White, Jarvis, Häußler, & Maddox (2015) White S. V., Jarvis M. J., Häußler B., Maddox N. (2015) Radio-quiet quasars in the VIDEO survey: evidence for AGN-powered radio emission at mJy. MNRAS 448: 2665-2686. doi:10.1093/mnras/stv134
- Willott et al. (2001) Willott C. J., Rawlings S., Blundell K. M., Lacy M., Eales S. A. (2001) The radio luminosity function from the low-frequency 3CRR, 6CE and 7CRS complete samples. MNRAS 322: 536-552. doi:10.1046/j.1365-8711.2001.04101.x
- Wilman et al. (2008) Wilman R. J., Miller L., Jarvis M. J., Mauch T., Levrier F., Abdalla F. B., Rawlings S., Klöckner H.-R., et al. (2008) A semi-empirical simulation of the extragalactic radio continuum sky for next generation radio telescopes. MNRAS 388: 1335-1348. doi:10.1111/j.1365-2966.2008.13486.x
- Wilms, Allen, & McCray (2000) Wilms J., Allen A., McCray R. (2000) On the Absorption of X-Rays in the Interstellar Medium. Astrophys J 542: 914-924. doi:10.1086/317016
- Wolf et al. (2003) Wolf C., Wisotzki L., Borch A., Dye S., Kleinheinrich M., Meisenheimer K. (2003) The evolution of faint AGN between z = 1 and z = 5 from the COMBO-17 survey. Astron Astrophys 408:499-514. doi:10.1051/0004-6361:20030990
- Woo & Urry (2002) Woo J.-K., Urry C.M., (2002) Active Galactic Nucleus Black Hole Masses and Bolometric Luminosities Astrophys J 579: 530-544. doi:10.1086/342878
- Worseck & Prochaska (2011) Worseck G., Prochaska J. X. (2011) GALEX Far-ultraviolet Color Selection of UV-bright High-redshift Quasars. Astrophys J 728: 23. doi:10.1088/0004-637X/728/1/23
- Wright et al. (2010) Wright E. L., Eisenhardt P. R. M., Mainzer A. K., et al. (2010) The Wide-field Infrared Survey Explorer (WISE): Mission Description and Initial On-orbit Performance. Astronom J 140:1868-1881. doi:10.1088/0004-6256/140/6/1868
- Wu et al. (2011) Wu J., Brandt W. N., Hall P. B., Gibson R. R., Richards G. T., Schneider D. P., Shemmer O., Just D. W., et al. (2011) A Population of X-Ray Weak Quasars: PHL 1811 Analogs at High Redshift. Astrophys J 736: 28:10.1088/0004-637X/736/1/28
- Wu et al. (2012a) Wu J., Tsai C. W., Sayers J., et al. (2012a) Submillimeter Follow-up of WISE-selected Hyperluminous Galaxies. Astrophys J 756:96. doi:10.1088/0004-637X/756/1/96
- Wu et al. (2012b) Wu X. B., Hao G., Jia Z., Zhang Y., Peng N. (2012b) SDSS Quasars in the WISE Preliminary Data Release and Quasar Candidate Selection with Optical/Infrared Colors. Astronom J 144:49. doi:10.1088/0004-6256/144/2/49
- Xue et al. (2010) Xue Y. Q., Brandt W. N., Luo B., Rafferty D. A., Alexander D. M., Bauer F. E., Lehmer B. D., Schneider D. P., et al. (2010) Color-Magnitude Relations of Active and Non-active Galaxies in the Chandra Deep Fields: High-redshift Constraints and Stellar-mass Selection Effects. Astrophys J 720: 368-391. doi:10.1088/0004-637X/720/1/368
- Xue et al. (2011) Xue Y. Q., Luo B., Brandt W. N., Bauer F. E., Lehmer B. D., Broos P. S., Schneider D. P., Alexander D. M., et al. (2011) The Chandra Deep Field-South Survey: 4 Ms Source Catalogs. Astrophys J Suppl 195: 10. doi:10.1088/0067-0049/195/1/10
- Yang et al. (2016) Yang G., Brandt W. N., Luo B., Xue Y. Q., Bauer F. E., Sun M. Y., Kim S., Schulze S., et al. (2016) Long-term X-Ray Variability of Typical Active Galactic Nuclei in the Distant Universe. Astrophys J 831: 145. doi:10.3847/0004-637X/831/2/145
- Yip et al. (2004) Yip C. W., Connolly A. J., Vanden Berk D. E., Ma Z., Frieman J. A., SubbaRao M., Szalay A. S., Richards G. T., et al. (2004) Spectral Classification of Quasars in the Sloan Digital Sky Survey: Eigenspectra, Redshift, and Luminosity Effects. Astronom J 128: 2603-2630. doi:10.1086/425626
- York et al. (2000) York D. G., Adelman J., Anderson J. E., Jr., Anderson S. F., Annis J., Bahcall N. A., Bakken J. A., Barkhouser R., et al. (2000) The Sloan Digital Sky Survey: Technical Summary. Astronom J 120: 1579-1587. doi:10.1086/301513
- Young et al. (2012) Young M., Brandt W. N., Xue Y. Q., Paolillo M., Alexander D. M., Bauer F. E., Lehmer B. D., Luo B., et al. (2012) Variability-selected Low-luminosity Active Galactic Nuclei in the 4 Ms Chandra Deep Field-South. Astrophys J 748: 124. doi:10.1088/0004-637X/748/2/124
- Yuan & Narayan (2014) Yuan F., Narayan R. (2014) Hot Accretion Flows Around Black Holes. Annu Rev Astron Astr 52: 529-588. doi:10.1146/annurev-astro-082812-141003
- Yuan, Strauss, & Zakamska (2016) Yuan S., Strauss M. A., Zakamska N. L. (2016) Spectroscopic identification of type 2 quasars at in SDSS-III/BOSS. MNRAS 462: 1603-1615. doi:10.1093/mnras/stw1747
- Yun et al. (2008) Yun M. S., Aretxaga I., Ashby M. L. N., et al. (2008) Spitzer IRAC infrared colours of submillimetre-bright galaxies. MNRAS 389:333–340. doi:10.1111/j.1365-2966.2008.13565.x
- Zakamska et al. (2003) Zakamska N. L., Strauss M. A., Krolik J. H., Collinge M. J., Hall P. B., Hao L., Heckman T. M., Ivezić Ž., et al. (2003) Candidate Type II Quasars from the Sloan Digital Sky Survey. I. Selection and Optical Properties of a Sample at . Astronom J 126: 2125-2144. doi:10.1086/378610
- Zakamska et al. (2016) Zakamska N. L., Lampayan K., Petric A., Dicken D., Greene J. E., Heckman T. M., Hickox R. C., Ho L. C., et al. (2016) Star formation in quasar hosts and the origin of radio emission in radio-quiet quasars. MNRAS 455: 4191-4211. doi:10.1093/mnras/stv2571
- Zhou et al. (2010) Zhou X.-L., Zhang S.-N., Wang D.-X., Zhu L. (2010) Calibrating the Correlation Between Black Hole Mass and X-ray Variability Amplitude: X-ray Only Black Hole Mass Estimates for Active Galactic Nuclei and Ultra-luminous X-ray Sources. Astrophys J 710: 16-23. doi:10.1088/0004-637X/710/1/16
- Zoghbi et al. (2012) Zoghbi A., Fabian A. C., Reynolds C. S., Cackett E. M. (2012) Relativistic iron K X-ray reverberation in NGC 4151. MNRAS 422: 129-134. doi:10.1111/j.1365-2966.2012.20587.x
- Zuo et al. (2012) Zuo W., Wu X.-B., Liu Y.-Q., Jiao C.-L. (2012) The Correlations between Optical Variability and Physical Parameters of Quasars in SDSS Stripe 82. Astrophys J 758: 104. doi:10.1088/0004-637X/758/2/104