Witnessing galaxy assembly in an extended structure
Abstract
We present new observations acquired with the Multi Unit Spectroscopic Explorer instrument on the Very Large Telescope in a quasar field that hosts a high column-density damped Ly absorber (DLA) at . We detect Ly emission from a nebula at the redshift of the DLA with line luminosity , which extends over above a surface brightness limit of at a projected distance of from the quasar sightline. Two clumps lie inside this nebula, both with Ly rest-frame equivalent width and with relative line-of-sight velocities aligned with two main absorption components seen in the DLA spectrum. In addition, we identify a compact galaxy at a projected distance of from the quasar sightline. The galaxy spectrum is noisy but consistent with that of a star-forming galaxy at the DLA redshift. We argue that the Ly nebula is ionized by radiation from star formation inside the two clumps, or by radiation from the compact galaxy. In either case, these data imply the presence of a structure with size kpc inside which galaxies are assembling, a picture consistent with galaxy formation in groups and filaments as predicted by cosmological simulations such as the eagle simulations.
keywords:
galaxies: evolution – galaxies: formation – galaxies: haloes – galaxies: high-redshift – quasars: absorption lines – quasars: individual: J025518.58 + 004847.61 Introduction
In the current cosmological paradigm, galaxies form in overdense regions of the Universe when gas is funnelled from the intergalactic medium inside dark matter halos, where it settles into disks and cools to form stars (White & Rees, 1978; Blumenthal et al., 1984). A distinctive feature of this model is the clustering of galaxies on scales ranging from individual halos of tens of kiloparsecs, up to structures on scales of few megaparsecs. This picture is supported by hydrodynamic simulations, as well as by the statistics recovered from observations of the starlight emitted by young galaxies that populated the Universe more than ten billion years ago.
Direct observations of the link between hydrogen and star formation within and around galaxies provide key insight into the astrophysical processes that regulate galaxy evolution in this hierarchy of groups and filaments (e.g. Warren & Møller, 1996; Weatherley et al., 2005; Cucciati et al., 2014; Fumagalli et al., 2016a; Bielby et al., 2016; Péroux et al., 2017; Cai et al., 2017). However, due to the difficulty in mapping neutral hydrogen in emission at high redshift, until recently it has proven challenging to study in detail the connection between gas and galaxies inside overdensities beyond .
Most of our knowledge of the neutral gas content of the high-redshift Universe originates from the study of damped Ly absorbers (DLAs), which are detected in absorption against bright background sources (Wolfe et al., 2005). Defined as systems with H i column density , DLAs trace the bulk of the neutral hydrogen in the distant Universe and are the major repository of the fuel for the formation of the stars seen at present days (e.g. Prochaska & Wolfe, 2009; Noterdaeme et al., 2009). Many pieces of evidence link DLAs to star formation in high-redshift galaxies. For instance, the high column density of DLAs provides the necessary conditions for hydrogen to shield from the ambient ionizing radiation, potentially allowing the condensation of a cold and molecular phase that is thought to be essential for the formation of new stars (Krumholz et al., 2009; Neeleman et al., 2015; Noterdaeme et al., 2015; Rafelski et al., 2016). Furthermore, DLAs contain significant amounts of heavy elements with a mean metallicity of at , which is more than an order of magnitude above what is found in the intergalactic medium (e.g. Prochaska et al., 2003; Rafelski et al., 2012, 2014).
However, establishing a connection between DLAs and star-forming galaxies has been a non-trivial task. Despite decades of searches, only tens of DLAs have been associated directly to counterparts in emission, particularly thanks to recent campaigns (e.g. Møller et al., 2004; Fynbo et al., 2010; Noterdaeme et al., 2012; Péroux et al., 2012; Fynbo et al., 2013; Neeleman et al., 2017; Krogager et al., 2017). This low detection rate across the entire DLA population is generally attributed to the difficulties of imaging faint emission from stellar populations or hydrogen recombination lines at high redshifts. It also likely reflects the fact that only a fraction of the DLA population is directly connected to active in situ star formation, or that only a subset of DLAs reside near galaxies which are sufficiently bright for direct detection (such as high column-density and/or metal-rich DLAs; Fynbo et al., 2008; Møller et al., 2013; Christensen et al., 2014; Fumagalli et al., 2015; Joshi et al., 2017; Krogager et al., 2017).
Together with recent advancements at infrared and millimetre wavelengths (e.g. Péroux et al., 2012; Neeleman et al., 2017), the deployment of the Multi Unit Spectroscopic Explorer (MUSE; Bacon et al., 2010) at the Very Large Telescope (VLT) represents a breakthrough to address the long-standing issue of connecting DLAs to galaxy counterparts. Indeed, MUSE allows us to image Ly emission within 250 kpc from the position of known DLAs to flux limits of in exposure times of only few hours, thus enabling deep searches of DLA host galaxies without the need of pre-selecting targets for spectroscopic follow-up observations.
In this work, we present new MUSE observations of a field centred on the quasar J at , where high-resolution absorption spectroscopy reveals the presence of a high-column density DLA at the redshift (Prochaska et al., 2001; Fumagalli et al., 2014). This target has been selected from a larger parent sample of quasar fields with available deep optical imaging (see Sect. 2). The layout of this paper is the following. Details on the data acquisition and reduction are presented in Sect. 2, while the analysis and modelling of these observations are in Sect. 3, Sect. 4, and Sect. 5. Summary and conclusions are presented in Sect. 6. Throughout this work, we use the Planck 2015 cosmological parameters (, ; Planck Collaboration et al., 2016) and we quote magnitudes in the AB system.
2 Data acquisition and reduction
The quasar field J is one of the six fields selected from the parent sample of quasars included in our imaging survey designed to probe the in situ star formation rate (SFR) of high-redshift DLAs (O’Meara et al., 2006; Fumagalli et al., 2010, 2014, 2015). The six fields have been selected to host DLAs at , the redshift for which Ly enters the wavelength range covered by MUSE, with no other constraints on the physical properties of the absorbing gas (e.g. on metallicity). MUSE observations for this sub-sample have, at the time of writing, been recently completed at VLT as part of the ESO programmes 095.A-0051 and 096.A-0022 (PI Fumagalli). The line of sight presented in this work is the first field we have analysed, and the entire sample will be presented in a forthcoming publication.
MUSE observations of the quasar field J have been conducted during the nights 17-20 September 2015 in a series of 1500 s exposures totalling 2.5 hours on source, under good seeing (requested to be ) and clear sky, but with non-photometric conditions. Data have been reduced using the standard ESO MUSE pipeline (v1.6.2; Weilbacher et al., 2014) that includes basic data processing (bias subtraction and flat-fielding), plus wavelength and photometry calibrations. Throughout this analysis, barycentric corrections have been applied to the MUSE data and the wavelengths have been converted into vacuum for consistent comparisons with the spectroscopic data described below. We further post-process the resulting datacubes to enhance the quality of sky subtraction and flat-fielding using the CubExtractor code (CubEx, Cantalupo in prep.), following our earlier work (Borisova et al., 2016; Fumagalli et al., 2016a).
The final data product is a cube that samples the instrument field of view of arcmin2 in pixels of size arcsec and, for each pixel, contains a spectrum covering the wavelength range Å in bins of Å. Following comparisons with photometric data from the Sloan Digital Sky Survey (Eisenstein et al., 2011), we apply a small correction factor of to the flux calibration to account for low levels of atmospheric extinction during the observations. We further correct fluxes to remove Milky Way dust extinction in the direction of our observations following Schlafly & Finkbeiner (2011). At Å, which corresponds to the Ly wavelength at the redshift of the DLA, we achieve an effective image quality of arcsec, and a noise level of (root mean square).
Throughout this analysis, we further make use of broad-band imaging data collected with the Hubble Space Telescope (HST) in the F390W filter using Wide Field Camera 3, and in the , , and filters using the LRIS camera at the Keck Telescope. The observations and reduction techniques for these data are described in Fumagalli et al. (2014). Finally, we use archival spectroscopic data on the DLA from the HIRES instrument at the Keck Telescope and the X-SHOOTER instrument at VLT. These data are described in Prochaska et al. (2001) and López et al. (2016). The HIRES spectrum covers the wavelength range Å with a signal-to-noise ratio () of per pixel and a spectral resolution of . The X-SHOOTER spectrum covers instead the wavelength range Å with a per pixel at a resolution of , depending on the instrument arm.
3 Analysis of the imaging and spectroscopic data
3.1 The physical properties of the DLA
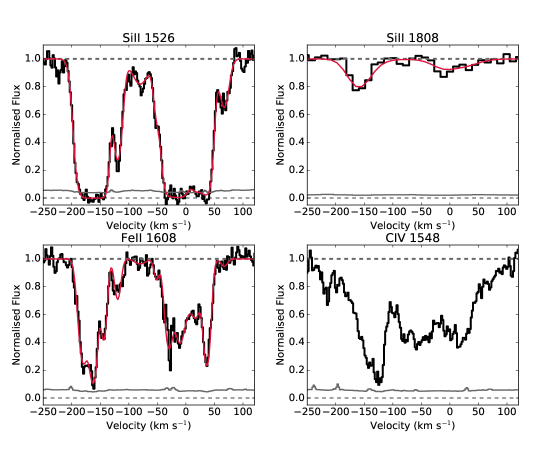
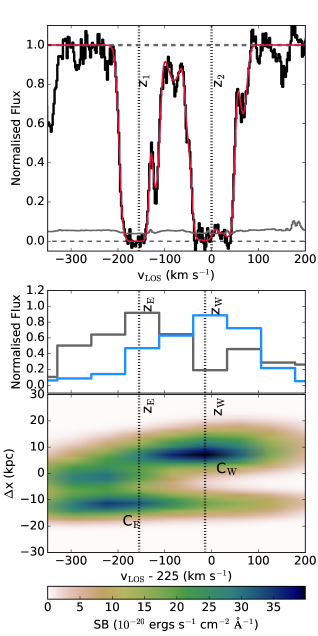
A gallery of selected absorption lines at the redshift of the DLA, which are chosen to be representative of low ionization transitions, is shown in Figure 1. The profiles of low ionization metal lines reveal the presence of two distinct main components, each showing additional sub-components. Velocity structure is also seen in C iv, although this ion does not track the low ionization transitions in velocity space, suggesting the presence of multi-phase gas in this DLA (e.g. Fox et al., 2007). By fitting Voigt profiles to the Si ii and the Fe ii lines using the VPFIT code (Carswell & Webb, 2014), we find a column-density weighted redshift of and for the two main components.
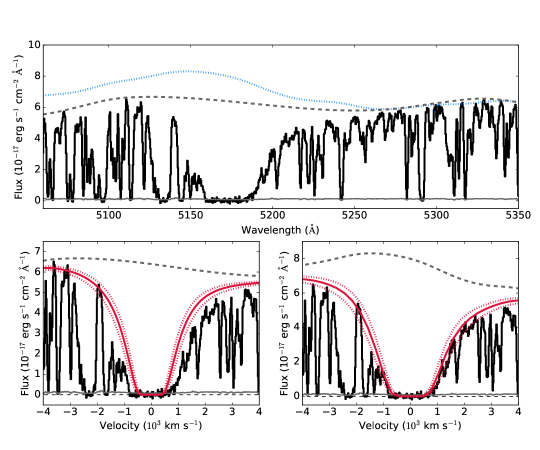
Further, a Voigt profile centred at provides a good description of the Ly absorption line and, in the following, we assume as the fiducial redshift for the DLA. As shown in Figure 2, the measurement of the H i column density is complicated by the fact that the Ly transition at the DLA redshift lies next to the O vi and Ly emission lines of the quasar, a coincidence that makes our estimate of the continuum level rather uncertain. For this reason, we derive at first a lower limit on the DLA column density by assuming a “local” continuum, which we obtain with a spline function constrained to follow regions deemed free from absorption inside the Ly forest (grey dashed line in the top panel of Figure 2). The resulting model for the DLA (bottom-left panel of Figure 2) yields a column density of , which is primarily constrained by the blue wing.
However, it is evident that additional absorption is present in the red side of the H i transition. Therefore, we construct a second model adopting the continuum level from the quasar template by Telfer et al. (2002), which we normalise to reproduce the observed spectrum in regions not absorbed by the Ly forest (blue dotted line in the top panel of Figure 2). With this continuum, we derive a second model for the DLA with (bottom-right of Figure 2), which is primarily constrained by the red wing of the absorption profile. As the red wing is less affected by the quasar emission lines, our model is not very sensitive to the exact shape of the template. For instance, the template by Vanden Berk et al. (2001) yields a consistent model within errors. Qualitatively, this model appears to reproduce well the shape of the Ly transition and hereafter, we assume as our best estimate for the H i column density. The quoted error does not reflect the systematic uncertainty on the continuum placement.
Before continuing with our analysis, we note that the low velocity separation of the two main metal components allows for a further decomposition of the H i profile, with components at and . Both in the cases of the local continuum determination and the continuum based on a quasar template, solutions with two components yield a total in agreement with the single-component analysis. However, the lack of high-order hydrogen lines, which fall beyond the Lyman limit of a higher redshift absorber, makes an unambiguous decomposition difficult. Further, sub-structures are evident within the metal lines beyond the two main components, suggesting that the physical interpretation of a two-cloud model is still limited. For this reason, we proceed with a single-component fit for H i, which is nevertheless effective in describing the total amount of neutral hydrogen within this system.
Strong metal lines in the DLA spectrum reveal that the absorbing gas is significantly enriched, with the majority of the low-ionization transitions being saturated, with the exception of the weak Si ii transition. After correcting the spectrum for partial blending arising from the telluric band between Å, we apply the kinematic model derived from the Si ii line to the Si ii transition, finding a column density of which is consistent with earlier measurements based on the apparent optical depth method (Prochaska et al., 2001; Fumagalli et al., 2014). Combined with the measurement of the H i column density and assuming the relative abundance pattern of the Sun from Asplund et al. (2009), we derive a metallicity of if , or assuming the fiducial value of column density (). No ionization corrections are included, as they are known to be negligible for DLAs. Similarly, no corrections for dust depletion have been applied, although we note they may be non-negligible given the metallicity of this system (up to , but generally for Si; Rafelski et al., 2012; De Cia et al., 2016).
From our analysis, we conclude that this system is enriched above the median value of for the DLA population at (Rafelski et al., 2012). Moreover, the line profiles exhibit a complex kinematic structure with two main velocity components stretching over , placing this DLA in the upper end of the metallicity and kinematics distribution of the DLA population at these redshifts (Ledoux et al., 2006; Neeleman et al., 2013).
3.2 Search for galaxy counterparts
The search for Ly emitting galaxies inside the MUSE cube is performed using the three-dimensional (3D) source extraction code CubEx (Cantalupo in prep.), following the techniques we developed for the analysis of MUSE observations in quasar fields at (e.g. Fumagalli et al., 2016a).
Briefly, after convolving the cube with a boxcar filter of 2 pixels on a side in the spatial direction, we search for candidate sources which are detected with within a minimum volume of 30 voxels. After producing 3D segmentation maps of all the detected objects, we create pseudo narrow-band images by projecting the cube along the wavelength direction as described in Borisova et al. (2016). Next, we visually inspect these images and the associated 1D spectra to exclude both spurious sources (cosmic rays and noise artefacts at the edge of the field of view) and lower-redshift line emitters, which we identify by virtue of resolved [OII] doublets or multiple emission lines.
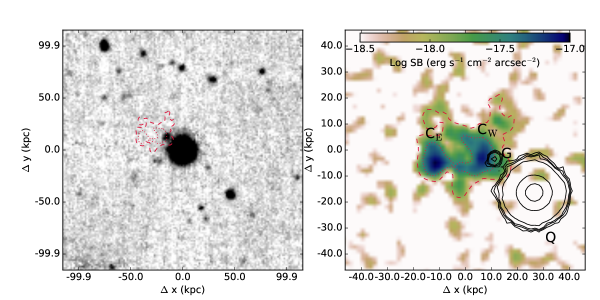
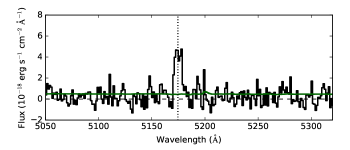
In the end, our search for Ly emitting sources within around the DLA redshift reveals the presence of an extended structure ( level of ) near the quasar, with two distinct clumps (hereafter the East “” and West “” clumps), as shown in Figure 3. A 1D spectrum extracted from a mask that encompasses the extent of the nebula (see Sect. 3.3) is in Figure 4. The Ly emission line is detected at high significance.
No other Ly sources are detected to a flux limit of ( confidence level). Based on the completeness tests we performed in Fumagalli et al. (2016a), our search is assumed to be complete to a flux of , after accounting for the shorter exposure time of these observations.
The detected source is clearly associated with the DLA, being separated by only in velocity space and having a centroid offset of kpc in projection with respect to the quasar sightline. The velocity offset increases to if we assume instead of as the redshift of the DLA. In any case, we note that redshifts of relative to systemic velocity are quite common for the resonant Ly transition in Lyman break galaxies (LBGs; e.g. Steidel et al., 2010; Bielby et al., 2011; Rakic et al., 2011), and are also seen in DLAs with detected Ly emission (e.g. Srianand et al., 2016; Joshi et al., 2017, and reference therein).
Finally, we measure spectroscopic redshifts for the continuum-detected sources, following the procedures detailed in Fumagalli et al. (2016a), which are here only briefly summarised. After generating a deep white-light image by collapsing the cube along the wavelength axis, we run the SExtractor code (Bertin & Arnouts, 1996) with a detection area of 8 pixels and a threshold of , where is the background root mean square. For each detected source, we then extract the 1D spectrum, which is visually inspected by two of the authors (MF and RM) to assign a redshift. Of all the galaxies to which we could assign a spectroscopic redshift following this procedure (typically with mag), none is found to lie within of the DLA.
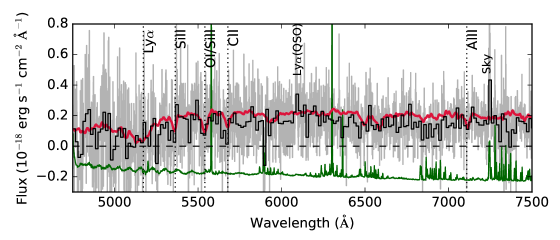
Due to its close separation to the quasar in projection, source G (Figure 3) requires an additional local background subtraction to correct for the contamination from the quasar light in the wings of the point spread function. To account for this, we extract an annulus centred on the quasar that encompasses the full width of galaxy G and contains pixels, without including the emission from the galaxy itself. We next generate a composite spectrum of the pixels contained in this annulus, which we subtract from the source spectrum.
As shown in Figure 5, the residual spectrum is very noisy. However, this source has a continuum emission consistent with a galaxy at when compared to an LBG template (Bielby et al., 2013). The high-redshift nature of this galaxy is also confirmed by the lack of detection in the LRIS filter () and the marginal detection in the HST F390W filter (). Combined with the and magnitudes measured in the Keck imaging (; ), we derive colours of and , which are consistent with those of LBGs (Steidel et al., 2003; Bielby et al., 2011). Moreover, after rebinning the spectrum, H i in absorption and perhaps metal lines at the DLA redshift are tentatively detected. We observe no Ly emission from this galaxy, but this is not unusual even for star-forming LBGs (Steidel et al., 2011). The best-fit redshift obtained comparing the spectro-photometry of galaxy G with the spectral energy distribution of an LBG is .
Given the presence of neutral hydrogen at the DLA position and that neutral hydrogen is likely present also at the location of the Ly emission, it is possible that the features seen in the spectrum of galaxy G originate from foreground absorption against the UV continuum of a source at (see Cooke & O’Meara, 2015). For this reason, and given the marginal quality of the data, we cannot determine a secure redshift for galaxy G. However, the colour information combined with the source position near the nebula makes galaxy G a compelling candidate for a system within the same structure that gives rise to the DLA and the extended Ly emission. Thus, in the following, we consider this galaxy at the redshift . Future follow-up observations targeting rest-frame optical lines in the IR will test our working hypothesis.
3.3 Properties of the detected galaxies
With a flux of measured in an image generated from the MUSE cube convolved with the SDSS -band filter, galaxy G is forming stars at a rate of , when adopting the calibration described in Fumagalli et al. (2010) and neglecting internal dust extinction. The impact parameter between the quasar sightline and galaxy G is , sufficiently large to make it quite unlikely that we are probing directly the galaxy interstellar medium in absorption.
As our data cover only the rest-frame UV (), we do not have a direct estimate of the galaxy stellar mass. Using empirical correlations between the SFRs and stellar masses of LBGs between , galaxy G is expected to have a stellar mass of (Whitaker et al., 2014; Salmon et al., 2015). Conversely, the stellar mass expected from scaling relations calibrated on known DLAs is a factor higher, as it is predicted to be for a DLA with metallicity of at the observed impact parameter (Møller et al., 2013; Christensen et al., 2014). However, the large scatter in both relations combined with the unknown dust extinction for galaxy G makes reliable comparisons between these methods difficult without additional observations that target the rest-frame optical and IR wavelengths. It is also interesting to note that this detection occurs in a metal-rich and high column-density DLA, in agreement with the trend that has emerged from searches of DLA counterparts completed in the past decades (Krogager et al., 2017).
Focusing on the extended Ly emission next, we use the surface brightness map extracted from the MUSE cube to define a region that encloses the full source (with a contour at the level of ), and the two clumps (with a contour at the level). These apertures are shown in Figure 3 and are used throughout this analysis to compute Ly line fluxes and for aperture-matched broadband photometry. Under these assumptions, the two knots and are separated by , and they contain respectively and of the total line flux of . As shown in Figure 3, these clumps are embedded in an extended component that stretches for kpc on a side. To date, this is one of the largest Ly emitting structures associated with a DLA (see e.g. Kashikawa et al., 2014).
When examining the line-of-sight velocity derived from the MUSE cube, differential velocity is seen across the structure, with the two clumps being separated by in velocity space (Figure 6). This velocity separation is consistent, within errors, with the velocity separation inferred from the two main absorption components (), suggesting that the Ly emission from the clumps follows the absorption profile of the DLA in velocity space. We note, however, that radiative transfer effects modulate the Ly line profile, potentially altering the relative velocity separation that is intrinsic for the two clumps.
The kinematic alignment is further highlighted in Figure 6, where we compare the emission and absorption spectra. After shifting the Ly emission by to align the first main absorption component with the redshift of , the DLA profile and the Ly line emission show remarkable similarity, reinforcing the hypothesis of a physical association between the two clumps and the DLA. Physically, reflects a combination of the offset between emission and absorption arising from radiative transfer effects and intrinsic velocity difference due to peculiar motions along the line of sight. With current observations, we cannot separate these two effects, but future IR observations that target rest-frame optical lines will be able to further constrain the kinematics of this system.
Focusing on the extended Ly emission, we note that it is largely non-overlapping with galaxy G. When masking this compact source, our analysis of deep imaging data from Keck, VLT, and HST reveals that no continuum emission is detected from the rest-frame wavelength interval Å, to a limit of Å-1 () that is calculated on the deepest imaging obtained by collapsing the MUSE cube along the wavelength axis. Hence, without considering galaxy G, the lack of extended UV continuum across this structure sets a limit for the average SFR of for the entire system, and and for the E and W clumps. These estimates do not account for possible dust-obscured components. The corresponding Ly rest-frame equivalent width for the two clumps (E and W) are Å and Å. Here, non-detections are computed at confidence level accounting for correlated noise by measuring the standard deviation of fluxes recovered in empty regions of the images within apertures of equal size to those defined above. With its UV flux, however, galaxy G contributes to the total equivalent width of the structure, which becomes Å in the rest frame.
4 Nature of the extended emission
Our MUSE observations reveal an emitting structure of on a side, the centre of which lies at an impact parameter of from the quasar sightline hosting a high-column density DLA. Further, a compact UV source is found at in projection from the quasar sightline, near the nebula. Combined, these pieces of evidence suggest the presence of a structure that contains neutral hydrogen and stretches for over in projection, giving rise to the DLA at the quasar position and the nebula. This structure further hosts one or multiple galaxies (see below).
A structure with these properties is reminiscent of the filamentary structures predicted by cosmological simulations, at the intersection of which galaxies form. Indeed, recent hydrodynamic simulations (Fumagalli et al., 2011; van de Voort et al., 2012; Rahmati & Schaye, 2014) consistently predict the presence of extended () filaments which give rise to absorption systems with in the surroundings of dark matter halos, and which host multiple satellite galaxies clustered to the main parent halo. Thus, interpreted in this context, our observations are probing the denser gas distribution either inside the circumgalactic medium (CGM) of galaxy G (with the caveat on the redshift discussed above) or inside a group of galaxies, with the observed Ly emission being powered by star formation. These two scenarios are discussed in the reminder of this section. A more direct comparison between the observed system and the results of a recent cosmological hydrodynamic simulation follows in Sect.5.
4.1 Photoionization from galaxy G
With an average surface brightness within from the star-forming galaxy G, the observed Ly emission may arise from photoionization and/or collisional ionization in the CGM of this galaxy. Indeed, extended Ly emission in excess of is typically seen around LBGs or low-mass star-forming galaxies and it is ubiquitously predicted by numerical simulations (e.g. Steidel et al., 2011; Wisotzki et al., 2016; Furlanetto et al., 2005; Faucher-Giguère et al., 2010; Rosdahl & Blaizot, 2012).
Considering the morphology and location of the Ly emission, we note that a model in which galaxy G is powering this nebula needs to account for both the off-centre position of the UV source compared to the Ly emitting structure and for the presence of substructures inside the nebula. Both requirements can be satisfied, at least qualitatively. First, offsets between the sites of star formation and regions of Ly emission have been reported in the literature (e.g. Sobral et al., 2015). Moreover, density fluctuations (or the presence of sub-halos) in the CGM could account for the observed clumps.
The next condition that must be satisfied is whether, from an energetic point of view, galaxy G can power the observed emission. Given the observed SFR, we estimate that this source produces ionizing radiation at a rate of , according to a starburst99 model with constant star formation rate, Geneva stellar tracks without rotation (Leitherer et al., 1999; Lagarde et al., 2012), and a metallicity comparable to the one of the DLA (). We note that stellar population models predict an anti-correlation between metallicity and flux of ionizing radiation, thus galaxy G will produce a lower if it has a metallicity higher than what is observed in the DLA. Assuming that a fraction of all recombinations gives rise to Ly (in case B), galaxy G can account for a total luminosity of , which is a factor of above the total observed luminosity of the nebula, . However, if galaxy G emits isotropically and the nebular emission arises from of the solid angle around the UV source, an escape fraction of in the direction of the nebula is required to power Ly with photoionization alone.
Our calculation is complicated by an unknown dust extinction, which is likely present inside this structure. Indeed, the resonant Ly emission can be easily absorbed by dust, making the luminosity inferred for the nebula only a lower limit. At the same time, galaxy G is likely to have an higher intrinsic star formation than what is inferred from UV observations, making also our current estimate for a lower limit. As dust can easily absorb Ly photons, as well as ionizing radiation, galaxy G appears to be marginally sufficient for powering the observed Ly emission. Although potentially viable from an energy point of view, this interpretation requires a very high and possibly anisotropic escape fraction, together with some degree of fine-tuning to reproduce the observed clumpiness inside the nebula. It also does not naturally explain the apparent kinematic alignment between the absorption and emission, which would require correlation of substructures within the CGM, but on opposite side of the galaxy star-forming region. Thus, additional ionization mechanisms are likely responsible for, or contribute to, the observed Ly emission.
4.2 Contribution from in situ star formation
A perhaps more natural explanation for the extended emission is the presence of in situ star formation within the two clumps. It is in fact possible that clump and are actively forming stars inside an extended gas rich structure, of which galaxy G is a member under our working assumption that this galaxy lies at the DLA redshift. Indeed, after masking galaxy G, the lack of extended UV continuum within the two clumps sets the rest-frame equivalent width to Å and Å, respectively, implying that and are being powered by a recent burst of star formation if the source of radiation is local (see below). If Ly is powered in situ, star formation could be occurring inside a proto-disk that is fragmenting in two clumps. However, the large separation of these clumps would imply the existence of a very extended star-forming disk at , and therefore it appears more likely that star formation occurs instead inside two low-mass galaxies that are on the verge of merging (e.g. Stierwalt et al., 2015; Ribeiro et al., 2016).
This scenario is quantitatively consistent with the results of starburst99 calculations, in which we follow the evolution of a single burst of for using again the Geneva stellar tracks with no rotation and with metallicity ( solar). As before, the Ly luminosity is computed from the photon flux of ionizing photons assuming case B recombination for gas at . The Ly equivalent width is derived mimicking the observational techniques by computing the UV continuum luminosity by averaging the stellar continuum over the wavelength interval covered by the MUSE observations. With this starburst99 model, we recover the well-known result of a decreasing equivalent width as a function of time from the burst (e.g. Charlot & Fall, 1993), a trend which we use to constrain the age of the burst.
By comparing our stellar population synthesis model to the inferred lower limits for the equivalent width (which are independent on the assumed mass of the burst), we infer an upper limit on the age of the burst of . At the same time, an estimate of the mass formed during this star formation event is obtained by scaling the predicted Ly luminosity (which is directly proportional to the mass of the burst) to match the observed value. As the luminosity is a function of time, we conservatively assume the maximum age of the burst allowed by the observed equivalent widths. With this comparison, we find that the two bursts in and account for a total stellar mass of and , respectively for the E and W clump. It should be noted that this simple mass estimate does not provide a direct measurement for the total mass associated with the DLA in this structure, as it accounts only for stars formed recently inside the two clumps under the assumptions described above.
A more extended star formation history would indeed contribute to additional mass in stars, a possibility that can be tested with observations in the rest-frame optical. Further, we emphasise that radiative transfer effects combined with an unknown dust extinction make these estimates uncertain. However, our limits can be considered conservative, as plausible corrections would increase the equivalent width, resulting in an even younger and more massive burst. Future deep observations in the far IR rest-frame will be able to assess the importance of dust-obscured star formation in this system.
Owing to more degrees of freedom, a model in which in situ star formation powers Ly appears to provide a more natural explanation for the observed clumps and for the kinematic alignment between emission and absorption spectra. Indeed, the DLA absorption can be interpreted as extended gas in the CGM of the two interacting galaxies, each of which retains the bulk of the halo systemic velocity. The interaction between the two systems may also induce a tidal force that pushes neutral hydrogen to large distances inside the CGM, as observed for instance in nearby interacting dwarfs (e.g. Pearson et al., 2016).
Gravitational interactions that remove enriched material from the interstellar medium of these galaxies can also account for the observed metallicity of the DLA, which is significantly above the mean metallicity of the IGM and CGM at these redshifts (e.g. Schaye et al., 2003; Fumagalli et al., 2016b). Indeed, a -solar metallicity resembles the metal content of the interstellar medium of galaxies according to the mass-metallicity relation (Mannucci et al., 2009). In addition to tidal interactions, galactic outflows are also a plausible mechanism to enrich the DLA. However, a wind originating from the two bursts in clump and would have to travel at a velocity to reach the DLA in . Thus, it is more plausible that older episodes of star formation, or winds from galaxy G and other galaxies below our detection limit, have contributed to the observed enrichment.
Given the above discussions, it is clear that we cannot draw a firm conclusion on the nature of this system based on current data. Our analysis, however, favours a model in which the quasar sightline is probing an extended gas rich structure, within which two low-mass galaxies undergo a recent burst of star formation triggered by their encounter. Galaxy G likely lies within the same structure, or at comparable redshift within a group. Future observations targeting rest-frame optical lines and dust from these galaxies will be able to further refine the relative position/velocities of the members of this structure, as well as to refine our estimates on what powers the extended Ly emission, thus providing more definite information on this system.
5 Comparison with the eagle simulations
With only a handful of DLA sightlines being targeted by MUSE at present, we have limited empirical information on the frequency of extended nebulae near DLAs. To offer additional insight into the probability of uncovering similar systems in the future, we turn to the results of the eagle cosmological simulations (Schaye et al., 2015; Crain et al., 2015). A general prediction of these and other simulations is that DLAs are clustered with galaxies of a wide range of masses in CDM (e.g. Pontzen et al., 2008; Rahmati & Schaye, 2014). Here, we focus on the more specific question of how common systems like the observed one are in simulated volumes at . To address this question, we start by asking what fraction of DLAs lies in proximity to galaxies similar to galaxy G. Next, we estimate how common DLAs are in group environments, concluding with a search of a close-analogue to the observed system.
5.1 The eagle simulations and radiative transfer post-processing
eagle is a suite of cosmological hydrodynamic simulations performed in cubic volumes with co-moving lengths ranging from to 100 co-moving Mpc, with cosmological parameters taken from the Planck Collaboration et al. (2014) analysis. Simulations are performed using the Gadget-3 incarnation of the tree-SPH code described by Springel (2005), with modifications to the hydrodynamics and time-stepping schemes (see Schaller et al. (2015) for details), and the inclusion of a range of subgrid models to account for unresolved physics below the resolution scale, calibrated as described by Crain et al. (2015). Briefly, the simulations incorporate the major ingredients required to model galaxy evolution, including element-by-element radiative cooling and photoheating, a pressure-dependent star formation law above a metallicity-dependent density threshold, mass loss from stars and supernovae, and thermal feedback associated with star formation and active galactic nuclei111Details on these implementations can be found in Schaye et al. (2015), together with relevant discussion on differences with previous simulations, e.g. OWLS (Schaye et al., 2010)..
Here we use two different eagle runs from table 2 in Schaye et al. (2015). To examine the correlation between galaxies and DLAs we use the higher resolution run L0025N0752 ( Mpc, SPH particle mass M⊙, co-moving Plummer-equivalent softening kpc). To investigate the presence of multiple galaxies in the same structure, we use instead run L0100N1504 ( Mpc, M⊙, kpc), which has better galaxy statistics. Relevant to the current analysis is that eagle reproduces the galaxy stellar mass function to within current observational uncertainties, although the specific SFRs are low by dex if the data are taken at face value (Furlong et al., 2015).
We use the urchin reverse-ray tracing code described by Altay & Theuns (2013) to compute the neutral fraction of all gas particles, assuming the IGM to be photoionized at the rate computed by Haardt & Madau (2001). Projecting the neutral hydrogen density of all gas particles onto a side of the simulation box allows us to evaluate the H i column density for sightlines parallel to a coordinate axis of the cube. Applied to eagle, this procedure reproduces the observed number of DLAs (as well as Lyman limit systems) per unit absorption distance as a function of column density very well (see Rahmati et al., 2015), at least as well as the owls simulation analysed in the same way by Altay et al. (2011). Galaxies in eagle are identified as self-bound substructure inside dark matter halos, using the subfind algorithm of Springel et al. (2001) and Dolag et al. (2009). Next, we compute the stellar mass and SFR for each galaxy, the position and peculiar velocity of their centres of mass, as well as the mass of their parent dark matter halos (see McAlpine et al., 2016). Finally, we correlate DLAs to galaxies, by combining the H i column through the eagle volume with the location of galaxies.
We note how, in the previous section, we have explored the relevance of ionizing radiation produced by local sources in powering the observed Ly emission in the nebula. However, when comparing with the results of the eagle simulations, we do not include photoionization from local sources for the following reason. While local radiation is clearly relevant to model in detail the particle-by-particle ionization state of the gas and its emissivity near galaxies, in practice, the inclusion of radiative transfer effects from local sources is subject to uncertainties related to the unresolved structure of the interstellar medium within large cosmological simulations. These uncertainties are particularly significant at high column densities (; Rahmati et al., 2013), which are relevant for this work.
Therefore, we refrain from deriving predictions of the Ly luminosity from DLAs in eagle, focusing instead on the more basic task of comparing the general DLA population with galaxies in the eagle volume. As discussed in the literature (e.g. Fumagalli et al., 2011; Rahmati et al., 2013), while local sources of radiation may alter the cross section of individual absorbers, extended DLAs next to galaxies persist even after including local sources. This implies that associations between DLAs and galaxies in simulations are generally robust even without inclusion of local sources during the radiative transfer post-processing. Nevertheless, in the following, we provide a qualitative description of how sensitive our conclusions are to the assumptions made during radiative transfer post-processing.
5.2 Statistical analysis of DLAs associated to galaxies in eagle
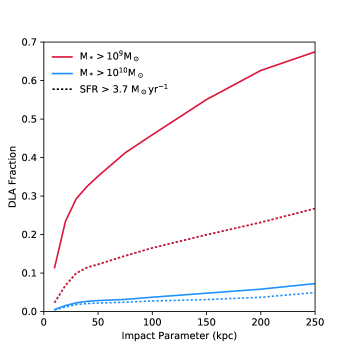
We estimate the probability with which systems like the one uncovered by our study can be found in future observations by first quantifying the fraction of DLAs that resides near galaxies with properties similar to galaxy G (with the caveat on the redshift discussed above). For this, we begin by identifying all DLA sightlines with , which is the minimum column density of the observed DLA as discussed in Sect. 3.1. The likelihood of observing a galaxy with properties similar to that of galaxy G (see Sect. 3.3) within a given impact parameter from a DLA with this column density is shown in Figure 7.
The observed projected distance between the DLA and galaxy G is kpc, but the galaxy stellar mass is relatively uncertain, and therefore we show curves for two choices, and M⊙ (red and blue solid curves, respectively). From this analysis, it is clear that finding a DLA-galaxy pair with such a close impact parameter has a probability of and , respectively for the two choices of mass. We note that this probability would further increase if we had to consider a higher column density for the DLA. When we require that the galaxy undergoes star formation at a rate exceeding , we find that these probabilities drop to and , respectively (dashed lines in Figure 7).
As discussed above, since we do not include local sources in our calculation, the total number of DLAs recovered in this calculation is formally an upper limit. However, DLAs sightlines are clustered in structures with a range of column densities, implying that neutral gas with column densities above the threshold is likely to be found in the same regions identified by our study even when radiative transfer effects from local sources are included. For this reason, we regard our conclusions as largely insensitive to the details of the radiative transfer post-processing.
Next, we investigate how frequently a DLA sightline with passes near a galaxy with properties similar to those of clumps and combined. In this case, we require that the SFR averaged over the past is M⊙ yr-1, whereas when averaged over the past 1 Gyr is M⊙ yr-1. This is in line with our estimates from Sect. 3.3. For the observed impact parameter between the clumps and the DLA of kpc, we find that these criteria apply to of the selected DLA sightlines in eagle. Again, we regard these statistics as largely independent of radiative transfer effects for the reasons discussed above.
Finally, we use eagle to quantify the joint probability of finding a galaxy with properties consistent with those of galaxy G near two star-forming galaxies consistent with and . For this calculation, we turn to the box to increase the statistical significance of this analysis. To mimic our observations, we require that one galaxy has (as galaxy G), which is within a projected separation kpc of two star-bursting galaxies with M⊙ yr-1, in line with the inferred properties of the two clumps which form of stars in . To match the observed equivalent widths, we further require that M⊙ yr-1. Finally, we demand that the two galaxies are less than apart (projected distance), to mimic the observed separation between and .
After imposing these constraints, we find 21 such triples in the eagle run with . In most of the cases, the triple corresponds to a situation where all three galaxies are members of the same galaxy group, with halo mass in the range M⊙. We note that for each pair ( and ), there are several nearby galaxies that are consistent with galaxy G, implying that other star-forming galaxies are predicted in the surroundings of DLAs associated with these groups. The velocity offset between these galaxies ranges between , consistent with the virial velocity222We employ the usual definition where is the radius of a halo, defined such that the mass within equals , where is the critical density. of
| (1) |
in groups of this halo mass at this redshift. Such offsets are consistent with those found between galaxy G, the clumps, and the DLA. We conclude from this that the observed system is consistent with the DLA being associated with a galaxy group, of which G, and are members under our working hypothesis that . Such groups are relatively rare at , with a number density of per comoving Mpc3, with typical radius of physical kpc, a size which is consistent with the observed projected separations. Only a small fraction of such groups contain two star bursting and merging galaxies of the types of the observed clumps.
Altogether, we conclude from this comparison with the results of the eagle simulation that systems such as the one observed - consisting of a DLA, with a nearby relatively massive galaxy and a further two lower mass star-bursting galaxies - do occur in simulations, although not with high number density. In the majority of cases, such systems are associated with a group of galaxies, with the DLA also associated with the group. The velocity offsets amongst the galaxies themselves, and between the galaxies and the DLA, are predicted to arise from virial motions in a dark matter halo of mass . This result implies that, for the case of groups, individual galaxy-absorber associations cannot be trivially established, and that these do not provide a complete description of the systems probed in absorption.
5.3 Close analogue of the observed system
We conclude this section by briefly discussing the properties of a close analogue of the observed association of two star bursting galaxies near a DLA, which we have identified during this analysis within the eagle L0025N0752 run. This simulated object offers an example that configurations like the observed one - with two galaxies in synchronous star-burst phases inside an extended DLA - are plausible within the current cosmological model.
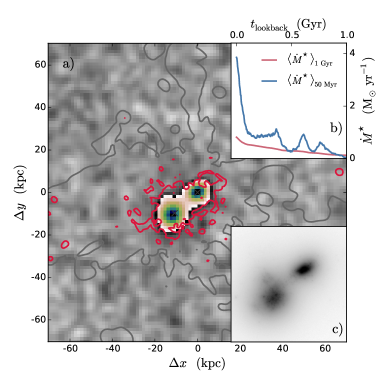
The simulated system, which is shown in Figure 8, is composed of two galaxies that are undergoing a merger that triggers two synchronous bursts of star formation, and which form a total of of stars within , similar to the observed clumps and . Prior to this encounter, the two galaxies were forming stars at a rate , and hence, again similar to clumps and , would not have been detected in our current UV continuum observations. Inset b shows the recent star formation history of both clumps combined, measured back in time with look back time chosen to correspond to the time at which the system is observed in the simulation. This close analogue is further embedded within a DLA with an extent of (red contours), which is part of a large-scale filament, as traced by lower column density neutral hydrogen (grey contours). Being related to the properties of a single object, we caution that this part of the analysis is more prone to uncertainties introduces by our assumptions on radiative transfer. The simulation further predicts a mass-weighted metallicity for this system of about solar, again close to the observed value.
Using the star formation history known from the simulation, we generate a mock Ly image (background grey scale in the main panel) with depth and resolution comparable to the MUSE data, by scaling the Ly luminosity from the stellar population synthesis model described above according to the stellar mass generated within the simulation during the burst. As before, we neglect radiative transfer effects and dust absorption. The resulting map is computed for the Ly luminosity close to the peak of the burst (at ). We also generate a rest-frame -band image of the stellar continuum at full resolution following the method discussed in Trayford et al. (2017), shown in panel c.
6 Summary and Conclusions
We have presented new MUSE observations of the quasar field J (), which is known to host an intervening DLA at with (with a best estimate of ) and metallicity (with a best estimate of ). By reaching a flux limit of (), our observations uncover a extended structure that emits in Ly with a total luminosity of . The centre of this nebula is located at a projected distance of from the quasar sightline.
This nebula also contains two distinct clumps, for which no continuum is detected to rest-frame equivalent limits of Å and Å. The two clumps are separated by in projection and have a line-of-sight velocity difference of , which is consistent with the velocity difference of measured in between the two main absorption components seen in the metal transitions associated with the DLA.
Furthermore, a compact galaxy is detected in the continuum at a projected distance of from the quasar sightline. The MUSE spectrum of this source is noisy, but with properties consistent with a star-forming galaxy. Given its close proximity to the nebula and its photometric properties, we consider this galaxy to be physically associated with the structure hosting the DLA.
Based on current observations, two mechanisms appear plausible to power the extended Ly emission. First, with a star formation rate of , photoionization from the continuum-detected galaxy may ionize the galaxy CGM, powering the nebula. However, this scenario requires an elevated escape fraction () of ionizing radiation from the sites of star formation, although an unknown dust extinction hampers robust conclusions. A second viable model for powering the nebula is that Ly emission arises from in-situ star formation inside the two embedded clumps, in the form of two young () starbursts likely triggered by a merger of two galaxies. This scenario also provides a satisfactory explanation, at least qualitatively, for the observed kinematic alignment between the two clumps and the main absorption components of the DLA. Finally, a combination of in-situ star formation and ionization from galaxy G may also account for the total energy budget. Additional follow-up observations at rest-frame optical and IR wavelengths are now required to better characterise the nature of this system, especially by confirming the redshift of the continuum detected galaxy and by constraining the presence of dust inside this structure.
Regardless of what is powering the observed emission, the position of the DLA and the extent of the Ly nebula jointly suggest the presence of a gas-rich structure that stretches for on a side, inside which one or multiple galaxies are forming stars. This structure is reminiscent of the filaments predicted by hydrodynamic cosmological simulations, at the intersection of which galaxies form. Within this model, we would expect a fraction of DLAs to be embedded within structures hosting galaxies that are surrounded by extended halos or filaments which radiate in Ly emission (Cantalupo et al., 2012; Rauch et al., 2013; Wisotzki et al., 2016).
The association between extended Ly nebulae discovered in deep long-slit spectroscopy or narrow-band images and the population of optically-thick absorbers, and particularly DLAs, has already been explored from a statistical point of view by Rauch et al. (2008). This study suggests that low-surface brightness nebulae have sufficiently large number density and covering factor to account for the observed incidence of DLAs. Compared to the properties of the nebulae presented in this work, however, the emitters uncovered in the deep long-slit observations by Rauch et al. (2008) are generally more compact, with sizes measured at . Only a few cases ( objects) are found with sizes , which is similar to the extent of the nebula discovered in our MUSE observations. Moreover, the objects from Rauch et al. (2008) have a typical luminosity , again placing the nebula near the DLA in the extreme tail of the population of these emitters.
The Ly sources discussed in Rauch et al. (2008) represent “field” objects which are not explicitly associated to a DLA. However, examples of diffuse Ly nebulae in proximity of DLAs, which exhibit characteristics similar to the system described in this work, can be found in the literature (e.g. Fynbo et al., 1999; Zafar et al., 2011; Kashikawa et al., 2014). In particular, while the system reported in Fynbo et al. (1999) and Zafar et al. (2011) lies in proximity to a quasar, the object presented by Kashikawa et al. (2014) is a close analogue to the system discussed here, being associated to an intervening DLA with a luminosity of and a size of as measured in a 2D spectrum at a depth of .
A question that arises from our study and previous work is how common extended nebulae near DLAs are. Our discovery of a nebula in a field that had been studied previously with optical imaging campaigns yielding no detections (Fumagalli et al., 2014, 2015) hints that previous imaging and, to some extent, spectroscopic observations have been unable to identify these types of associations with high completeness. Hence, our study offers a clear example of the need for deep multiwavelength campaigns to map simultaneously the galaxy population and the more diffuse gas environment near DLAs.
Based on the number density estimates in Rauch et al. (2008) and our comparisons with the eagle simulations, it is however unlikely that nebulae with sizes and luminosity are common occurrence next to DLAs. Nevertheless, this system offers a tantalising example of how continuum-detected sources (especially near metal-rich DLAs; Krogager et al., 2017) may not represent isolated associations but trace instead clustered galaxy formation inside a web of filaments. In fact, the presence of DLAs in interacting groups has already been confirmed with observations in the literature. For instance, Warren & Møller (1996) and Weatherley et al. (2005) reported the detection of multiple emission-line galaxies in the fields of two DLAs at and . The plausibility of DLAs being associated with clustered galaxy formation is also confirmed by our analysis of the eagle simulations.
At present, we cannot derive firm conclusions on the number density of these types of associations, as a systematic exploration of the incidence of extended nebulae and groups in proximity to DLAs has not been possible so far due to the difficulties of reaching flux limits of (Christensen et al., 2007). However, the deployment of sensitive large-format integral field spectrographs at 8-meter telescopes and of the full ALMA array will soon enable deep and complete multiwavelength searches for both star-forming galaxies (including dust-obscured systems) and diffuse emission near DLAs. These observations, in tandem with refined model predictions of the emission properties from dense filaments that are traced by strong absorption line systems, will offer a novel way to test if galaxy formation proceeds inside gas-rich filaments as predicted by current cosmological simulations.
Acknowledgements
We thank G. Ashworth for producing preliminary stellar population synthesis models and R. Cooke for assistance with the modelling of absorption lines. We also thank J. Schaye for providing comments on a draft of this manuscript, and the eagle team for making the comparison with simulations possible. M.F. and T.T. acknowledge support by the Science and Technology Facilities Council [grant number ST/P000541/1]. T.T. also acknowledges the Interuniversity Attraction Poles Programme initiated by the Belgian Science Policy Office ([AP P7/08 CHARM]). JXP acknowledges support from the National Science Foundation (NSF) grants AST-1010004 and AST-1412981. This work is based on observations collected at the European Organisation for Astronomical Research in the Southern Hemisphere under ESO programme ID 095.A-0051. Some of data presented herein were obtained at the W.M. Keck Observatory. Part of this work used the DiRAC Data Centric system at Durham University, operated by the Institute for Computational Cosmology on behalf of the STFC DiRAC HPC Facility (www.dirac.ac.uk). This equipment was funded by BIS National E-Infrastructure capital grant ST/K00042X/1, STFC capital grant ST/H008519/1, and STFC DiRAC is part of the National E-Infrastructure. This research made use of Astropy, a community-developed core Python package for Astronomy (Astropy Collaboration et al., 2013). For access to the data and codes used in this work, please contact the authors or visit http://www.michelefumagalli.com/codes.html. VLT data are also available via the ESO archive.
References
- Altay et al. (2011) Altay, G., Theuns, T., Schaye, J., Crighton, N. H. M., & Dalla Vecchia, C. 2011, ApJ, 737, L37
- Altay & Theuns (2013) Altay, G., & Theuns, T. 2013, MNRAS, 434, 748
- Asplund et al. (2009) Asplund, M., Grevesse, N., Sauval, A. J., & Scott, P. 2009, ARA&A, 47, 481
- Astropy Collaboration et al. (2013) Astropy Collaboration, Robitaille, T. P., Tollerud, E. J., et al. 2013, A&A, 558, A33
- Bacon et al. (2010) Bacon, R., Accardo, M., Adjali, L., et al. 2010, Proc. SPIE, 7735, 773508
- Bertin & Arnouts (1996) Bertin, E., & Arnouts, S. 1996, A&AS, 117, 393
- Bielby et al. (2011) Bielby, R. M., Shanks, T., Weilbacher, P. M., et al. 2011, MNRAS, 414, 2
- Bielby et al. (2016) Bielby, R., Crighton, N. H. M., Fumagalli, M., et al. 2016, arXiv:1607.03386
- Bielby et al. (2013) Bielby, R., Hill, M. D., Shanks, T., et al. 2013, MNRAS, 430, 425
- Blumenthal et al. (1984) Blumenthal, G. R., Faber, S. M., Primack, J. R., & Rees, M. J. 1984, Nature, 311, 517
- Borisova et al. (2016) Borisova, E., Cantalupo, S., Lilly, S. J., et al. 2016, ApJ, 831, 39
- Cantalupo et al. (2012) Cantalupo, S., Lilly, S. J., & Haehnelt, M. G. 2012, MNRAS, 425, 1992
- Cai et al. (2017) Cai, Z., Fan, X., Yang, Y., et al. 2017, ApJ, 837, 71
- Carswell & Webb (2014) Carswell, R. F., & Webb, J. K. 2014, Astrophysics Source Code Library, ascl:1408.015
- Charlot & Fall (1993) Charlot, S., & Fall, S. M. 1993, ApJ, 415, 580
- Christensen et al. (2007) Christensen, L., Wisotzki, L., Roth, M. M., et al. 2007, A&A, 468, 587
- Christensen et al. (2014) Christensen, L., Møller, P., Fynbo, J. P. U., & Zafar, T. 2014, MNRAS, 445, 225
- Cooke & O’Meara (2015) Cooke, J., & O’Meara, J. M. 2015, ApJ, 812, L27
- Crain et al. (2015) Crain, R. A., Schaye, J., Bower, R. G., et al. 2015, MNRAS, 450, 1937
- Cucciati et al. (2014) Cucciati, O., Zamorani, G., Lemaux, B. C., et al. 2014, A&A, 570, A16
- De Cia et al. (2016) De Cia, A., Ledoux, C., Mattsson, L., et al. 2016, A&A, 596, A97
- Dolag et al. (2009) Dolag, K., Borgani, S., Murante, G., & Springel, V. 2009, MNRAS, 399, 497
- Eisenstein et al. (2011) Eisenstein, D. J., Weinberg, D. H., Agol, E., et al. 2011, AJ, 142, 72
- Faucher-Giguère et al. (2010) Faucher-Giguère, C.-A., Kereš, D., Dijkstra, M., Hernquist, L., & Zaldarriaga, M. 2010, ApJ, 725, 633
- Fox et al. (2007) Fox, A. J., Ledoux, C., Petitjean, P., & Srianand, R. 2007, A&A, 473, 791
- Fumagalli et al. (2010) Fumagalli, M., O’Meara, J. M., Prochaska, J. X., & Kanekar, N. 2010, MNRAS, 408, 362
- Fumagalli et al. (2011) Fumagalli, M., Prochaska, J. X., Kasen, D., et al. 2011, MNRAS, 418, 1796
- Fumagalli et al. (2014) Fumagalli, M., O’Meara, J. M., Prochaska, J. X., Kanekar, N., & Wolfe, A. M. 2014, MNRAS, 444, 1282
- Fumagalli et al. (2015) Fumagalli, M., O’Meara, J. M., Prochaska, J. X., Rafelski, M., & Kanekar, N. 2015, MNRAS, 446, 3178
- Fumagalli et al. (2016a) Fumagalli, M., Cantalupo, S., Dekel, A., et al. 2016, MNRAS, 462, 1978
- Fumagalli et al. (2016b) Fumagalli, M., O’Meara, J. M., & Prochaska, J. X. 2016, MNRAS, 455, 4100
- Furlanetto et al. (2005) Furlanetto, S. R., Schaye, J., Springel, V., & Hernquist, L. 2005, ApJ, 622, 7
- Furlong et al. (2015) Furlong, M., Bower, R. G., Theuns, T., et al. 2015, MNRAS, 450, 4486
- Fynbo et al. (1999) Fynbo, J. U., Møller, P., & Warren, S. J. 1999, MNRAS, 305, 849
- Fynbo et al. (2008) Fynbo, J. P. U., Prochaska, J. X., Sommer-Larsen, J., Dessauges-Zavadsky, M., & Møller, P. 2008, ApJ, 683, 321-328
- Fynbo et al. (2010) Fynbo, J. P. U., Laursen, P., Ledoux, C., et al. 2010, MNRAS, 408, 2128
- Fynbo et al. (2013) Fynbo, J. P. U., Geier, S. J., Christensen, L., et al. 2013, MNRAS, 436, 361
- Haardt & Madau (2001) Haardt F., Madau P., 2001, in Clusters of Galaxies and the High Redshift Universe Observed in X-rays, Neumann D. M., Tran J. T. V., eds.
- Joshi et al. (2017) Joshi, R., Srianand, R., Noterdaeme, P., & Petitjean, P. 2017, MNRAS, 465, 701
- Kashikawa et al. (2014) Kashikawa, N., Misawa, T., Minowa, Y., et al. 2014, ApJ, 780, 116
- Krogager et al. (2017) Krogager, J.-K., Møller, P., Fynbo, J. P. U., & Noterdaeme, P. 2017, arXiv:1704.08075
- Krumholz et al. (2009) Krumholz, M. R., Ellison, S. L., Prochaska, J. X., & Tumlinson, J. 2009, ApJ, 701, L12
- Lagarde et al. (2012) Lagarde, N., Decressin, T., Charbonnel, C., et al. 2012, A&A, 543, A108
- Ledoux et al. (2006) Ledoux, C., Petitjean, P., Fynbo, J. P. U., Møller, P., & Srianand, R. 2006, A&A, 457, 71
- Leitherer et al. (1999) Leitherer, C., Schaerer, D., Goldader, J. D., et al. 1999, ApJS, 123, 3
- López et al. (2016) López, S., D’Odorico, V., Ellison, S. L., et al. 2016, A&A, 594, A91
- Mannucci et al. (2009) Mannucci, F., Cresci, G., Maiolino, R., et al. 2009, MNRAS, 398, 1915
- McAlpine et al. (2016) McAlpine, S., Helly, J. C., Schaller, M., et al. 2016, Astronomy and Computing, 15, 72
- Møller et al. (2013) Møller, P., Fynbo, J. P. U., Ledoux, C., & Nilsson, K. K. 2013, MNRAS, 430, 2680
- Møller et al. (2004) Møller, P., Fynbo, J. P. U., & Fall, S. M. 2004, A&A, 422, L33
- Neeleman et al. (2017) Neeleman, M., Kanekar, N., Prochaska, J. X., et al. 2017, Science, 355, 1285
- Neeleman et al. (2015) Neeleman, M., Prochaska, J. X., & Wolfe, A. M. 2015, ApJ, 800, 7
- Neeleman et al. (2013) Neeleman, M., Wolfe, A. M., Prochaska, J. X., & Rafelski, M. 2013, ApJ, 769, 54
- Noterdaeme et al. (2015) Noterdaeme, P., Srianand, R., Rahmani, H., et al. 2015, A&A, 577, A24
- Noterdaeme et al. (2012) Noterdaeme, P., Laursen, P., Petitjean, P., et al. 2012, A&A, 540, A63
- Noterdaeme et al. (2009) Noterdaeme, P., Petitjean, P., Ledoux, C., & Srianand, R. 2009, A&A, 505, 1087
- O’Meara et al. (2006) O’Meara, J. M., Chen, H.-W., & Kaplan, D. L. 2006, ApJ, 642, L9
- Pearson et al. (2016) Pearson, S., Besla, G., Putman, M. E., et al. 2016, MNRAS, 459, 1827
- Péroux et al. (2012) Péroux, C., Bouché, N., Kulkarni, V. P., York, D. G., & Vladilo, G. 2012, MNRAS, 419, 3060
- Péroux et al. (2017) Péroux, C., Rahmani, H., Quiret, S., et al. 2017, MNRAS, 464, 2053
- Planck Collaboration et al. (2014) Planck Collaboration, Ade, P. A. R., Aghanim, N., et al. 2014, A&A, 571, A1
- Planck Collaboration et al. (2016) Planck Collaboration, Ade, P. A. R., Aghanim, N., et al. 2016, A&A, 594, A13
- Pontzen et al. (2008) Pontzen, A., Governato, F., Pettini, M., et al. 2008, MNRAS, 390, 1349
- Prochaska & Wolfe (2009) Prochaska, J. X., & Wolfe, A. M. 2009, ApJ, 696, 1543
- Prochaska et al. (2003) Prochaska, J. X., Gawiser, E., Wolfe, A. M., Castro, S., & Djorgovski, S. G. 2003, ApJ, 595, L9
- Prochaska et al. (2001) Prochaska, J. X., Wolfe, A. M., Tytler, D., et al. 2001, ApJS, 137, 21
- Rakic et al. (2011) Rakic, O., Schaye, J., Steidel, C. C., & Rudie, G. C. 2011, MNRAS, 414, 3265
- Rafelski et al. (2016) Rafelski, M., Gardner, J. P., Fumagalli, M., et al. 2016, ApJ, 825, 87
- Rafelski et al. (2014) Rafelski, M., Neeleman, M., Fumagalli, M., Wolfe, A. M., & Prochaska, J. X. 2014, ApJ, 782, L29
- Rafelski et al. (2012) Rafelski, M., Wolfe, A. M., Prochaska, J. X., Neeleman, M., & Mendez, A. J. 2012, ApJ, 755, 89
- Rahmati et al. (2013) Rahmati, A., Schaye, J., Pawlik, A. H., & Raicevic, M. 2013, MNRAS, 431, 2261
- Rahmati et al. (2015) Rahmati, A., Schaye, J., Bower, R. G., et al. 2015, MNRAS, 452, 2034
- Rahmati & Schaye (2014) Rahmati, A., & Schaye, J. 2014, MNRAS, 438, 529
- Rauch et al. (2008) Rauch, M., Haehnelt, M., Bunker, A., et al. 2008, ApJ, 681, 856-880
- Rauch et al. (2013) Rauch, M., Becker, G. D., Haehnelt, M. G., Gauthier, J.-R., & Sargent, W. L. W. 2013, MNRAS, 429, 429
- Ribeiro et al. (2016) Ribeiro, B., Le Fèvre, O., Cassata, P., et al. 2016, arXiv:1611.05869
- Rosdahl & Blaizot (2012) Rosdahl, J., & Blaizot, J. 2012, MNRAS, 423, 344
- Salmon et al. (2015) Salmon, B., Papovich, C., Finkelstein, S. L., et al. 2015, ApJ, 799, 183
- Schaller et al. (2015) Schaller, M., Dalla Vecchia, C., Schaye, J., et al. 2015, MNRAS, 454, 2277
- Schaye et al. (2015) Schaye, J., Crain, R. A., Bower, R. G., et al. 2015, MNRAS, 446, 521
- Schaye et al. (2010) Schaye, J., Dalla Vecchia, C., Booth, C. M., et al. 2010, MNRAS, 402, 1536
- Schaye et al. (2003) Schaye, J., Aguirre, A., Kim, T.-S., et al. 2003, ApJ, 596, 768
- Schlafly & Finkbeiner (2011) Schlafly, E. F., & Finkbeiner, D. P. 2011, ApJ, 737, 103
- Sobral et al. (2015) Sobral, D., Matthee, J., Darvish, B., et al. 2015, ApJ, 808, 139
- Springel et al. (2001) Springel, V., White, S. D. M., Tormen, G., & Kauffmann, G. 2001, MNRAS, 328, 726
- Springel (2005) Springel, V. 2005, MNRAS, 364, 1105
- Srianand et al. (2016) Srianand, R., Hussain, T., Noterdaeme, P., et al. 2016, MNRAS, 460, 634
- Steidel et al. (2011) Steidel, C. C., Bogosavljević, M., Shapley, A. E., et al. 2011, ApJ, 736, 160
- Steidel et al. (2010) Steidel, C. C., Erb, D. K., Shapley, A. E., et al. 2010, ApJ, 717, 289
- Steidel et al. (2003) Steidel, C. C., Adelberger, K. L., Shapley, A. E., et al. 2003, ApJ, 592, 728
- Stierwalt et al. (2015) Stierwalt, S., Besla, G., Patton, D., et al. 2015, ApJ, 805, 2
- Telfer et al. (2002) Telfer, R. C., Zheng, W., Kriss, G. A., & Davidsen, A. F. 2002, ApJ, 565, 773
- Trayford et al. (2017) Trayford, J. W., Camps, P., Theuns, T., et al. 2017, arXiv:1705.02331
- Vanden Berk et al. (2001) Vanden Berk, D. E., Richards, G. T., Bauer, A., et al. 2001, AJ, 122, 549
- van de Voort et al. (2012) van de Voort, F., Schaye, J., Altay, G., & Theuns, T. 2012, MNRAS, 421, 2809
- Warren & Møller (1996) Warren, S. J., & Møller, P. 1996, A&A, 311, 25
- Weatherley et al. (2005) Weatherley, S. J., Warren, S. J., Møller, P., et al. 2005, MNRAS, 358, 985
- Weilbacher et al. (2014) Weilbacher, P. M., Streicher, O., Urrutia, T., et al. 2014, Astronomical Data Analysis Software and Systems XXIII, 485, 451
- Whitaker et al. (2014) Whitaker, K. E., Franx, M., Leja, J., et al. 2014, ApJ, 795, 104
- White & Rees (1978) White, S. D. M., & Rees, M. J. 1978, MNRAS, 183, 341
- Wisotzki et al. (2016) Wisotzki, L., Bacon, R., Blaizot, J., et al. 2016, A&A, 587, A98
- Wolfe et al. (2005) Wolfe, A. M., Gawiser, E., & Prochaska, J. X. 2005, ARA&A, 43, 861
- Zafar et al. (2011) Zafar, T., Møller, P., Ledoux, C., et al. 2011, A&A, 532, A51