Emission Lines in the Near-infrared Spectra
of the Infrared Quintuplet
Stars in the Galactic Center
Abstract
We report the detection of a number of emission lines in the 1.0–2.4 m spectra of four of the five bright infrared dust-embedded stars at the center of the Galactic center’s Quintuplet Cluster. Spectroscopy of the central stars of these objects is hampered not only by the large interstellar extinction that obscures all objects in the Galactic center, but also by the large amounts of warm circumstellar dust surrounding each of the five. The pinwheel morphologies of the dust observed previously around two of them are indicative of Wolf-Rayet colliding wind binaries; however, infrared spectra of each of the five have until now revealed only dust continua steeply rising to long wavelengths and absorption lines and bands from interstellar gas and dust. The emission lines detected, from ionized carbon and from helium, are broad and confirm that the objects are dusty late-type carbon Wolf-Rayet stars.
1 Introduction
Most stars in the central few tens of parsecs of the Galaxy are obscured from view by 30 visual magnitudes of extinction. This is the case for almost all of the stars within the three massive stellar clusters there (Figer, 2004). One of the clusters, the Quintuplet, is known for its extraordinary collection of five infrared-bright stars for which the cluster was named (Nagata et al., 1990; Okuda et al., 1990; Glass et al., 1990). While hundreds of other massive stars in the cluster have been classified, the natures of these five objects, the so-called Quintuplet Proper Members (QPMs) have remained mysterious (Figer, McLean, & Morris, 1999). Light from them is not only obscured by the extinction to the Galactic Center (GC), but also by their warm dusty cocoons, which add additional extinction and superimpose bright infrared continuum emission on whatever photospheric or wind emission might faintly leak out from within the cocoons.
Previously published infrared spectra of the Quintuplet stars are essentially featureless, apart from interstellar gas and solid phase absorptions, e.g., due to CO, H, CO2, diffuse interstellar bands, and the 3.4-m hydrocarbon and 9.7-m silicate features, and fine structure and H I recombination line emission from unrelated ionized gas (Okuda et al., 1990; Figer, McLean, & Morris, 1999; Chiar et al, 2000; Moneti et al., 2001; Oka et al., 2005; Liermann et al., 2009; Geballe et al., 2011) along the line of sight. Because of this the QPMs have sometimes been used as telluric infrared spectroscopic standards for Galactic center sources with more “interesting” spectra.
Thus little has been known as to the natures of the QPMs. Figer, McLean, & Morris (1999) and Moneti et al. (2001) proposed that they are dusty late-type Wolf-Rayet (WR) carbon stars (DWCLs). More recently, using speckle imaging techniques in the -band, Tuthill et al. (2006) resolved all five objects. They found that two of the sources have pinwheel-like nebulae, similar to those seen around two other Wolf-Rayet stars in the Galaxy, WR98a and WR104 (Monnier et al., 1999; Tuthill et al., 1999, respectively) and concluded that they are carbon-rich Wolf-Rayet stars (WCs). The two pinwheel sources are GCS3-2 and GCS4, also known as Q2 and Q3, respectively according to the commonly-used nomenclatures for these sources from Nagata et al. (1990) and Moneti et al. (1994).
Late-type WC stars often are surrounded by dust. According to van der Hucht (2001), over half of WC9 types, and perhaps one-third of WC8 types, have dust emission. 111These fractions are confirmed in the uptated, more extended Galactic Wolf Rayet Catalogue http://pacrowther.staff.shef.ac.uk/WRcat/index.php In such systems, the dust phenomenon can be persistent or episodic. In the most widely-accepted model, the pinwheel morphology is produced by warm dust that recedes in a radial direction from a binary system composed of a WR star and a less evolved secondary massive star, e.g. an O-star, whose winds collide. The “Archimedean” spiral shape of the dust emission is a natural result of the rotating site of dust formation that is located on the opposite side of the secondary. Dust forms and propagates radially outward as the stars orbit each other. A similar pattern can be seen in water emitted from a garden hose as the hose is rotated around a central point.
Binarity is key to the pinwheel morphology (Tuthill et al., 1999). WR stars, dusty or not, are often in binary systems. The van der Hucht (2001) catalog suggests that even for the current census of WR stars in the solar neighborhood the estimated binarity percentage of 40% may be too low. It is possible that all DWCLs are necessarily binary as a condition of dust production around them.
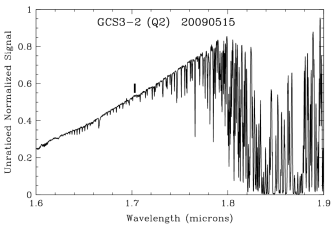
On UT 2009 May 15, during the course of an unrelated observing program, we observed GCS3-2 as a telluric standard and detected a weak and broad emission line centered near 1.70 m (see Fig. 1), presumably leaking out through the cocoon. The detection led us to obtain spectra of the other IR Quintuplet stars in the -band and observe even shorter wavelengths. Although toward shorter wavelengths the extinction due to interstellar dust and dust in the cocoons more severely attenuates any emerging spectrum from the central stars, the dust continua emitted by the cocoons weaken rapidly, as those wavelengths are on the Wien side of the spectral energy distributions (SEDs) of the dust. Because the severe dilution of line equivalent widths by dust emission is a major impediment to detecting lines from these embedded stars at longer infrared wavelengths, we considered that it might be possible to detect lines at shorter infrared wavelengths, despite the much weaker signal, by acquiring high-sensitivity spectra.
2 Observations and Data Reduction
-, -, and -band spectra of the Quintuplet IR stars were obtained at the Frederick C. Gillett Gemini North Telescope at various times between 2009 May and 2012 June (programs GN-2009A-Q-25, GN-2011A-Q-64, and GN-2012A-Q-61), using the facility instruments NIFS (the Near-infrared Integral Field Spectrometer) and GNIRS (the Gemini Near InfraRed Spectrograph) at resolving powers ( = /) ranging from 1,200 to 5,000. For NIFS the telescope was alternately positioned so that the star was centered in the integral field and then that the field was observing nearby blank sky. For GNIRS the standard stare/nod-along slit technique was employed. Early A-type dwarfs served as telluric standards. An observing log is provided in Table 1.
The NIFS spectra were obtained only in the band. The GNIRS spectra were obtained in that instrument’s cross-dispersed mode covering 0.9-2.5 m. Because the flux densities of the Quintuplet stars increase rapidly at longer wavelengths, the long exposures required to maximize the sensitivity in the and bands resulted in the -band spectra saturating that part of the detector array for GCS3-1, GCS3-4, and GCS4. Additional GNIRS spectra of those three stars were obtained using shorter exposure times so that their -band spectra were not saturated. The only cross-dispersed spectrum of GCS3-2 used short exposure times and no signal was detected in the 0.9–1.4 m region.
Data reduction was standard, consisting of extracting spectra from subtracted pairs of nodded frames, spike removal, wavelength calibration utilizing both emission from arc lamps and telluric absorption lines in the astronomical spectra, wavelength-shifting to align the spectra of the Quintuplet stars with those of their telluric standards prior to ratioing them, and correcting for H I absorption lines in the spectra of the telluric standards.
Because the reduced spectra rise steeply to longer wavelengths (see Fig. 1), they are displayed here with their continua normalized. As a result of this, the spectra in Fig. 2 appear increasingly noisy at the shorter wavelengths, where the continua are weakest and the emission lines are most heavily attenuated.
| Object | Date | Band | Instrument | |
|---|---|---|---|---|
| GCS3-2 (Q2) | 20090515 | H | NIFS | 5000 |
| GCS3-2 (Q2) | 20100715 | H | NIFS | 5000 |
| GCS3-2 (Q2) | 20110429 | J,H,K | GNIRS | 1200 |
| GCS3-1 (Q4) | 20110531 | J,H | GNIRS | 1200 |
| GCS3-1 (Q4) | 20110607 | K | GNIRS | 1200 |
| GCS3-4 (Q1) | 20110622 | K | GNIRS | 1200 |
| GCS3-3 (Q9) | 20110703 | J,H | GNIRS | 1200 |
| GCS3-4 (Q1) | 20110705 | J,H | GNIRS | 1200 |
| GCS4 (Q3) | 20120604 | J,H,K | GNIRS | 4000 |
3 Results
3.1 Detected lines
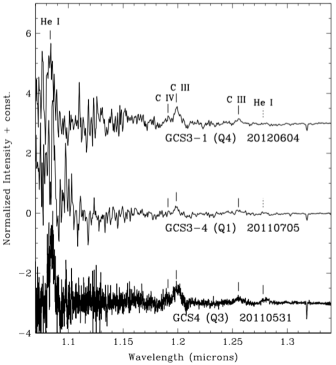
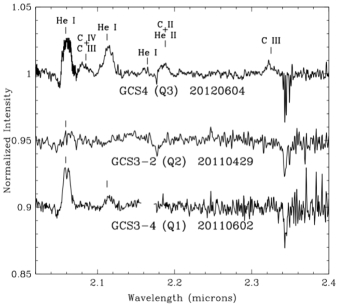
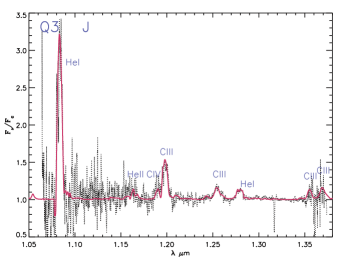
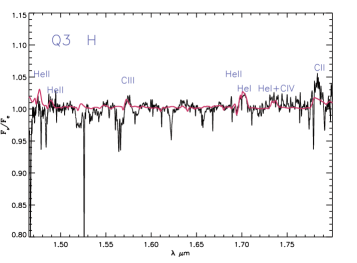
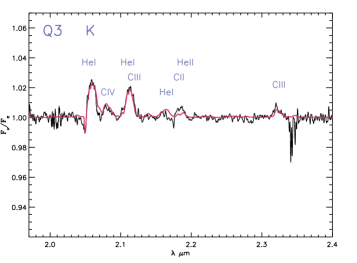
Emission lines were detected in spectra of four of the five QPMs (GCS3-1, GCS3-2, GCS3-4 and GCS4) as shown in Figs. 2, 3, and 4. For three of the QPMs lines were detected in the and bands, where previous lower sensitivity observations found none (Figer, McLean, & Morris, 1999). The spectra of GCS3-3 (Q9) were devoid of emission lines, perhaps due to a more opaque dust shell, lower dust temperatures, and or variability, and are not shown. Line identifications (mainly from Eenens, Williams, & Wade 1991 and Crowther et al. 2006) are given in Table 2. In some cases the emission features may be blends of two or more lines. Individual lines are well-resolved even at the lowest resolving powers and have full widths at half maxumum of 1,500–3,000 km s-1. The singlet 2P-2S lines of He I at 2.059 m in both GCS4 and GCS3-4 have P Cygni profiles. Emission is present in the corresponding triplet transition at 1.083 m, but no P Cygni absorptions were detected; however, the signal-to-noise ratios (S/Ns) on the continua near that wavelength are very low.
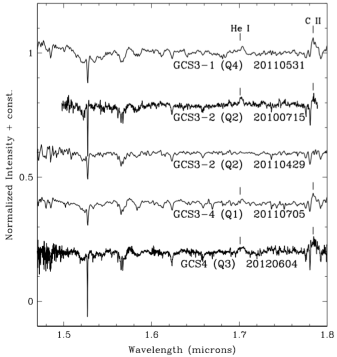
Numerous absorption features are also present in the spectra of all five stars and are also listed in Table 2. Most of these are already known diffuse interstellar bands (DIBs) (Joblin et al., 1990; Geballe et al., 2011), and apart from one DIB are in the band. Two DIBs, at 1.485 m and 1.585 m are reported here for the first time. The latter is easily seen in all five spectra in Fig. 3; the former is most clearly present in the spectra of GCS3-1 and GCS4. In the band, absorption lines due to overtone transitions of CO in low rotational levels are present near 2.35 m (Fig. 4). These are known to arise in foreground spiral arms (Oka et al., 2005).
Of the QPMs with emission lines, the richest spectrum in terms of number of detected lines is that of GCS4; the poorest is GCS3-2 (note, however, that there is no high sensitivity -band spectrum of the latter). Carbon lines from the ionic species C II and C III are generally prominent in GCS3-1, GCS3-4 and GCS4. Weak C IV line emission at 1.191 m also can be seen in all three. Several He I lines are also present in these stars. The He I 1.083 m has high equivalent widths in all three; longer wavelength He I lines (at 1.278 m 1.701 m and 2.059 m) have much lower equivalent widths because of their relative weaknesses, higher dilution by the continua of their dust cocoons, or both. He II lines if present, are very weak and blended with C III and C II transitions, making their contributions uncertain.
| Species | Wavelength (vac. m) | Notes |
|---|---|---|
| He I | 1.083 | em: GCS3-1, 3-4, 4 |
| C IV | 1.191 | em: GCS3-1, 3-4, 4 |
| C III | 1.198-1.199 | em: GCS3-1, 3-4, 4 |
| C III | 1.253-1.258 | em: GCS3-1, 3-4, 4 |
| He I | 1.278 | em: GCS3-4, 4 |
| DIB | 1.318 | interstellar |
| DIB | 1.485 | interstellar (new) |
| DIB | 1.520 | interstellar |
| DIB | 1.527 | interstellar |
| DIBs | 1.561.57 | interstellar |
| DIB | 1.584 | interstellar (new) |
| DIB | 1.623 | interstellar |
| DIBs | 1.6571.660 | interstellar |
| He I | 1.701 | em: GCS3-1, 3-2, 3-4, 4 |
| DIBs | 1.771.80 | interstellar |
| C II | 1.784-1.786 | em: GCS3-1, 3-4, 4 |
| He I | 2.059 | em: GCS3-2, 3-4, 4 |
| C IV | 2.071-2.080 | em: GCS4 |
| C III | 2.085 | em: GCS4 |
| He I | 2.113 | em: GCS3-4, 4 |
| C III | 2.114 | em: GCS4 |
| He I | 2.165 | em: GCS4 |
| C II | 2.188 | em: GCS4 |
| He II | 2.189 | em: GCS4 |
| C III | 2.325 | em: GCS4 |
| CO low | 2.34-2.36 | interstellar |
3.2 Spectral types
The very broad emission lines observed in four of the QPMs are generally consistent with WR classifications. However, the superimposed dust emission in the spectra of the QPMs reduces the equivalent widths (EWs) of the detected lines by wavelength-dependent and widely varying amounts, and does not allow the typical analysis in which EWs of diagnostic lines in different wavebands are used to establish precise spectral types. To estimate the spectral types of the QPMs, we utilized line intensity ratios of transitions that are close in wavelength and are thus only slightly affected by assumptions about dilution by dust emission. For GCS3-1, GCS3-2, and GCS3-4 we used the C IV 1.191 m to C III 1.198–1.199 m and the C IV 1.737 m (not detected) to C II 1.784–1.786 m line ratios. For GCS4 we also utilized the C IV 2.071–2.084 m to C III 2.085 m and 2.114 m ratios (the latter contributing approximately two-thirds of the flux to the observed blend with He I 2.113 m).
We find that the spectra of the four QPMs resemble those of late-type WC stars (e.g. Eenens, Williams, & Wade, 1991; Crowther et al., 2006). The relative weakness, or complete absence, of C IV at 1.191 m and 1.736 m in GCS3-1, GCS3-4, and GCS4, and of the latter line in GCS3-2, suggest that the spectral type of each is WC9 or later. All of these ratios are significantly less than one, similar to those of WC9 stars, and are much lower than the ratios for WC8 stars (see Table 4 in Crowther et al., 2006). Therefore, we assign the WC9d spectral type to each of the four QPMs with emission lines.
3.3 Variability of GCS3-2 (Q2)
Lines of He I and C II are present in the -band spectrum of GCS3-2 obtained in 2010, but are absent in the 2011 -band spectrum (Fig. 3). The singlet 2P–2S line of helium is weakly present in 2011 (Fig. 4), but no -band spectrum was obtained in 2010. Tuthill et al. (2006) have shown that GCS3-2 and GCS4 are dust-producing colliding wind binaries. As dust production varies with orbital phase, we suggest that the 2011 observations of GCS3-2 coincided with increased dust production, leading to stronger continuum emission as well as increased obscuration of the line-emitting region.
4 Modeling of CGS4 (Q3)
4.1 Previous models
Previous characterizations of the QPMs (Figer, McLean, & Morris, 1999; Moneti et al., 2001; Tuthill et al., 2006; Dong et al., 2012; Hankins et al., 2016) have been hampered by the lack of detected stellar emission lines at near- and mid-infrared (NIR and MIR) wavelengths (Figer, McLean, & Morris, 1999; Moneti et al., 2001). Only the properties of the dust shells, such as temperature and luminosity, and hints as to the properties of the central stars have been derived, by applying either blackbody/greybody fits to existing photometry (Figer, McLean, & Morris, 1999; Dong et al., 2012), or by more sophisticated dust models (Moneti et al., 2001; Tuthill et al., 2006; Hankins et al., 2016), and by assuming an extinction law and guessing the contributions of stellar flux in the photometric wavebands. These assumptions, together with the spectral regions fitted, have yielded a range of possible dust temperatures and luminosities, but only vague constraints on stellar properties.
For GCS4, Figer, McLean, & Morris (1999) obtained = 1055 K and = 4.84 from fits to the NIR photometry using = 2.7 mag. The lack of line emission in their -band spectra of the QPMs led them to suggest that the QPMs might be completely enshrouded in dust. Moneti et al. (2001) fitted the 4-17 m SED using = 3.3 mag and found = 700 K and = 4.6. Similarly to Figer, McLean, & Morris (1999) they concluded that for the -band spectra observed by those authors to be featureless, the ratio of dust shell luminosity to stellar luminosity would need to be higher than in the most extreme DWCLs known. On the other hand, Dong et al. (2012) obtained = 644 K from NIR fits with = 3.4 mag, assuming equal flux contributions at 2.5 m from the stellar source and the dust emission. Finally, Hankins et al. (2016) recently derived = 750 K and =4.9 fitting the NIR (2MASS) and MIR (Spitzer/IRAC and SOFIA/FORCAST) photometry, and requiring = 1.8 mag, a value that is in significant disagreement with the value of 3.1 0.5 mag found by Liermann et al. (2010) for the Quintuplet Cluster.
4.2 Current model of GCS4
The spectroscopy reported here provides, for the first time, the possibility of utilizing the diluted spectra of the internal stellar source(s), combined with the photometry, to much more fully constrain these systems and characterize the embedded stars. We have proceeded to model GCS4, the QPM for which the best data were obtained, assuming that the system is described by a WC + OB binary and a dust shell (see Clark et al., 2011). As in previous analyses of massive stars in the Quintuplet Cluster (Najarro et al., 2009), we adopt a distance of 8 kpc (Reid, 1993; Schödel et al., 2010; Gillessen et al., 2013).
The normalized spectra were modeled at each wavelength by adding the individual contributions to the total flux from the above three components and dividing their sum by the sum of their continua. We included the photometry out to 5 m (well beyond the longest wavelength of these spectra). The full system is characterized by the total shell luminosity (out to that wavelength), the flux ratio of the summed stellar spectra to the dust shell at a given reference wavelength (we choose m), the flux ratio of the OB-star to the WC star at the reference wavelength, and the total (interstellar and circumstellar) extinction. For the latter we considered two different extinction laws. The first was derived by Moneti et al. (2001) and is tailored to the Quintuplet Cluster. The second was obtained by Nishiyama et al. (2006) using the red clump stars in the Galactic bulge. These extinction laws differ significantly in the NIR region, where the Nishiyama et al. (2006) curve is much steeper. We found, however, that the two extinction laws yielded equally good fits if the values were adjusted independently, although the value of , 2.54 mag, derived using the Nishiyama et al. (2006) law, may be unacceptably low, especially in that it includes the contribution from the dust shell. Note also that the extinction law in the carbon-rich dusty shell is probably different from that of the interstellar dust in the 1–5 m region, but that the shell provides only a small fraction of the total extinction, so the effect of using single extinction laws for both components is small.
We adopted the NIR photometry of Figer, McLean, & Morris (1999) and the MIR SWS 4-17m spectrum presented by Moneti et al. (2001), augmented with Spitzer/IRAC data. Given the photometric variability of these systems (Glass et al. 1999 found peak-to-peak variations at of mag), the lack of simultaneous (spectro)-photometry over the modeled bands hinders an accurate determination of the luminosity.
To constrain the WC star properties, we computed a grid of cmfgen (Hillier & Miller, 1998) WC models and fitted the above described carbon line ratios which, together with the C III 1.253-1.258 m)/He I 1.278 ratio, fixes the values of the stellar temperature (T∗) and mass loss rate () pairs as well as the C/He ratio. We also used the observed ratios of He I and He II lines in each waveband as a secondary ionization equilibrium constraint on the stellar temperature. The P Cygni profile of the He I 2.059 m line serves as a constraint on the stellar wind terminal velocity, .
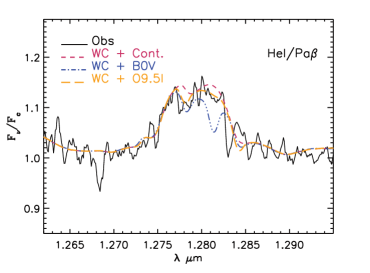
To characterize the OB component of the system, we selected models from our own cmfgen grid of OB stars to investigate how stars of different spectral types from early O to early B and from dwarfs to supergiants could leave their spectral imprints on the observed profiles of the WC star. If present, we expect the hydrogen and/or helium lines of the OB companion to appear in the form of relatively narrow absorption dips on top of the broad emission lines of the WC star. From the point of view of the overall system, shorter wavelengths should be more optimal for detecting the signature of an OB star, as the relative contribution from that star will be larger and hence its spectral lines will be less diluted. However, the strong extinction dramatically lowers the S/N below 1.20 and hampers the detection of the OB features. On the other hand, at longer wavelengths () where a high S/N is achieved, the greater contribution of dust and the increasing WC/O flux ratio (due to wind bound-free and free-free emission of the WC star) drastically attenuate the OB line strengths. Thus, within our data set, we found that the best OB diagnostic is provided by the He I/Pa 1.28 feature and, to a lesser extent, by the He I line and H I lines in the band. This is shown at 1.28 m in the model spectra in Fig. 5, where the imprints of a late O supergiant and a B0V star are clearly visible on top of the broad He I/Pa emission line from the WC star.
Once the main properties of the WC+OB system were derived, we computed a set of dust shell SEDs with different temperatures to fit the photometric data out to 5 m. We first used the approach of Dong et al. (2012) and Moneti et al. (2001), assuming a diluted blackbody with a emissivity. However, we found (see also Moneti et al., 2001) that this characterization produced SEDs that are too narrow when compared to the observations. We then opted for simple blackbody emission, which yielded broader SEDs and quite similar results to those obtained from more complex dust emission models (e.g. Moneti et al., 2001).
The selected WC, OB star and dust shell models were then scaled to reproduce the diluted -, - and -band profiles. The total fluxes were combined into a single SED, which was reddened and rescaled to fit the observed photometry. The total luminosity of each component was then determined.
5 Results of Modeling and Discussion
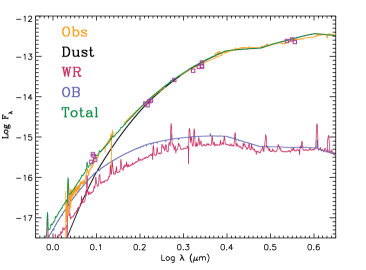
5.1 Derived physical properties
Table 3 lists the derived properties of GCS4. Those that depend on the assumed extinction law are displayed separately for each of the two laws. Figure 6 shows the excellent fits of the models to the observed -, -, and -band diluted spectra while Fig. 7 displays the comparison between the observed spectrophotometry and the SED of the reddened WC+OB+dust shell. The individual contribution of each component is also plotted. From Fig. 7 it is clear that the dust shell dominates the total flux at wavelengths as short as the band, while its contribution in the band is similar to the WC+OB system. At the reference wavelength, 1.20 m, we derive Fshell/FWC=1.6 and Fshell/FOB=0.6. 222We also found that the dust emission can be fit well by a power law relation, i.e., F. If we further assume that three-fourths of the flux at 1.2 m is attributable to this thermal emission, the resulting line strengths and ratios are also matched.
Almost all of the strong carbon and helium emission lines are well reproduced by the model (see Fig. 6), the only notable exception being the C II feature at 1.784-1.786 m, which is commonly underestimated by the models, (e.g., Clark et al., 2011). This doublet is very sensitive to blanketing as its upper levels are fed through the 2s22p2P-2s24d2D resonance lines at . There are a few other more minor discrepancies. The slight mismatch in the He II 1.476 m line is caused by a combination of the DIBs and the position of the line at the blue-edge of the H-band which hinders a proper normalization. The small discrepancy present at He I 2.164m could be due to the residuals from the Brγ removal of the standard star, while the weaker m feature produced by the models (a blend of the He II m line with the C II m n=10 to n=7 transitions) is probably caused by the models underestimating the latter.
The ratio of the close lying C IV and C III lines in the and bands fixes the pair values given by the WC stellar temperature T∗ (defined at a Rosseland opacity, of 10) and the so-called “transformed radius” RT (where is in solar radii, is in km s-1 , is in Myr-1, and is the clumping value; Schmutz et al., 1989).
We derive T∗ = 49.3 kK and RT = 4.2 for the WC star. We find that = 1250 km s-1 yields an excellent fit to the He I P Cygni-profiles at 1.701 m and 2.059 m and satisfactorily matches the observed widths of the emission lines as well as the shapes of the line blends. Our value is roughly 30% lower than the 1800 kms suggested by Tuthill et al. (2006), who fit an Archimedian spiral model. Depending on the extinction law applied (Moneti et al. or Nishiyama et al.), we obtain different values of R∗ yielding respective values of L∗ and (we assume a clumping value, =0.1) as displayed in Table 3. Finally, we derive a mixture of 20% carbon and 78% helium (mass fraction) at the stellar surface.
The OB companion can only be poorly constrained. Making use of the observed shape of the He I/Pa 1.28- complex (see Fig. 5) and noting that the OB star is roughly 2.5 times brighter than the WC in the continuum at this wavelength, we may discard a mid-O to mid-B dwarf companion as its Pa 1.28- line would be clearly detectable. Hence, the presence of a supergiant with a strong enough wind to significantly fill the absorption profile is favored. Further, if we assume that the dip at 1.277m is due to He I, then the supergiant cannot be too hot. We find that stars with spectral types between O8If and B0Ia can match the observed He I/Pa 1.28- blend and that an excellent fit is obtained for an O9.5Ia star such as Cam (Najarro et al., 2011). The lack of precise information on the properties of the binary system prevents us from applying any phased radial velocity correction to the OB companion in Fig. 5. Nevertheless, given the low inclination of the system (Tuthill et al., 2006) we expect a rather small projected radial velocity shift from the orbital motion.
| Extinction law | Property | Value |
|---|---|---|
| Tshell (K) | 1000 | |
| T∗WC (kK)a | 49.3 | |
| XCWCb | 0.20 | |
| WC (km s-1) | 1250 | |
| Lshell/L∗c | 0.17 | |
| Moneti et al. (2001): | ||
| 3.30 | ||
| log Lshell/L⊙ | 5.22 | |
| log LWC/L⊙ | 5.44 | |
| log LOB/L⊙d | 5.84 | |
| R∗WC/R⊙a | 7.15 | |
| Log (/) (Myr-1)e | -3.95 | |
| Nishiyama et al. (2006): | ||
| 2.54 | ||
| log Lshell/L⊙ | 4.87 | |
| log LWC/L⊙ | 5.09 | |
| log LOB/L⊙d | 5.49 | |
| R∗WC/R⊙a | 4.78 | |
| log (/) (Myr-1)e | -4.21 |
Note. — a: Values at =10. b: Mass fraction. c: WC+OB luminosity. d: Assuming a O9.5Ia (see text). e: Models assume a clumping value f=0.1, so the true mass-loss rates will be 0.5 dex lower.
The derived temperature of = 1000 100 K for the dust shell agrees very well with the one obtained by Figer, McLean, & Morris (1999) from NIR fitting and differs considerably from the 640-750 K values derived by Moneti et al. (2001), Dong et al. (2012), and Hankins et al. (2016). The combination of the SED and the diluted spectrum is fundamental to estimating the uncertainty in . For high dust temperatures, e.g. 1100 K, an acceptable fit to the photometry is still possible by increasing the interstellar extinction and doubling the flux ratio of the shell to the WC star, Fshell/FWC. However, the model then clearly underestimates the observed flux longwards of 2.4 m and the spectral lines in the shorter wavelength portion of the band become unacceptably strong. Imposing a lower dust temperature, e.g. 700 K, as derived by other studies makes it impossible to simultaneously fit the NIR SED and the normalized diluted spectra. Besides, an unacceptably large vale of FOB/FWC ( 4) is required, and our models show that the stellar features from the OB companion would have higher EWs in the band than are observed (see below). Moreover, although a reasonable fit to the SED is obtained up to 20m, a very low value of is obtained and the -band photometry is overestimated by roughly two magnitudes independent of the extinction law used.
Although the model in Table 3 is a very good fit for m, it underestimates the observed SED at longer wavelengths. A better fit at m, would require the presence of a cooler component, which would have only a modest effect on the values in the table. Indeed, the use of a single temperature for the dust shell modeling for the Quintuplet members was questioned by Tuthill et al. (2006), who resolved GCS4 at 2.21 and 3.08 m. A larger increase in size between 2.21 and 3.08 m (factor of 2) was found for this object than for other pinwheel systems in the Galaxy (factor of 1.4, Monnier et al., 2007) and was attributed to a range of temperatures contributing to the 2–3-m emission, which would cause a flatter thermal profile from the GCS4 dust shell.
5.2 Comparison with previous studies
Here we discuss the discrepancies between our results for GCS4 and those obtained by Moneti et al. (2001), Dong et al. (2012) and Hankins et al. (2016). The model fits, with 700 K presented by Moneti et al. (2001) (their Fig. 11), tailored to the 4–17 m observations, clearly underestimate the NIR bands and imply the need for a second, hotter dust component. Dong et al. (2012) fit model SEDs to the NIR photometry for all five of the QPMs. They assumed, in each case, that the -band flux is heavily dominated by flux from the star and that the -band flux is roughly split evenly between contributions from the star and the dust (see their Figure 4). This assumption is untenable as it would produce high equivalent width emission lines from the WC star in the band, as the stellar lines would then be diluted just by a factor of 2 (compared to the factor of 100 observed in GCS4).
Hankins et al. (2016), who reported mid-infrared photometry of the QPMs, extended their derived SEDs to the near-infrared data using DUSTY models, assuming a spherical dust shell illuminated by a central source, which they chose to be a 40,000 K blackbody with a Rayleigh-Jeans like behavior in the NIR. They preferred a 75050 K blackbody for GCS4, noting the good fit between such a model and the data, although the fit at the shortest wavelengths in the near-infrared is not as good as at longer wavelengths. However, their fit requires = 1.8 mag for the interstellar extinction, which is roughly 0.6 mag below the lowest estimates presented in the literature for the Quintuplet cluster. We adopted the above temperatures and extinction derived by Hankins et al. (2016) and obtained a similar quality fit to the full 1.25–37 m photometry. However, we failed to reproduce the observed normalized spectra. At short wavelengths the model severely overestimates the observed line strengths while the lines in the model -band spectra are much too weak when compared to the observations. Although the disagreement could be considerably reduced by invoking a second hotter dust component, the mismatch again emphasizes the necessity of combining the observed diluted spectra with the photometry to more tightly constrain the properties of the QPMs.
6 The QPMs vs related Pinwheel and WC9d objects.
Our derived properties for GCS4 can be compared to those of well studied Pinwheel systems such as WR104 (Tuthill et al., 1999; Harries et al., 2004; Tuthill et al., 2008). The latter is composed of a WC9d + B0.5V binary (Crowther, 1997) with a period of 241 days (Tuthill et al., 2008). The binary system was modeled by Crowther (1997) assuming a flux ratio OB:WC = 2 in the band with the WC9 having almost identical properties (T kK, RT=4.0 and =1220 km s-1) to the ones we have derived here for GCS4 (see Table 3). Interestingly, our derived value for the dust temperature in GCS4 (T=1000 K) agrees very well with the azimuthally-averaged temperature in the inner regions as inferred from the model by Harries et al. (2004, their Fig. 5). The systems’ luminosities differ significantly (log ), assuming the distance of 1.6 kpc adopted by Crowther (1997) and by Harries et al. (2004). However, this value was revised up to 2.6 kpc by Tuthill et al. (2008) after combining the measured physical speed of the dust plume with the apparent angular velocity. The revised distance results in log L/L⊙=5.5 for the binary system (e.g. Monnier et al., 2007), which agrees very well with the one we obtain for GCS4 assuming the Nishiyama et al. (2006) extinction law, and emphasizes the importance of an accurate knowledge of the distance as well as a good estimate of the extinction for these objects. Indeed the lack of reliable distance estimates for Galactic WC9 stars has led to some studies assigning an absolute magnitude for these stars. Some have adopted (as suggested by van der Hucht, 2001), while brighter magnitudes () have been used for the WC9 star in the systematic study of WC Galactic stars by Sander et al. (2012), yielding average luminosities of L/L⊙ = 5.2 for the WC9d stars.333We expect Gaia DR2 to provide a definite Mv calibration. Interestingly, this value lies in between our two estimates of the luminosity of the GCS4 WC9 star (Table 3). We may as well use luminosity calibrations as a function of spectral type (e.g., Martins et al., 2005) for the OB companion to discern the luminosity class of the latter and/or the appropriate extinction law. Such a method may prove efficient for systems with both a solid determination of the companion’s spectral type and a relatively low observed luminosity scatter (e.g. late O and early B dwarfs). However, in the case of WR104, where a B0.5V companion has been assumed (Crowther, 1997; Harries et al., 2004), its inferred value of log L/L⊙ 5.3 (at 2.6kpc) would imply a drastic revision of its spectral type and/or luminosity class (e.g. either a O6V or a B0.5I would be required). In the case of GCS4, the large scatter in luminosities observed within the O9.5Ia spectral types does not allow us to differentiate between the two extinction laws. The value log L/L⊙=5.84 for the Moneti et al. (2001) law coincides with the luminosity of Cam, one of the canonical O95.Ia stars (Najarro et al., 2011) while the log L/L⊙ 5.49 solution for the Nishiyama et al. (2006) extinction law also matches perfectly the Martins et al. (2005) calibrated luminosity value for a O9.5I star.
The SEDs of the QPMs closely resemble that of W239, a dusty WC star in Westerlund 1 (Crowther et al., 2006; Clark et al., 2011). Despite W239 having a much shorter period days vs days for GCS4 (Glass et al., 1999), the spectral similarities between the two systems are striking. Clark et al. (2011) fit the SED of the W239 system (their Figure 5) with contributions from a WC+O binary plus a 1300 K greybody (slightly hotter than GCS4). Assuming that the O dwarf companion and the WC9 star have equal fluxes at , they obtain a -band flux ratio of 2:1 between the binary and the dust. While this ratio is similar to the one we derive for GCS4, the relative contribution of each of the binary components differs considerably, with the O9.5Ia contributing of the -band binary flux in GCS4 and the W239 O dwarf with . This result is consistent with the luminosity classes derived for each of the systems.
The different dust temperatures and WC9/OB flux ratios of the two systems are nicely traced by the observed dilution of the spectral features in the different bands. While both systems show nearly identical equivalent widths in the -band, e.g., 35 Å for the C III line at 1.20 m for GCS4 and W239, in the band, the spectral features of the QPMs are more diluted. This is clearly tracked by the equivalent widths for the He I 1.701m lines (2 Å and 5 Å for GCS4 and W239, respectively), suggesting that the dust temperature must be lower for GCS4 than for W239, as found by our modeling (see Table 3). As confirmation, note that the He I 2.11 m line peak in the -band spectrum of W239 in Clark et al. (2011)(Fig. 6, bottom) is higher above the continuum than in GCS4 (see Fig.6) and is basically absent for the rest of the QPMs, again suggesting a very low ratio of light from the stellar system to that from the dust. The stellar properties of the WC9 component in W239 are very close to those derived for GCS4 when applying the Nishiyama et al. (2006) extinction law. Although these results seem to favor the extinction law of Nishiyama et al. (2006) vs. that of Moneti et al. (2001), we cannot exclude the latter until the OB component, and hence the full system, is better constrained.
7 Conclusion
While the QPMs were first noted for their remarkable infrared SEDs, their characteristics, and presence in the Quintuplet cluster, are easy to understand when considering that they are members of a massive cluster of stars at an age when some of the O-stars have evolved away from the main sequence. They have average properties for dusty WC stars, including their emission lines, colors, and brightnesses. Their inferred luminosities, temperatures, dust shells, and binary natures also are typical of dusty WC9 stars. Combined with previous observations of pinwheels that surround two of the stars (Tuthill et al., 2006), we conclude that all five of the QPMs are dusty WC9 stars, as initially suggested by Figer, McLean, & Morris (1999).
References
- Chiar et al (2000) Chiar, J. E., Tielens, A. G. G. M., Whittet, D. C. B., Schutte, W. A., Boogert, A. C. A., Lutz, D., van Dishoeck, E. F., and Bernstein, M. P. 2000, ApJ, 537, 749
- Clark et al. (2011) Clark, J. S., Ritchie, B. W., Negueruela, I., et al. 2011, A&A, 531, A28
- Crowther (1997) Crowther, P. A. 1997, MNRAS, 290, L59
- Crowther et al. (2006) Crowther, P. A., Hadfield, L. J., Clark, J. S., Neguerela, I., & Vacca, W. D. 2006, MNRAS, 372, 1407
- Dong et al. (2012) Dong, H., Wang, Q. D., & Morris, M. R. 2012, MNRAS, 425, 884
- Eenens, Williams, & Wade (1991) Eenens, P. R. J., Williams, P. M, & Wade, R. 1991, MNRAS, 252, 300
- Figer (2004) Figer, D. F. 2004, The Formation and Evolution of Massive Young Star Clusters, 322, 49
- Figer, McLean, & Morris (1999) Figer, D. F., McLean, I. S., & Morris, M. 1999, ApJ, 514, 202
- Geballe et al. (2011) Geballe, T. R., Najarro, F., Figer, D. F., Schlegelmilch, B. W., & de la Fuente, D. 2011, Nature, 479, 200
- Gillessen et al. (2013) Gillessen, S., Eisenhauer, F., Fritz, T. K., et al. 2013, IAUS, Advancing the Physics of Cosmic Distances, 289, 29
- Glass et al. (1990) Glass, I. S., Moneti, A., & Moorwood, A. F. M. 1990, MNRAS, 242, 55P
- Glass et al. (1999) Glass, I. S., Matsumoto, S., Carter, B. S., & Sekiguchi, K. 1999, MNRAS, 304, L10
- Hankins et al. (2016) Hankins, M. J., Lau, R. M., Morris, M. R., et al. 2016, ApJ, 827, 136
- Harries et al. (2004) Harries, T. J., Monnier, J. D., Symington, N. H., & Kurosawa, R. 2004, MNRAS, 350, 565
- Hillier & Miller (1998) Hillier, D. J. & Miller, D. L. 1998, ApJ, 496, 407
- Joblin et al. (1990) Joblin, C., Maillard, J. P., D’Hendecourt, L. & Leger, A. 1990, Nature 346, 729-731
- Liermann et al. (2009) Liermann, A., Hamann, W.-R., & Oskinova, L. M. 2009, A&A, 494, 1137
- Liermann et al. (2010) Liermann, A., Hamann, W.-R., Oskinova, L. M., Todt, H., & Butler, K. 2010, A&A, 2010, A82
- Martins et al. (2005) Martins, F., Schaerer, D., & Hillier, D. J. 2005, A&A, 436, 1049
- Moneti et al. (2001) Moneti, A., Stolovy, S., Blommaert, J. A. D. L., Figer, D. F., & Najarro, F. 2001, A&A, 366, 106
- Moneti et al. (1994) Moneti, A., Glass, I. S., & Moorwood, A. F. M. 1994, MNRAS, 268, 194
- Monnier et al. (1999) Monnier, J. D., Tuthill, P. G., & Danchi, W. C. 1999, ApJ, 525, L97
- Monnier et al. (2007) Monnier, J. D., Tuthill, P. G., Danchi, W. C., Murphy, N., & Harries, T. J. 2007, ApJ, 655, 1033
- Nagata et al. (1990) Nagata, T., Woodward, C. E., Shure, M., Pipher, J. L., & Okuda, H. 1990, ApJ, 351, 83
- Najarro et al. (2009) Najarro, F., Figer, D. F., Hillier, D. J., Geballe, T. R., & Kudritzki, R. P. 2009, ApJ, 691, 1816
- Najarro et al. (2011) Najarro, F., Hanson, M. M., & Puls, J. 2011, A&A, 535, A32
- Nishiyama et al. (2006) Nishiyama, S., Nagata, T., Kusakabe, N., et al. 2006, ApJ, 638, 839
- Oka et al. (2005) Oka, T., Geballe, T. R., Goto, M., Usuda, T., & McCall, B. J. 2005, ApJ, 632, 882
- Okuda et al. (1990) Okuda, H., et al. 1990, ApJ, 351, 89
- Reid (1993) Reid, M. J. 1993, ARA&A, 31, 345
- Sander et al. (2012) Sander, A., Hamann, W.-R., & Todt, H. 2012, A&A, 540, A144
- Schmutz et al. (1989) Schmutz, W., Hamman, W-R., Wessolowski, U. 1989, A&A, 210, 236
- Schödel et al. (2010) Schödel, R., Najarro, F., Muzic, K., & Eckart, A. 2010, A&A, 511, A18
- Tuthill et al. (1999) Tuthill, P. G., Monnier, J. D., & Danchi, W. C. 1999, Nature, 398, 487
- Tuthill et al. (2006) Tuthill, P., Monnier, J., Tanner, A., Figer, D., Ghez, A., & Danchi, W. 2006, Science, 313, 935
- Tuthill et al. (2008) Tuthill, P. G., Monnier, J. D., Lawrance, N., et al. 2008, ApJ, 675, 698-710
- van der Hucht (2001) van der Hucht, K. A. 2001, New Astronomy Reviews, 45, 135