11email: salinas@strw.leidenuniv.nl 22institutetext: Anton Pannekoek Institute for Astronomy, University of Amsterdam, Science Park 904, 1098 XH, Amsterdam, The Netherlands 33institutetext: Institute for Astronomy, University of Hawaii, 2680 Woodlawn Dr., Honolulu, HI 96826, USA 44institutetext: Department of Astronomy, Harvard University, Cambridge, MA 02138, USA
DCO+, DCN and N2D+ reveal three different deuteration regimes in the disk around the Herbig Ae star HD163296
Abstract
Context. Deuterium fractionation has been used to study the thermal history of pre-stellar environments. Their formation pathways trace different regions of the disk and may shed light into the disk’s physical structure, including locations of important features for planetary formation.
Aims. We aim to constrain the radial extent of main deuterated species; we are particularly interested in spatially characterizing the high and low temperature pathways for enhancing deuteration of these species.
Methods. We observed the disk surrounding the Herbig Ae star HD 163296 using ALMA in Band 6 and obtained resolved spectral imaging data of DCO+ (=3–2), DCN (=3–2) and N2D+ (=3–2) with synthesized beam sizes of 053 042, 053 042 and 050 039 respectively. We adopt a physical model of the disk from the literature and use the 3D radiative transfer code LIME to estimate an excitation temperature profile for our detected lines. We model the radial emission profiles of DCO+, DCN and N2D+, assuming their emission is optically thin, using a parametric model of their abundances and our excitation temperature estimates.
Results. DCO+ can be described by a three-region model, with constant-abundance rings centered at 70 AU, 150 AU and 260 AU. The DCN radial profile peaks at about 60 AU and N2D+ is seen in a ring at 160 AU. Simple models of both molecules using constant abundances reproduce the data. Assuming reasonable average excitation temperatures for the whole disk, their disk-averaged column densities (and deuterium fractionation ratios) are 1.6–2.6 cm-2 (0.04–0.07), 2.9–5.2 cm-2 (0.02) and 1.6–2.5 cm-2 (0.34–0.45) for DCO+, DCN and N2D+, respectively.
Conclusions. Our simple best-fit models show a correlation between the radial location of the first two rings in DCO+ and the DCN and N2D+ abundance distributions that can be interpreted as the high and low temperature deuteration pathways regimes. The origin of the third DCO+ ring at 260 AU is unknown but may be due to a local decrease of ultraviolet opacity allowing the photodesorption of CO or due to thermal desorption of CO as a consequence of radial drift and settlement of dust grains. The derived deuterium fractionation values agree with previous estimates of 0.05 for DCO+/HCO+ and 0.02 for DCN/HCN in HD163296, and 0.3-0.5 for N2D+/N2H+ in AS 209, a T Tauri disk. The high N2D+/N2H+ confirms N2D+ as a good candidate for tracing ionization in the cold outer disk.
Key Words.:
Astrochemistry – Protoplanetary disks – stars:individual:HD163296 – submillimeter:stars1 Introduction
So far, more than 30 deuterated species have been detected towards pre-stellar cores, and solar system bodies (Ceccarelli et al., 2007; Mumma & Charnley, 2011). Their deuterium fractionation, usually higher than the D/H cosmic ratio of 10-5 (Vidal-Madjar, 1991), is used to infer their thermal history, and in the case of solar system bodies, their location within the solar nebula at the time of formation. The amount of detections of deuterated species towards protoplanetary disks is not as high as in proto-stellar environments. DCO+ has been detected in both T Tauri disks (Guilloteau et al., 2006; Öberg et al., 2010, 2011, 2015; van Dishoeck et al., 2003; Huang et al., 2017) and in the Herbig Ae disks HD163296 and MWC 480 (Qi et al., 2015; Mathews et al., 2013; Huang et al., 2017). DCN has been observed towards six different disks by Huang et al. (2017) in addition to being previously observed towards TW Hya (Qi et al., 2008) and LkCa15 (Öberg et al., 2010). N2D+ has only been recently observed in the disk around the T Tauri star AS 209 (Huang & Öberg, 2015).
The massive (0.089 M⊙) and extended gas-rich disk around HD163296 is inclined at . Its proximity (122 pc) makes it an excellent laboratory to study the spatial location of the different deuteration regimes in protoplanetary disks (Qi et al., 2011; Mathews et al., 2013; Perryman et al., 1997). DCO+ emission was first seen in a ring towards the disk around HD163296 and suggested as a tracer of the CO snowline by Mathews et al. (2013). It was later observed that the emission extended further inwards past the CO snowline at 90 AU traced by N2H+ (Qi et al., 2015). ALMA cycle 2 observations towards HD163296 of DCO+, DCN and N2D+ were presented by Yen et al. (2016) using a new stacking technique to enhance the signal to noise (S/N) of the radial profile confirming the extent of DCO+. The observational study of Huang et al. (2017) found that both DCO+ and H13CO+ show an emission break around 200 AU.
ALMA continuum emission in Band 6 of HD163296 shows a rich structure of rings and depressions extending up to 230 AU (Isella et al., 2016; Zhang et al., 2016). This substructure could have an impact on the distribution and chemistry of certain species (See sec. 5). The gas, traced by C18O, extends up to 360 AU well beyond the extent of the millimeter continuum emission and scattered light has been detected up to 500 AU (Garufi et al., 2014; Wisniewski et al., 2008). By contrasting the observations of key deuterated species to a physical model of HD163296 we hope to determine the origin of their formation and their relation to the location of the CO snowline. We carried out observations towards this disk using ALMA Band 6 and obtained spectral cubes of N2D+ (=3–2), DCO+ (=3–2) and DCN (=3–2).
The goal of this study is to constrain the radial location of these deuterated species in the disk surrounding the Herbig Ae star HD 163296 that trace different deuteration pathways. In Section 2 we present our data and their reduction. Section 3 shows the spatial characterization of the line emission. Section 4 contains our modeling approach and the derived parameters. Section 5 discusses the validity of our models and an interpretation of our observed molecules as a tracer for different deuteration pathways and their relation to the CO snowline. Finally in section 6 we give our conclusions.
2 Observations
We carried out observations of the disk surrounding the Herbig Ae star HD163296 ( = , = ) using the Atacama Large (sub-)Millimeter Array (ALMA) in Band 6 as a part of Cycle 2 on the 27th, 28th and 29th of July 2014 (project 2013.1.01268.S). The total integration time on source was 4 hours and 43 min with thirty-three 12 m antennas. The correlator set up had 7 different spectral windows: three of them contain H2CO lines (Carney et al., 2017) while three others are centered on the rest frequencies of DCO+ (=3–2), N2D+ (=3–2) and DCN (=3–2), all of them at a resolution of 61 kHz. A final SPW contains wideband (2 GHz) continuum centered at 232.989 GHz. The quasar J1733-1304 was used as gain, bandpass and total flux calibrator with 1.329 Jy on the lower sideband and 1.255 Jy in the upper sideband.
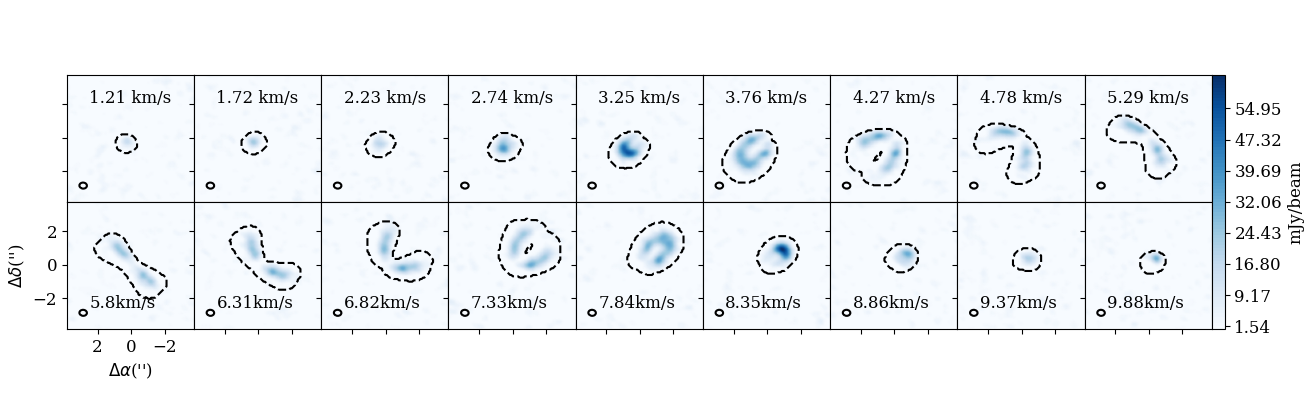
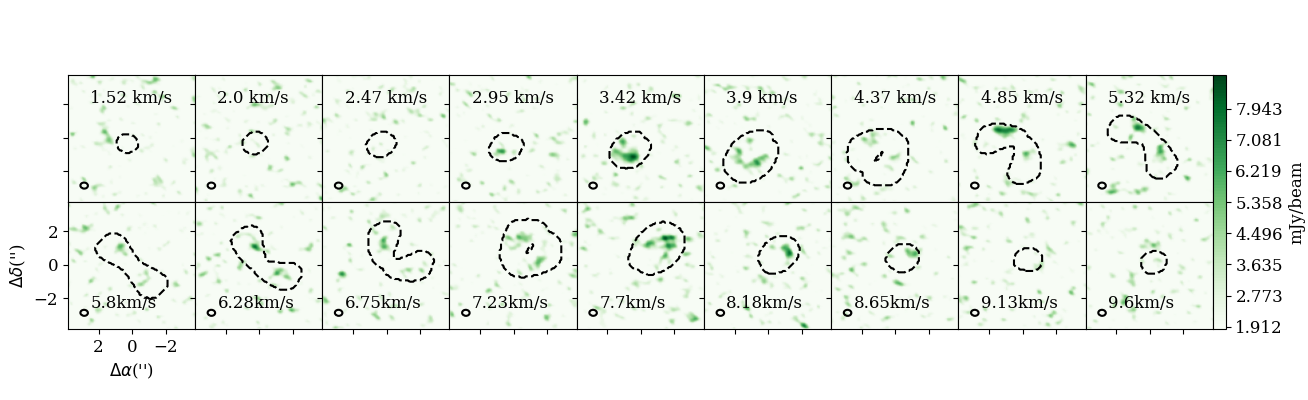
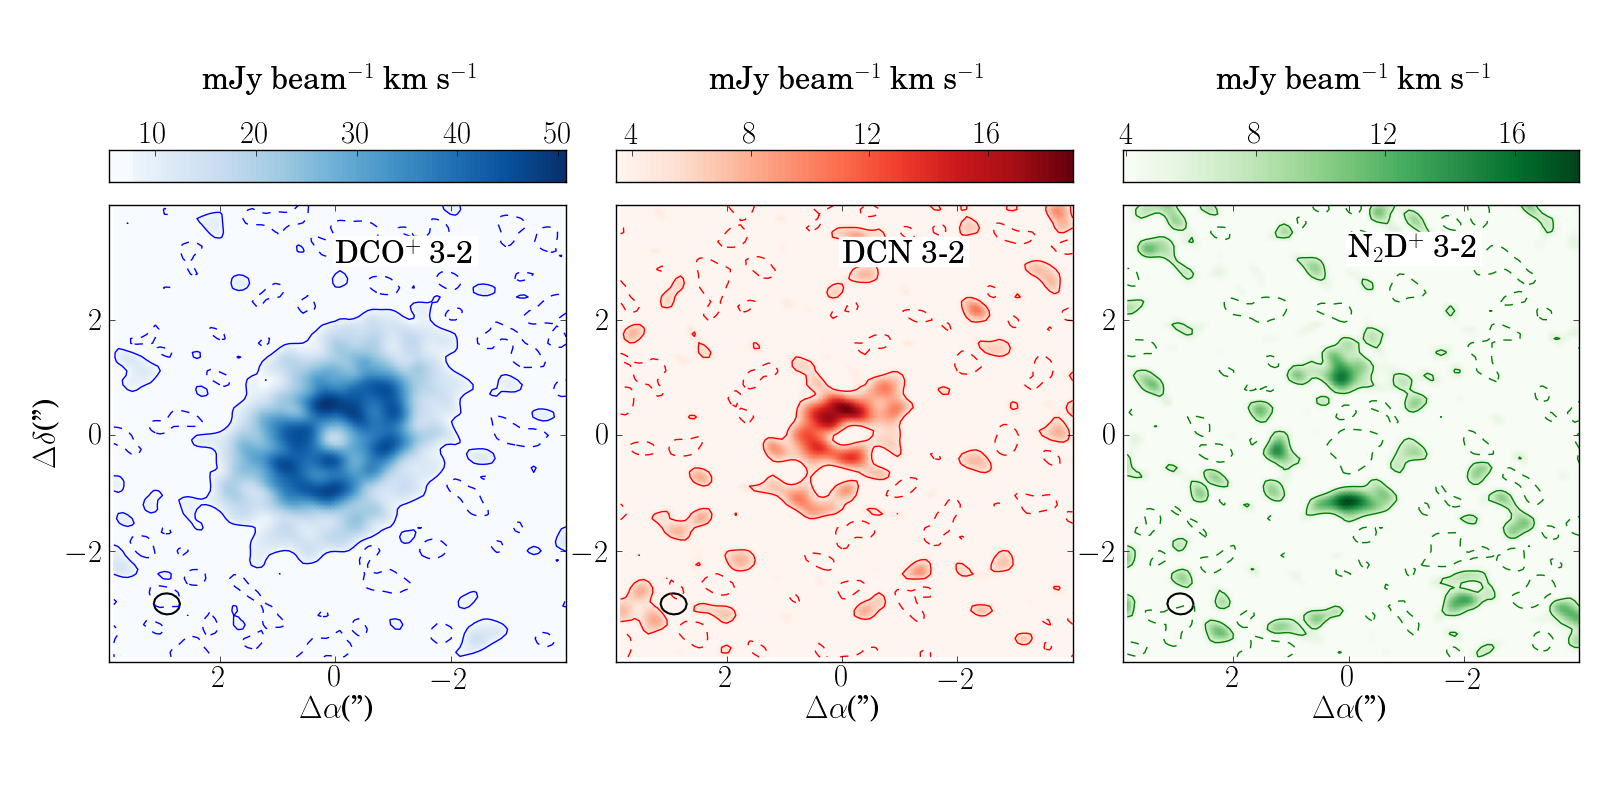
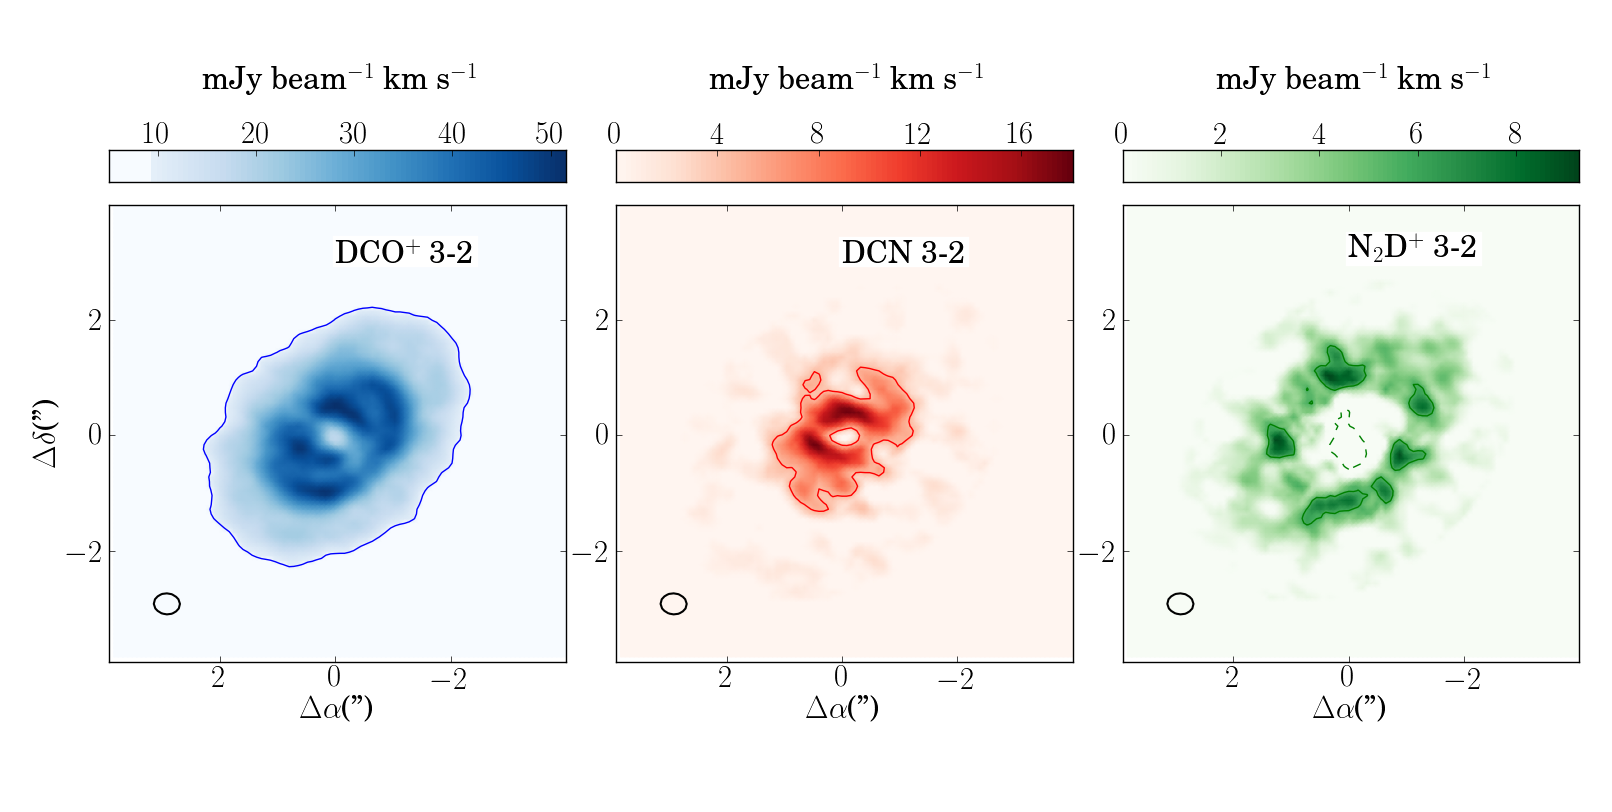
The data were calibrated following the standard CASA reduction as provided in the calibration scripts by ALMA. Baselines in the antenna array configuration correspond to a range in -distance of 20–630 k, which translates into a beam of 033. Self calibration was applied to the data as implemented by Carney et al. (2017). The DCO+ (J=3–2), N2D+ (J=3–2) and DCN (J=3–2) lines were continuum subtracted in the visibility plane using a linear fit to the line-free channels and imaged by the CLEAN task in CASA. Figure 1 shows integrated intensity maps of each line with and without a Keplerian mask. This mask is constructed by calculating the projected Keplerian velocities of the disk and matching them with the expected Doppler shifted emission in the data’s spectral cube (see Appendix A). The N2D+ (=3–2) emission is sitting on the edge of a strong atmospheric feature at high . We fit the continuum only using the least noisy line-free channels from one side of the spectra (channels 350–750) but continuum subtraction is less accurate here.
3 Results
3.1 Detections
We successfully detected all of our target emission lines. Table 1 shows a summary of the line emissions based on integrated intensity maps with Keplerian masking (lower panels of Fig.1).
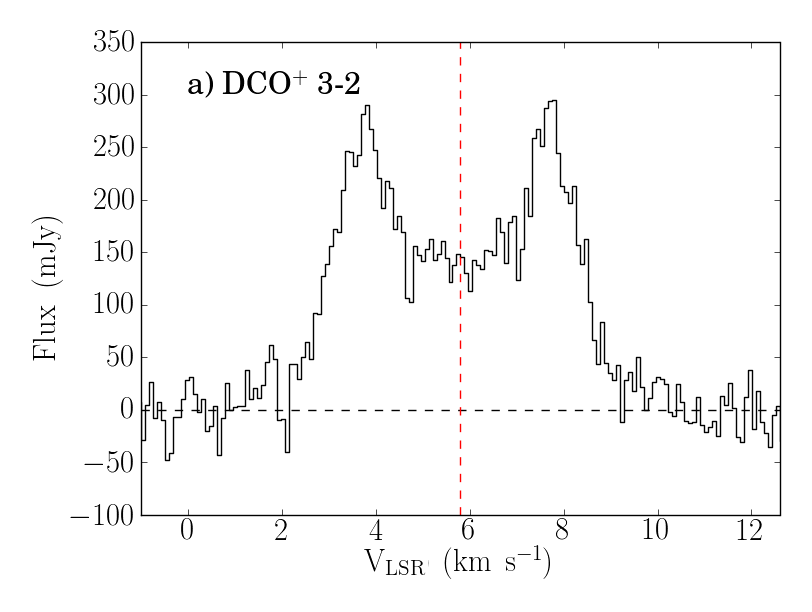
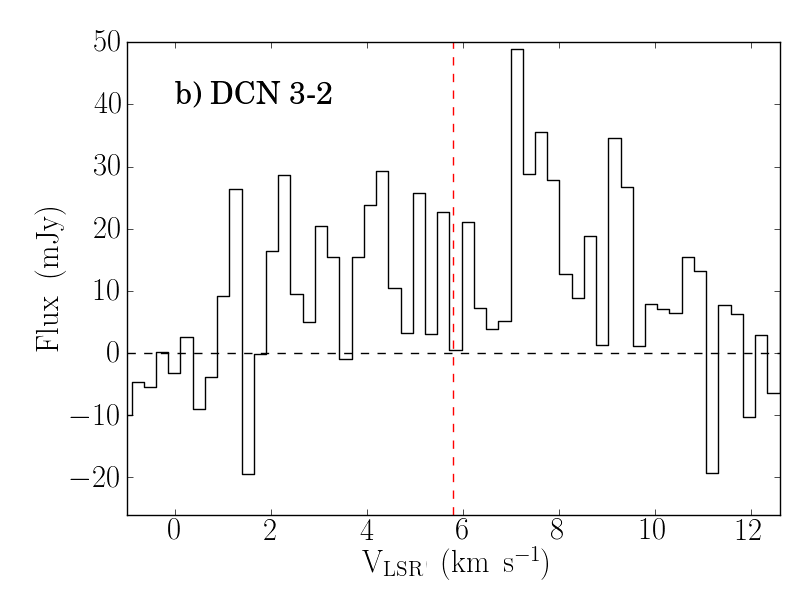
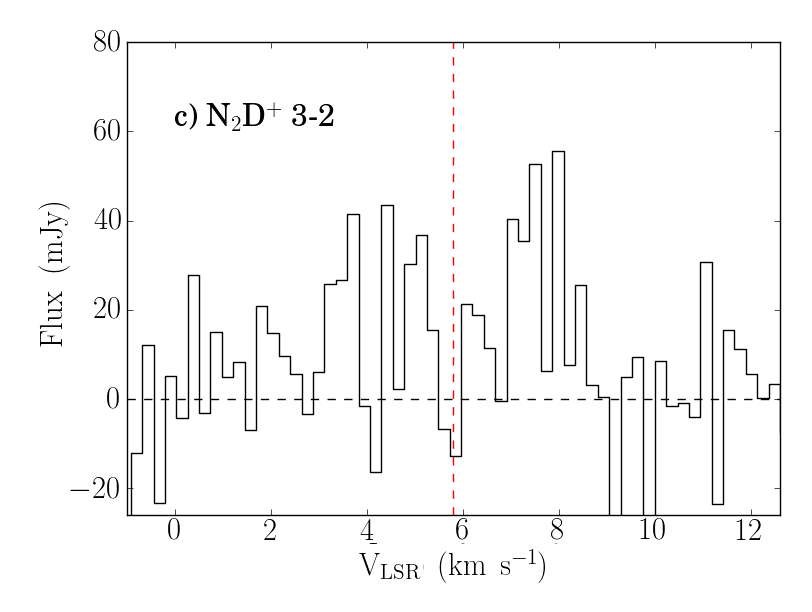
Figure 2 shows the double peaked spectra of DCO+ (=3–2), DCN (=3–2) and N2D+ (=3–2) at peak fluxes of 294 mJy, 48 mJy and 54 mJy (without binning); corresponding to detection s of 11, 5 and 4 respectively. These spectra correspond to an aperture in the sky equal to the 1 contour of DCO+ in Fig. 1 for all lines. A simple Gaussian fit of the DCO+ line profile gives a FWHM of 6.0 km s-1 and +5.8 km s-1 offset or systemic velocity consistent with values in the literature.
| Line transition | Frequency | Integrated Intensity | Beam | Channel rms |
|---|---|---|---|---|
| (GHz) | (mJy km s-1) | (mJy/beam) | ||
| DCO+ J=3–2 | 216.112 | 1270.45 5.8 | 053 042 | 3.25 |
| DCN J=3–2 | 217.238 | 104.4 5.6 | 053042 | 3.11 |
| N2D+ J= 3–2 | 231.321 | 61.6 7.5 | 050039 | 3.37 |
From the integrated intensity maps, shown in Fig. 1, N2D+ seems to be emitting from a broad ring with its peak flux at 9.3 mJy beam-1 km s-1 and a velocity integrated line intensity of 61.6 7.5 mJy km s-1. On the other hand, DCN emission is more compact, arising from within the N2D+ ring. As already noted by Huang et al. (2017) in their observations, we do not see clear evidence for an offset from the center as reported by Yen et al. (2016). The emission peak is somewhat shifted northeast from what is observed by Huang et al. (2017). The total DCN velocity integrated line intensity is 104.4 5.6 mJy km s-1 and the peak flux of its integrated intensity map is at 17.3 mJy beam-1 km s-1. DCO+ extends radially further inwards than what was observed by Mathews et al. (2013) as confirmed by Qi et al. (2015) and Huang et al. (2017) within both of the N2D+ and N2H+ emission rings. The DCO+ emission peaks at 51.5 mJy beam-1 km s-1 northwest as noticed by both Yen et al. (2016) and Huang et al. (2017), and has a velocity integrated line intensity of 1270.5 5.8 mJy km-1.
Figure 3 shows the average radial profile of the integrated intensity maps of Fig. 1. This profile is constructed taking the average value of concentric ellipsoid annuli and their error is taken from the standard deviation. Note that the projected linear resolution is lower along the semi-minor axis than along the semi-major axis and therefore the resulting spatial resolution of the radial profiles is poorer than the synthesized beam. The N2D+ and DCN emission peak at 160 AU and 60 AU respectively. The DCO+ emission shows 3 three peaks at 60 AU, 130 AU, 250 AU, and extends up to 330 AU. Both the DCN and the DCO+ radial profiles show a depression towards the center of the disk that is discussed in Sec. 5.

3.2 Column densities and deuterium fractionation
We can get an estimate of the disk-averaged column densities of the observed species if we consider the analytical formula from Remijan et al. (2003) for optically thin emission,
| (1) |
where: and (arcsec) corresponds to the semi-major and semi-minor axis of the synthesized beam, is the total line flux (Jy beam-1 km s-1) and Tex (K) is the excitation temperature. The partition function (Qrot), upper energy level (Eu K), line strength (Sij) and dipole moment ( Debye) were taken from the CDMS database.
We adopt two different disk-averaged excitation temperatures for each of the molecules: 10 and 25 K for N2D+ and 25 and 80 K for DCN and DCO+. N2D+ should be abundant at temperatures 25 K where CO is frozen-out (Qi et al., 2015) and at temperatures 10 K where the low deuteration channel starts to be active. On the other hand, DCN and DCO+ start to be abundant at higher temperatures where the high temperature pathway starts to be active (80K, see below Sec. 4.1). Table 2 summarizes our column density estimates for the three deuterated species using the values of the velocity integrated line intensities from Table 1. In general, our estimates do not differ by more than a factor of 2 within the excitation temperature ranges. Table 3 shows estimated disk-averaged deuterium fractionation (Df) values for each of our species using the disk-averaged column densities from Table 2. We take the velocity integrated flux values of past line detections of H13CO+ =3–2 (620 mJy beam-1 km s-1), H13CN =3–2 (170 mJy beam-1 km s-1) (Huang et al., 2017), N2H+ =3–2 (520 mJy beam-1 km s-1) (Qi et al., 2015) and Eq. 1 to derive disk-average column densities assuming a 12C/13C ratio of 69 (Wilson, 1999). The 12C/13C ratio can vary in disks between different C-bearing species (Woods & Willacy, 2009). Higher or lower 12C/13C ratios for these species change Df linearly. These Df values are only lower limits as the species might not be spatially co-located.
| Tex | N | NDCN | N |
|---|---|---|---|
| (cm-2) | (cm-2) | (cm-2) | |
| 10 K | - | - | 2.5 |
| 25 K | 1.68 | 2.9 | 1.6 |
| 80 K | 2.56 | 5.2 | - |
| Tex | |||
|---|---|---|---|
| 10 K | - | - | 0.340.15 |
| 25 K | 0.050.01 | 0.020.01 | 0.450.21 |
| 80 K | 0.060.01 | 0.020.01 | – |
4 Parametric modeling
4.1 Deuterium chemistry
The D/H ratio is specially useful to constrain the physical conditions of protoplanetary disks since an enhancement in this ratio is a direct consequence of the energy barrier of the reactions that deuterate simple molecules. We can distinguish three different key reactions that introduce deuterium into the most abundant species in protoplanetary disks (Gerner et al., 2015; Turner, 2001),
| (2a) | |||
| (2b) | |||
| (2c) |
The right-to-left reaction of Equation 2a is endothermic and strongly enhances the D/H ratio of H2D+, and species that derive from it, in temperatures ranging from 10-30 K (Millar et al., 1989; Albertsson et al., 2013). This regime corresponds to the so-called low temperature deuteration channel. In contrast, the right-to-left reactions of Eq. 2b and 2c, involving light hydrocarbons, effectively enhance the deuterium fractionation in warmer temperatures ranging from 10-80 K . This regime corresponds to the high temperature deuteration channel.
N2D+ forms mainly through the low temperature deuteration channel via ion-molecule reaction (Dalgarno & Lepp, 1984),
| (3) |
Hence the formation of N2D+ is expected to be enhanced at the same temperature range as H2D+.
DCN is formed out of two main reactions involving the low and high temperature channels with the latter being dominant (66%) (Turner, 2001; Albertsson et al., 2013). Early works identify the low temperature channel as the key gas-phase formation of DCO+ (Watson, 1976; Wootten, 1987). This pathway starts from Eq. 2a followed by the reaction
| (4) |
However, recently modeling efforts by Favre et al. (2015) show that the high temperature channel may be an active formation pathway. If we consider Eq. 2b, DCO+ can be formed via
| (5) |
4.2 Motivation
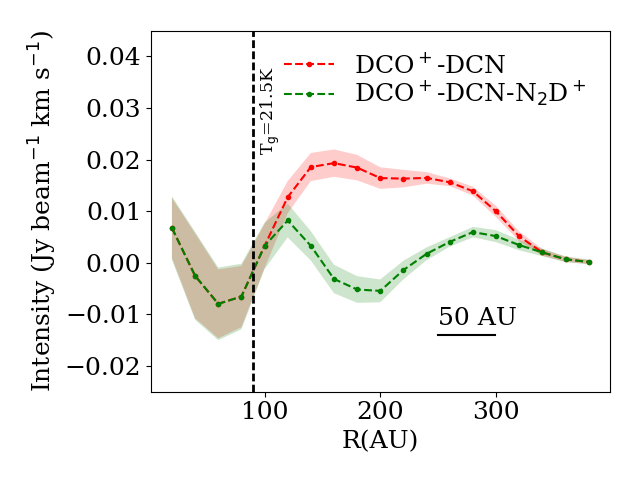
Past observations of DCN in protoplanetary disks show centrally peaked distributions (Qi et al., 2008; Huang et al., 2017). This supports the idea of DCN being mainly formed through the high temperature deuteration pathway. If N2D+ and DCN are tracing the low and high temperature deuteration pathways, respectively, we can think of the DCO+ emission as a linear combination of DCN and N2D+. Figure 4 shows, as an illustration, the DCO+ radial profile subtracted first by the DCN emission scaled by a factor of 3.7 and then by the N2D+ emission scaled by a factor of 4.9. These factors can be interpreted as the ratio of their abundances. The first ring at 115 AU in the residuals, after subtracting both the DCN and N2D+ radial profile, can be interpreted as DCO+ that is formed inside the CO snowline. If N2D+ is formed exclusively outside the snowline, its emission peak will be slightly shifted outwards (van’t Hoff et al., 2017; Zhang et al., 2017) and its subtraction will reveal DCO+ formed by the low temperature channel in the regions where CO is still present in the gas phase . The second residual ring at 280 AU indicates a third regime where DCO+ is present in the gas phase that does not correlate with the deuteration pathways regimes probed by DCN and N2D+.
We intend to characterize the three different regimes described above using a reasonable physical model for the disk and simple models for the column density of our species. In the following section we describe the adopted physical model and the parametric abundances for N2D+, DCN and DCO+ that are used to fit the data.
4.3 Physical model
We adopt the physical model used by Mathews et al. (2013). This model was constructed by approximating the semi-parametric modeling of Qi et al. (2011) fitting the SED and the extent of their mm observations .The density structure is defined by
where is determined by the total disk mass (0.089 M⊙ using a gas-to-dust ratio of 0.0065), (150 AU) is the characteristic radius and (0.6 AU) is the inner rim of the disk. The vertical structure is treated as a Gaussian distribution with an angular scale height defined by
where (0.066) is the flaring power of the disk and is the angular scale height at the characteristic radius . The parameter takes different two values for the dust vertical distribution and two more for the gas vertical distribution. The parameters (0.08) and (0.06) describe the distribution of small and large dust grains, respectively, while (0.1) and (0.2) describe the main bulk distribution of gas in the mid-plane of the disk and the tail of gas that continues the upper regions of the disk surface (See appendix A of Mathews et al., 2013). The gas temperature profile was computed by the 2D radiative transfer code RADMC (Dullemond & Dominik, 2004) assuming TTdust. This code receives as an input the stellar parameters as listed in Mathews et al. (2013) and the dust density distribution.
4.4 N2D+, DCN and DCO+ abundance models
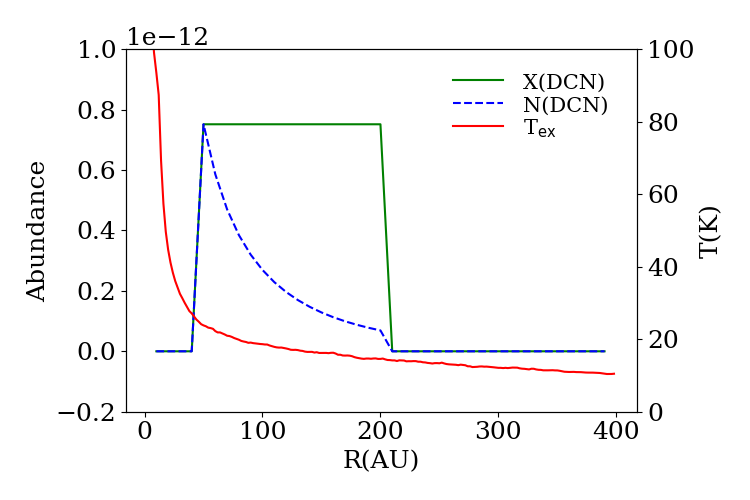
DCN is formed mainly (66%) through deuterated light hydrocarbons such as CH2D (see Fig. 5c of Turner, 2001). This reaction starts with the deuteration of CH, the so-called high temperature deuteration pathway. For an enhancement of CH2D+ over CH temperatures should not exceed 10–80 K. We use a simple toy model for DCN taking the same approach as for the N2D+ model with three free-parameters: an an inner radius , beyond it is sufficiently cold for an enhancement of the CH2D/CH ratio, an outer radius , and a constant abundance .
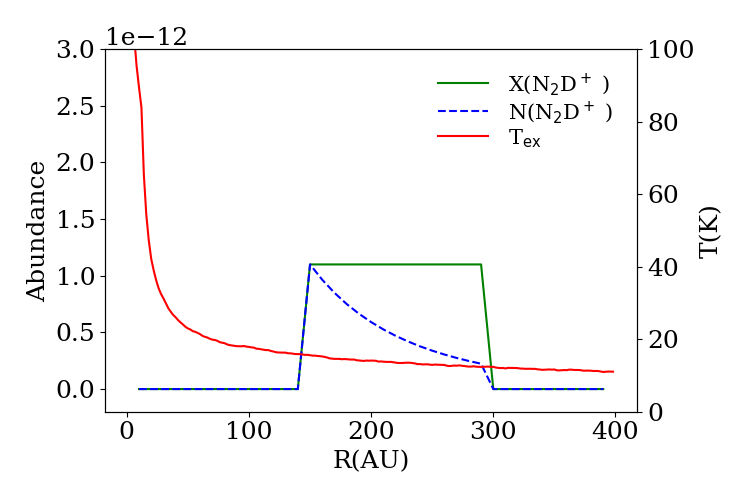
N2D+ is formed by the reaction of N2 with H2D+. We expect considerable abundances of N2D+ only outside the CO snowline because its parent molecule, H, is readily destroyed by proton exchange with CO. This is also true for its non-deuterated form N2H+. We use a simple ring model to constrain the spatial distribution of gas N2D+. The model consists of three free-parameters: an inner radius beyond the CO snowline and where conditions are sufficiently cold for a substantial enhancement of the H2D+/H ratio, an outer radius , and a constant abundance .
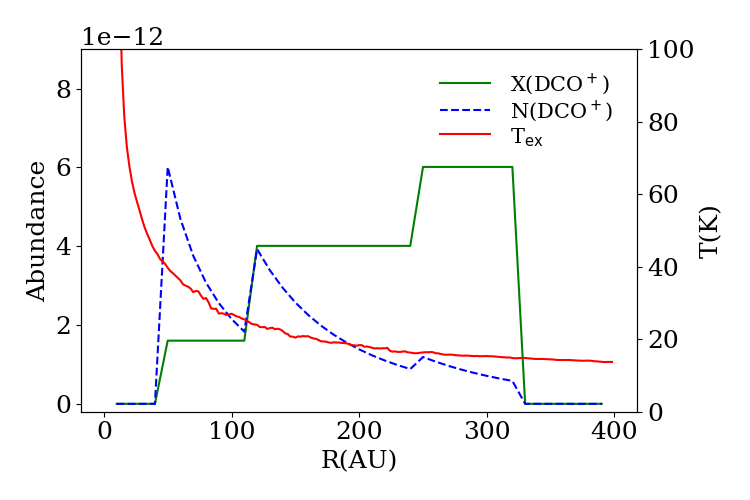
We model the distribution of DCO+ as three separate contributions from both deuteration channels and a third region in the outer disk motivated by the radial profile of its integrated intensity map (Fig. 4). Our model uses a set of seven parameters describing three regions: an inner radius (), two radial breaks (, ) and three constant abundances (, , ) for the inner, the middle and the outer emission region. Figure 5 shows abundances and column density profiles of these simple models.
4.5 Line excitation
Instead of a full radiative transfer modeling we opted for a more simplistic approach by considering estimates of a characteristic excitation temperature as a function of the distance to the central star to calculate the resulting line emission given an abundance profile. We used LIME (Brinch & Hogerheijde, 2010, v1.5), a 3D radiative transfer code in non-LTE that can produce line and continuum radiation from a physical model to estimate a characteristic excitation temperature as a function of radius throughout the disk for the observed transitions: DCO+ 3–2, DCN 3–2 and N2D+ 3–2. We use the physical model described above and a constant abundance equal to the disk-averaged found in Sec. 3 assuming K. LIME outputs population levels in a grid of 50000 points which are randomly distributed in using a logarithmic scale. Establishing a convergence criteria encompassing all of the grid points is difficult. We manually set the number of iterations to 12 and confirm convergence by comparing consecutive iterations. We use the rate coefficients from the Leiden Atomic and Molecular Database (Schöier et al., 2005)222www.strw.leidenuniv.nl/moldata/. For N2D+ and DCN we use, respectively, the N2H+ rate coefficients, which are adopted from HCO+ (Flower, 1999), and the HCN rate coefficients (Dumouchel et al., 2010) since the transitions between the non-deuterated and deuterated forms do not differ significantly. For DCO+ we use the same collision rates as the ones for HCO+ and the Einstein A coefficients taken from CDMS and JPL.
To construct the radial excitation temperature profile we take the average excitation temperature of the points below , where is the scale height of our adopted physical model. These temperature profiles are shown in red in Fig.5. A drawback of this approach is that assuming an isothermal vertical structure of the temperature profile might not properly describe the vertical region over which the molecules extend.
4.6 Abundance estimates
We compute a radial emission profile using the radial excitation temperature profile and the column densities from the parametric constant abundance profiles, shown in green in Fig.5, by solving Eq.1.
We then create a 2D sky image from the modeled emission profile and convolve it with the synthesized beam of the observation to fit the integrated intensity maps shown in Fig. 1. Since we only fit radial column density profiles the vertical distribution of these species cannot be constrained by this approach. However, past modeling of DCO+ shows that its vertical distribution has limited effect on constraining radial boundaries (Qi et al., 2015).
4.7 Best-fit parameters
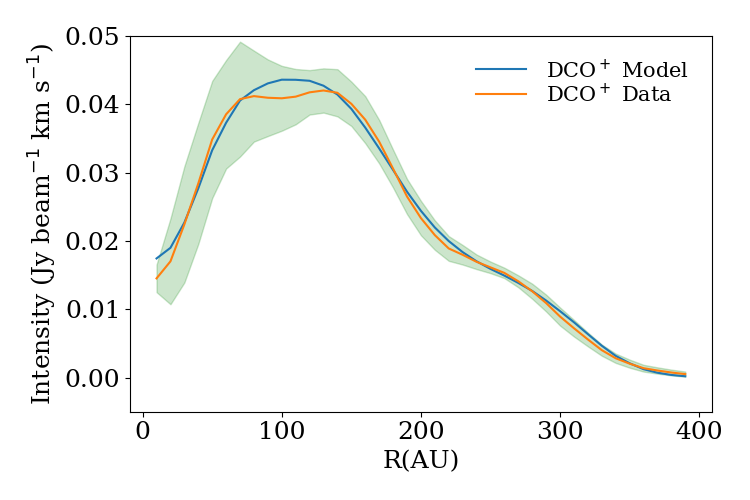
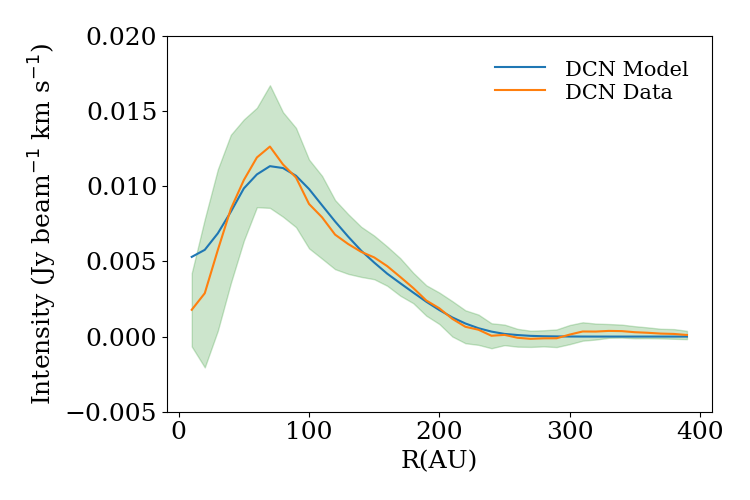
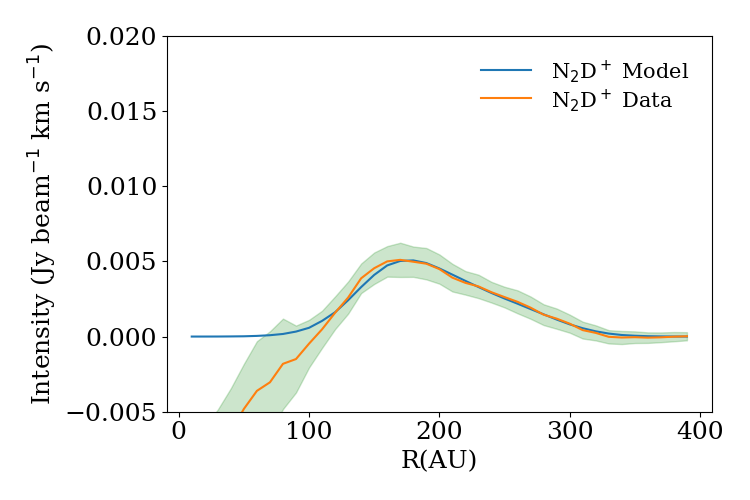
We minimize values, where corresponds to the data points of the integrated intensity maps (as shown in Fig. 1), corresponds to the points of the modeled integrated intensity map convolved with the synthesized beam and corresponds to the standard deviation of the pixels of a concentric ellipsoid (as the ones used to make the radial profiles seen in Fig.3) that includes the pixel . We report best-fit parameters that correspond to a minimum of the explored parameter space. In the case of DCO+ we explore different configurations of rings, allowing them to have one, two or no gaps empty of material between the ring-like regions. Table 4 shows a summary of our preferred models and Fig. 6 show radial profiles of the best-fit model’s column density, integrated intensity, estimated excitation temperature and the integrated intensity of the data for each of our detections.
In the case of DCO+ the location of the different radial zones are degenerate. A model with an additional two degrees of freedom, describing three radial rings separated by gaps, can also reproduce the data. The modest spatial resolution of our data cannot distinguish between these models. Detailed chemical modeling plus a 3D radiative treatment of DCO+ is necessary to break the degeneracy of our toy model. The best-fit abundances for the simplest model without any gaps as described in Sec. 4.4 are =1.610-12, =4.010-12, =6.010-12 and their best-fit radial boundaries are =50 AU, =118 AU , =245 AU and =316 AU. We do not consider a vertical distribution of the DCO+ and DCN molecules. This results in vertically averaged abundances which are lower limits to the maximum values expected in a full 2D treatment because in reality DCO+ and DCN are absent where the gas temperature is higher than the activation temperature for their deuteration. In addition, DCO+ is absent in the midplane where CO starts to freeze-out.
The best-fit model for the DCN emission profile consists of a ring with constant abundance =7.510-13 between =51 AU and =201 AU, where can be thought as the radius where the gas temperature is high enough for the reaction described in Eq. 2b to be exothermic. The best-fit model for the N2D+ emission profile consists of a ring with constant abundance =1.110-12 between =139 AU and =287 AU, where could be tracing the CO midplane snowline radial location.
| Parameters | DCN =3–2 | N2D+ = 3–2 | DCO+ =3–2 |
|---|---|---|---|
| 51 AU | 139 AU | 50 AU | |
| 118 AU | |||
| 245 AU | |||
| 201 AU | 287 AU | 316 AU | |
| 7.510-13 | 1.610-12 | ||
| 1.110-12 | 4.010-12 | ||
| 6.010-12 |
5 Discussion
5.1 The inner depression
Our best-fit models find an inner drop in emission at 50 AU for both the DCN and DCO+ line emission. This could be tracing the gas temperature required for the high-temperature deuteration channel to be active (10-80 K) or an optically thick continuum region at small radii. Recent observations of C18O, 13CO and continuum at 1.3 mm (Isella et al., 2016) with ALMA in higher spatial resolution also show a central depression in C18O and 13CO radial intensity profiles. These CO isotopes are optically thin and trace the gas near the midplane. If the dust becomes optically thick it could hide the line emission coming from deeper layers towards the midplane. Subtracting the continuum estimate in these regions then creates an apparent absence of emission. An alternative explanation is inherent to the chemistry of both species. DCN is readily destroyed by simple ions such as H and H+ (Albertsson et al., 2013). DCO+ can be destroyed if H2O is desorbed from the grains at inner radii. It is unlikely that both of these effects correlate at the same radii (R50 AU).
The peak value of the continuum at the center of the disk is 167 mJy beam-1 corresponding to a brightness temperature of 25 K at 1.3 mm. This is inconsistent with the expected dust temperature derived from SED models for optically thick dust. The disk surrounding HD163296 is known to have unresolved ring-like structure at 1.3 mm (Zhang et al., 2016; Isella et al., 2016). The corresponding brightness temperature for the peak intensity in these observations at higher spatial resolution is 55 K consistent with optically thick dust. The best-fit continuum models of Isella et al. (2016) show optically thick dust just inside 50 AU. We conclude that our parameter is tracing this optically thick dust region.
5.2 Limitation of DCO+ as a CO snowline tracer
N2H+ has been used to trace the CO snowline in protoplanetary disks before (Qi et al., 2015, 2013). We expect N2D+ to also trace it using the same reasoning as for N2H+ (Huang & Öberg, 2015). Our best-fit N2D+ model gives a value of 141 AU, that is 50 AU further away than previous estimates of the CO snowline in HD 163296. This could be due to the apparent central depression in the N2D+ radial profile. As explained in Sec. 2 this line is sitting on the edge of an atmospheric feature resulting in high noise and a very weak detection which makes it difficult to do a good continuum estimation. The central negative bowl has the same order of magnitude as other scattered negative noise in the image plane of the resulting integrated intensity map, but, as it is located at the center, an azimuthal average does not represent as good an estimate of the radial profile in the inner disk as it does in the outer disk. We cannot rely on our best-fit value for as a probe for the CO snowline in the midplane, although a deeper integration of the N2D+ =3–2 line can still be used to constrain it.
On the other hand, our best-fit DCO+ model value for of 118 AU agrees well with the previous estimate of 90 AU given our resolution. Two effects are boosting the deuterium fractionation of H2D+ and, in consequence, the low temperature deuteration channel. First, the gas temperature is low enough for the reaction in Eq. 2a to be mainly exothermic. Second, H2D+ is readily destroyed by CO in the gas-phase which is frozen out. But CO must be present to form DCO+ via Eq. 5. This could be achieved in a scenario where DCO+ is found in a thin layer around the CO freeze-out temperature as proposed by Mathews et al. (2013). Without previous knowledge, DCO+ alone cannot trace the location of the CO snowline.
5.3 The origin of the third ring
Motivated by the reasoning in Section 4.2 we find a best-fit value of 245 AU for the parameter in our DCO+ model. At these radii the bulk of CO in the gas-phase is locked up on the grains as ice. The main production route of DCO+ in the low-temperature deuteration route (Eq.4) requires CO in the gas-phase. This raises the question how DCO+ emission arises at such large radii.
Photodesorption of CO by non-thermal processes could explain an outer ring of DCO+ emission as discussed in the case of IM Lup (Öberg et al., 2015). However the efficiency of this mechanism is very model-dependent. Full chemical models of DCO+ towards DM Tau (Teague et al., 2015) show that, although there is an enhancement of DCO+ at large radii produced by the interstellar UV field and X-ray luminosity, the effect is not as pronounced as the one seen in IM Lup. The strongly emitting outer disk seen towards IM Lup coincides with the extent of the mm-size grains. If the smaller grains are also following the steepening of the mm-size grains’ surface density, UV penetration will be enhanced leading to an enhancement on the DCO+ emission. High-resolution continuum data observed with ALMA band 6 (Isella et al., 2016) revealed three concentric sets of rings and gaps as predicted by Zhang et al. (2016). The first depression at D 53 AU and the second brightness peak centered at B 120 AU correlate well with =50 AU and =118 AU from our best-fit DCO+ model. The extent of the continuum to about 230 AU also correlates with at 245 AU from our best-fit DCO+ model . Although no direct consequence of the location of the second gap can be drawn towards an enhancement in UV penetration, the scales at which these rings are seen in the (sub)mm-continuum ( 60-50 AU) are a rough estimate of the spatial scales where rings and gaps are seen in shorter wavelengths. UV radiation or cosmic-ray-induced photons may also photo-dissociate species on the grains surface (Cuppen & Herbst, 2007) such as HDCO leading to the release of DCO+. Full grain-surface chemical modelling is needed to identify the chemical reactions involved in this mechanism.
Cleeves (2016) have proposed a thermal inversion in the midplane as a mechanism to release CO into the gas-phase at large radii . Recently, dust evolution modeling efforts by Facchini et al. (2017) coupled with chemistry models on HD163296 show signals of thermal inversion as a direct consequence of radial drift, grain growth and settling. As a result, thermal CO desorption is enhanced at large radii where the dust becomes warmer. The thermal inversion in the models of Facchini et al. (2017) occurs at about 400 AU, farther away than our best-fit parameter of 245 AU. However, the radial location of the thermal inversion is very temperature sensitive, and a slightly colder disk could shift its location inwards. It is important to note that this effect is only seen in models with a low turbulence of 10-3-10-4 and when the CO ice is mixed with water ice resulting in a higher binding energy. A tailored model is necessary to confirm the viability of this mechanism as an explanation for the outer DCO+ ring.
Finally, another plausible explanation is a local decrease of the ortho to para (o/p) ratio of H2. The reaction shown in Eq.2a has a higher activation barrier for p-H2 than for o-H2 which will result in an increase on DCO+ formation (Murillo et al., 2015; Walmsley et al., 2004). Detailed chemical modelling is needed to test this scenario.
5.4 Deuterium fractionation
Our estimated disk-averaged fractionation ratio Df(DCO+/HCO+) of 0.050.01 agrees with previous measurements on this source (Huang et al., 2017) or even towards other disks, e.g. DM Tau (Guilloteau et al., 2006) and TW Hya (van Dishoeck et al., 2003).
Our estimated value of 0.020.01 for Df(DCN/HCN) is lower than the Df(DCO+/HCO+) and Df(N2D+/N2H+). A lower value of Df(DCN/HCN) compared to Df(N2D+/N2H+) could be hinting at a more efficient deuterium enrichment in the outer colder disk. On the other hand, in comparison with Df(DCO+/HCO+), a lower value of Df(DCN/HCN) could be explained by the different deuteration pathways that formed them, supporting the idea of a colder formation environment for DCO+ at large radii. Both of these values are of the same order of magnitude as for other protoplanetary disks (Öberg et al., 2012; Huang et al., 2017). The derived Df(DCO+/HCO+) value is one order of magnitude lower than in starless cores but similar to the value towards low-mass protostars, such as IRAS 16293-2422 (Butner et al., 1995; Caselli et al., 2002; Tafalla et al., 2006; Schöier et al., 2002). The derived Df(DCN/HCN) value is the same order of magnitude towards low-mass protostars and starless cores (Wootten, 1987; Roberts et al., 2002).
Our estimated value of 0.450.21 for Df(N2D+/N2H+) is higher than Df(DCO+/HCO+) and Df(DCO+/HCO+) as predicted by the chemical models of Willacy (2007). It is also comparable to the values towards the T Tauri disk AS 209 (Huang & Öberg, 2015) and consistent with the wide range of ratios, from 0.02 to 0.44, found towards starless cores (Crapsi et al., 2005). As noted in the case of AS 209, the higher D/H ratio from N2D+ compared to the one from DCO+ is a consequence of their formation environments. DCO+ is formed where CO is not frozen-out in the relatively warm upper layers of the disk. N2D+ is more abundant where CO is frozen-out and deuteration is enhanced by Eq. 2a which, together with N2H+, makes it an excellent tracer of the cold outer midplane.
6 Summary
We have successfully detected three deuterated species towards HD 163296: DCO+, N2D+ and DCN. We use simple models and estimates of the midplane temperature to fit radial rings with constant abundance constraining their relative abundance and radial location. Our main conclusions are:
-
•
We confirm the location of the CO snowline using the second ring of DCO+ as a tracer at 100 AU, consistent with the previously reported value of 90 AU. Our N2D+ detection is too noisy to effectively constrain its location, although it is still consistent given our large beam.
-
•
DCO+ and DCN show an inner depression that arises most likely due to the due to optically thick dust and not due to inherent formation pathway of both species.
-
•
DCO+ shows a three ring-like structure, located at 70 AU, 150 AU and 260 AU that could be linked to the structure of the m-sized grains. The two first rings correspond to the high and low temperature deuteration pathways and are in agreement with simple DCN and N2D+ best-fit models.
-
•
The origin of the third DCO+ ring at 260 AU may be due to a local decrease of UV opacity allowing the photodesorption of CO and consequent formation of DCO+ as seen in other disks (Öberg et al., 2015), thermal desorption of CO as proposed by Facchini et al. (2017), or a local decrease of the o/p ratio of H2.
-
•
The derived Df values are several orders of magnitude higher than the D/H cosmic ratio as expected and are in agreement with previous measurements and models. The higher D/H value for N2D+ in comparison with those from DCO+ and DCN suggest a cooler formation environment for the former.
Acknowledgements.
The authors acknowledge support by Allegro, the European ALMA Regional Center node in The Netherlands, and expert advice from Luke Maud in particular. This work was partially supported by grants from the Netherlands Organization for Scientific Research (NWO) and the Netherlands Research School for Astronomy (NOVA) This paper makes use of the following ALMA data: ADS/JAO.ALMA# 2013.1.01268.S. ALMA is a partnership of ESO (representing its member states), NSF (USA) and NINS (Japan), together with NRC (Canada), NSC and ASIAA (Taiwan), and KASI (Republic of Korea), in cooperation with the Republic of Chile. The Joint ALMA Observatory is operated by ESO, AUI/NRAO and NAOJ.References
- Albertsson et al. (2013) Albertsson, T., Semenov, D. A., Vasyunin, A. I., Henning, T., & Herbst, E. 2013, ApJS, 207, 27
- Brinch & Hogerheijde (2010) Brinch, C. & Hogerheijde, M. R. 2010, A&A, 523, A25
- Butner et al. (1995) Butner, H. M., Lada, E. A., & Loren, R. B. 1995, ApJ, 448, 207
- Carney et al. (2017) Carney, M. T., Hogerheijde, M. R., Loomis, R. A., et al. 2017, ArXiv e-prints 1705.10188]
- Caselli et al. (2002) Caselli, P., Walmsley, C. M., Zucconi, A., et al. 2002, ApJ, 565, 344
- Ceccarelli et al. (2007) Ceccarelli, C., Caselli, P., Herbst, E., Tielens, A. G. G. M., & Caux, E. 2007, Protostars and Planets V, 47
- Cleeves (2016) Cleeves, L. I. 2016, ApJ, 816, L21
- Crapsi et al. (2005) Crapsi, A., Caselli, P., Walmsley, C. M., et al. 2005, ApJ, 619, 379
- Cuppen & Herbst (2007) Cuppen, H. M. & Herbst, E. 2007, ApJ, 668, 294
- Dalgarno & Lepp (1984) Dalgarno, A. & Lepp, S. 1984, ApJ, 287, L47
- Dullemond & Dominik (2004) Dullemond, C. P. & Dominik, C. 2004, A&A, 417, 159
- Dumouchel et al. (2010) Dumouchel, F., Faure, A., & Lique, F. 2010, MNRAS, 406, 2488
- Facchini et al. (2017) Facchini, S., Birnstiel, T., Bruderer, S., & van Dishoeck, E. F. 2017, ArXiv e-prints 1705.06235]
- Favre et al. (2015) Favre, C., Bergin, E. A., Cleeves, L. I., et al. 2015, ApJ, 802, L23
- Flower (1999) Flower, D. R. 1999, MNRAS, 305, 651
- Garufi et al. (2014) Garufi, A., Quanz, S. P., Schmid, H. M., et al. 2014, A&A, 568, A40
- Gerner et al. (2015) Gerner, T., Shirley, Y. L., Beuther, H., et al. 2015, A&A, 579, A80
- Guilloteau et al. (2006) Guilloteau, S., Piétu, V., Dutrey, A., & Guélin, M. 2006, A&A, 448, L5
- Huang & Öberg (2015) Huang, J. & Öberg, K. I. 2015, ApJ, 809, L26
- Huang et al. (2017) Huang, J., Öberg, K. I., Qi, C., et al. 2017, ApJ, 835, 231
- Isella et al. (2016) Isella, A., Guidi, G., Testi, L., et al. 2016, Phys. Rev. Lett., 117, 251101
- Mathews et al. (2013) Mathews, G. S., Klaassen, P. D., Juhász, A., et al. 2013, A&A, 557, A132
- Millar et al. (1989) Millar, T. J., Bennett, A., & Herbst, E. 1989, ApJ, 340, 906
- Mumma & Charnley (2011) Mumma, M. J. & Charnley, S. B. 2011, ARA&A, 49, 471
- Murillo et al. (2015) Murillo, N. M., Bruderer, S., van Dishoeck, E. F., et al. 2015, A&A, 579, A114
- Öberg et al. (2011) Öberg, K. I., Boogert, A. C. A., Pontoppidan, K. M., et al. 2011, ApJ, 740, 109
- Öberg et al. (2015) Öberg, K. I., Furuya, K., Loomis, R., et al. 2015, ApJ, 810, 112
- Öberg et al. (2010) Öberg, K. I., Qi, C., Fogel, J. K. J., et al. 2010, ApJ, 720, 480
- Öberg et al. (2012) Öberg, K. I., Qi, C., Wilner, D. J., & Hogerheijde, M. R. 2012, ApJ, 749, 162
- Perryman et al. (1997) Perryman, M. A. C., Lindegren, L., Kovalevsky, J., et al. 1997, A&A, 323, L49
- Qi et al. (2011) Qi, C., D’Alessio, P., Öberg, K. I., et al. 2011, ApJ, 740, 84
- Qi et al. (2015) Qi, C., Öberg, K. I., Andrews, S. M., et al. 2015, ApJ, 813, 128
- Qi et al. (2013) Qi, C., Öberg, K. I., Wilner, D. J., et al. 2013, Science, 341, 630
- Qi et al. (2008) Qi, C., Wilner, D. J., Aikawa, Y., Blake, G. A., & Hogerheijde, M. R. 2008, ApJ, 681, 1396
- Remijan et al. (2003) Remijan, A., Snyder, L. E., Friedel, D. N., Liu, S.-Y., & Shah, R. Y. 2003, ApJ, 590, 314
- Roberts et al. (2002) Roberts, H., Fuller, G. A., Millar, T. J., Hatchell, J., & Buckle, J. V. 2002, A&A, 381, 1026
- Schöier et al. (2002) Schöier, F. L., Jørgensen, J. K., van Dishoeck, E. F., & Blake, G. A. 2002, A&A, 390, 1001
- Schöier et al. (2005) Schöier, F. L., van der Tak, F. F. S., van Dishoeck, E. F., & Black, J. H. 2005, A&A, 432, 369
- Tafalla et al. (2006) Tafalla, M., Santiago-García, J., Myers, P. C., et al. 2006, A&A, 455, 577
- Teague et al. (2015) Teague, R., Semenov, D., Guilloteau, S., et al. 2015, A&A, 574, A137
- Turner (2001) Turner, B. E. 2001, ApJS, 136, 579
- van den Ancker et al. (1997) van den Ancker, M. E., The, P. S., Tjin A Djie, H. R. E., et al. 1997, A&A, 324, L33
- van Dishoeck et al. (2003) van Dishoeck, E. F., Thi, W.-F., & van Zadelhoff, G.-J. 2003, A&A, 400, L1
- van’t Hoff et al. (2017) van’t Hoff, M. L. R., Walsh, C., Kama, M., Facchini, S., & van Dishoeck, E. F. 2017, A&A, 599, A101
- Vidal-Madjar (1991) Vidal-Madjar, A. 1991, Advances in Space Research, 11, 97
- Walmsley et al. (2004) Walmsley, C. M., Flower, D. R., & Pineau des Forêts, G. 2004, A&A, 418, 1035
- Watson (1976) Watson, W. D. 1976, Reviews of Modern Physics, 48, 513
- Willacy (2007) Willacy, K. 2007, ApJ, 660, 441
- Wilson (1999) Wilson, T. L. 1999, Reports on Progress in Physics, 62, 143
- Wisniewski et al. (2008) Wisniewski, J. P., Clampin, M., Grady, C. A., et al. 2008, ApJ, 682, 548
- Woods & Willacy (2009) Woods, P. M. & Willacy, K. 2009, ApJ, 693, 1360
- Wootten (1987) Wootten, A. 1987, in IAU Symposium, Vol. 120, Astrochemistry, ed. M. S. Vardya & S. P. Tarafdar, 311–318
- Yen et al. (2016) Yen, H.-W., Koch, P. M., Liu, H. B., et al. 2016, ApJ, 832, 204
- Zhang et al. (2016) Zhang, K., Bergin, E. A., Blake, G. A., et al. 2016, ApJ, 818, L16
- Zhang et al. (2017) Zhang, K., Bergin, E. A., Blake, G. A., Cleeves, L. I., & Schwarz, K. R. 2017, Nature Astronomy, 1, 0130
Appendix A Keplerian Masking
Since the emission in each channel will only come from a region in the sky where the rotational velocity of the disk matches the Doppler shift of the line, selecting a subset of pixels on each velocity channel with Keplerian velocities equal to the expected Doppler shift enhances the signal to noise of the final integrated intensity map. To achieve this, we first calculate the projected radial velocity on each pixel using a stellar mass value of 2.3 M⊙ (van den Ancker et al. 1997). We create a mask cube with the same dimensions as the data spectral cube and select, for each spectral plane, the pixels that have a projected radial velocity greater than the correspondent Doppler-shifted velocity vr of the spectral plane and lower than vr+, where is the spectral resolution of the cube. Finally, each spectral plane of the mask cube is convolved with the synthesized beam to create a final mask that accounts for the smearing of the disk as seen in Fig 7.
A similar approach has already been used by Yen et al. (2016), stacking azimuthal regions that are corrected by their Keplerian velocity. They reconstruct integrated intensity maps by Doppler-shifting a selected azimuthal region within an inner and outer radius. Since both methods are flux conserving, the only difference lies in reduced noise for the latter in sacrifice of spatial information. The stacking method by Yen et al. (2016) achieves a S/N increase of a factor of 4 for the weak lines N2D+ J=3–2 and DCN J=3–2. In contrast our method achieves an increase in S/N of a factor of 2 but results in a much clearer integrated intensity map (see Fig. 1).