Present address: ]Elettra-Sincrotrone Trieste S.C.p.A., 34149, Basovizza, Trieste, Italy
Velocity-map imaging for emittance characterization of multiphoton-emitted electrons from a gold surface
Abstract
A velocity-map-imaging spectrometer is demonstrated to characterize the normalized transverse emittance of photoemitted electron bunches. The two-dimensional (2D) projected velocity distribution images of photoemitted electrons are recorded by the detection system and analyzed to obtain the normalized transverse emittance. With the presented distribution function of the electron photoemission angles a mathematical method is implemented to reconstruct the three-dimensional (3D) velocity distribution curve. As a first example, multiphoton emission from a planar Au surface is studied via irradiation at a glancing angle by intense 45 fs laser pulses at a central wavelength of 800 nm. The reconstructed energy distribution agrees very well with the Berglund-Spicer theory of photoemission. The normalized transverse emittance of the intrinsic electron bunch is characterized to be 0.52 and 0.05 in - and -directions, respectively.
pacs:
79.60.Bm, 41.20.Cv, 85.60.Ha, 79.20.WsI Introduction
Time-resolved imaging of both transient molecular structure and condensed phase dynamics with picometer-femtosecond spatiotemporal resolution has recently become possible with the advent of x-ray free-electron lasers (XFELs) Chapman et al. (2006); Barty et al. (2008); Young et al. (2010); Barty et al. (2012); Rudek et al. (2012); Barty et al. (2013); Erk et al. (2014). The high x-ray brilliance, coherence, and ultrashort pulse durations available from these sources are the key properties Huang and Kim (2007) that open up unprecedented opportunities for new science. Therefore, precise control of the x-ray pulse characteristics, including spectral coverage and temporal and spatial beam profiles are of utmost importance for advanced applications. These parameters are directly influenced by the properties of the electron bunch generating the x-ray pulses. Therefore, the accurate characterization of the electron beam quality is indispensable for assessing available approaches in order to enable improvements of the underlying electron beam technology. In addtion, high quality electron bunches are instrumental in experiments where materials are studied using electron diffractive imaging Ihee et al. (2001); Siwick et al. (2003); Gulde et al. (2014); Yang et al. (2016).
The key measure in electron beam quality is electron beam emittance, i. e., the transverse phase-space distribution of the generated electron bunches. To quantify electron beam emittance as a function of photocathode composition and emission mechanisms, we demonstrate a velocity-map-imaging (VMI) spectrometer that allows us to directly access the transverse momentum distribution of photoemitted electrons, enabling the measurement of normalized transverse emittance from various cathodes. Usually, emission mechanisms are classified as thermionic emission, photoemission, or tunneling emission under extraordinarily high electric fields. More recently, nanostructured and plasmonic photocathodes used with multiphoton or strong-field optical emission have been used as improved electron sources Krüger et al. (2011); Herink et al. (2012); Mustonen et al. (2011); Putnam et al. (2016); Tsujino et al. (2016); Kärtner et al. (2016). Both, the experimental characterization and the theoretical description of the electron emittance from such cathodes is highly important, which motivates the direct VMI measurements developed here.
As a first proof-of-principle example, we report on quantitative measurements of multiphoton emission from a 400 nm thick Au thin film at room temperature, which was excited with 45-fs laser pulses centered at 800 nm. These measurements additionally allowed us to benchmark the performance of this new experimental setup. Quantum-yield-dependent measurements were performed by recording the events of electrons impinging on the detector when varying the average laser power and the polarization angle, respectively. These experimental results confirm that four-photon emission occurs from the planar Au surface. In our experiments the 2D transverse velocity/momentum distribution of photoemitted electrons was directly imaged onto the detector. An experimental 3D energy distribution was reconstructed from the measured 2D VMI data using a mathematical algorithm (vide infra) and compared to the theoretically derived 3D-space energy distribution from the Berglund-Spicer photoemission model Berglund and Spicer (1964a, b); Krolikowski and Spicer (1969, 1970). The very good agreement of our experimental results with the theoretical model demonstrates the applicability of VMI for the characterization of the normalized transverse emittance of photoelectron emitters.
II Experimental Setup
The velocity-mapping technique maps the velocity coordinates of particles onto a 2D detector without, to first order, the influence of the spatial coordinates. To achieve this, a configuration of electrostatic lenses, in the simplest case using three parallel electrodes, is employed to spatially tailor the electric fields Eppink and Parker (1997); Chichinin et al. (2009); Stei et al. (2013). The electric fields can be also used to image and magnify the spatial coordinates suppressing the effect of velocity coordinates, which is then referred to as spatial-map imaging (SMI) Eppink and Parker (1997). The spectrometer demonstrated here aims to characterize the electron emittance via characterizing the average spread of electron coordinates in position-and-momentum phase space.
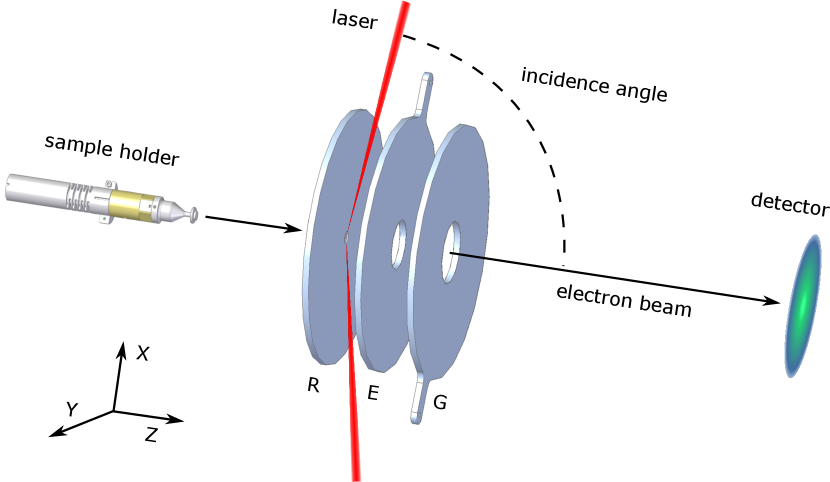
The schematic of the spectrometer is shown in Fig. 1. The sample is mounted on the top of the sample holder, which can be retracted into a load-lock chamber. The load lock is designed for exchanging the sample without breaking the ultra-high vacuum (UHV) of the imaging system. When performing the electrostatic imaging experiments, the sample holder is transferred into the main chamber and brought in contact with the repeller plate to make sure they are at the same electric potential. The main chamber, maintained at , contains a stack of three cylindrically symmetric plates, labelled repeller (R), extractor (E) and ground (G) electrodes in Fig. 1. They are arranged in parallel, separated by 15 mm, and, with applied potentials, serve as the electrostatic lens. This is followed by a m drift tube, which ends with a detector assembly consisting of a double micro-channel plate (MCP, Chevron configuration), a phosphor screen (P46), and a CMOS camera (Optronis CL6002) for recording images of the electron distributions. The full configuration is shielded against stray fields by a µ-metal tube. A 800-nm 45-fs Ti:Sapphire laser amplifier with a 3-kHz repetition rate was used to illuminate the sample at a glancing incidence angle of , with a laser focal intensity spot size of root-mean-square (RMS) on the sample. In our experiments, single-shot electron-distribution images are read out at a repetition rate of 1 kHz, limited by the camera-acquisition frame rate. The average number of electrons emitted per pulse is on the order of one or less, thus, space charge effects, which were reported before Petite et al. (1992), are excluded.
To calibrate and optimize the spectrometer field configuration for both SMI and VMI, a fixed potential of -6 kV was applied to both the repeller plate and the sample holder while the ground plate being grounded; see supplementary information for details. While scanning the extractor voltage from -5.8 kV to -4.3 kV, we observed the focusing behavior of the electron bunch depending on the extractor voltage Müller et al. (2015). This behavior is revealed by the RMS of the electron bunch size in - and -directions on the detector shown in Fig. S1 (supplementary information). The SIMION Scientific Instrument Services Inc., USA (2011) software is used to simulate the electric field configuration and to calculate the electron trajectories from a 2D Gaussian source with and , yielding an RMS behavior curve that fits the experimental results. SMI is obtained at the minimum RMS size, i. e., at an extractor voltage of -5560 V, corresponding to a magnification factor of 7.5. From the measured SMI data, the RMS size is analyzed to be and , which is in good agreement with the simulated electron bunch size and the laser focal spot size. The extractor voltage for VMI conditions is found at -4790 V according to the SIMION simulations and the calibration factor of velocity-per-pixel is on the detector. The details of the simulations and experimental calibration are described in the supplementary material. In order to minimize field distortions, the sample front surface should be placed in the same plane as the repeller front surface. However, samples of different thickness lead to a position offset with reference to the repeller front, which strongly influences the field configuration. Therefore, the extractor voltage for operating in SMI and VMI mode are optimized by voltage adjustments of V and V, respectively, to correct for a position offset of mm. In this case, re-adjusting the potential right after exchanging a sample is necessary, but quick (vide infra).
III Experimental Results
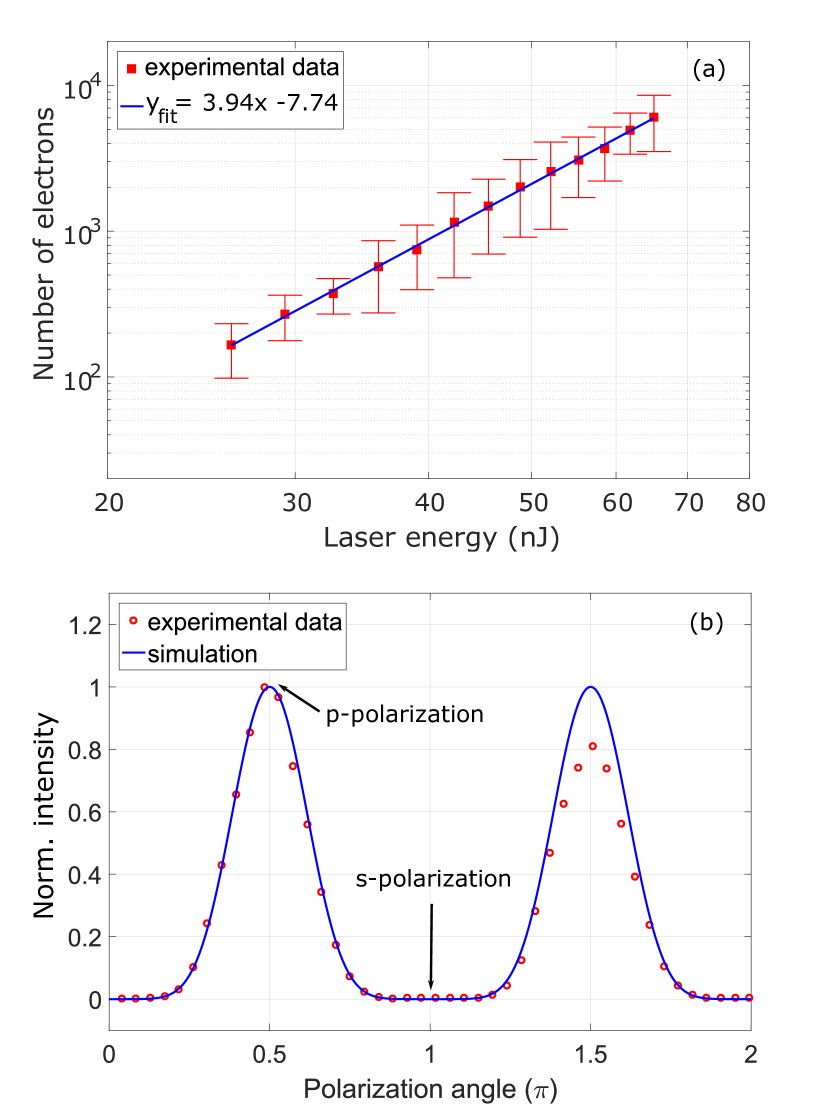
Fig. 2 a shows the photoemitted electron yield as a function of incident laser energy on a logarithmic scale. The data, shown in red, were measured and averaged over four measurement sequences and the error bars show the corresponding standard deviations of the photoemitted electron counts due to laser fluctuations. The blue line reflects the results of a linear regression analysis that yielded a slope of , with a standard error of and a coefficient of determination .
The Fowler-Dubridge model for the n-th order photoelectric current can be written in a generalized form as Bechtel et al. (1975)
| (1) |
where is the number of photons, is the Planck constant, is the Richardson coefficient, the reflection coefficient from the metal surface, the incident light intensity, the metal work function, and the Fowler function.
The experimental data in Fig. 2 a follow a power law with a slope of , in agreement with a 4-photon emission process according to the nonlinear photoelectric effect, which indicates that simultaneous absorption of 4 photons (photon energy 1.55 eV at 800 nm) has to take place to overcome the metal work function Damascelli et al. (1996), which is reported as 5.31–5.47 eV for Au Lide (2003). As shown in Fig. 2 b, varying the laser polarization angle, the photoemitted electron intensity reaches a maximum when the laser is p-polarized (electric field normal to the sample surface), and appears minimum when it is s-polarized. For multiphoton emission at a certain incident light intensity, the electron yield mostly depends on the bulk absorption coefficient, expressed as term in the Fowler-Dubridge model Damascelli et al. (1996). is calculated by Fresnel equations with and Polyanskiy at an incidence angle of . The plotted curve fits very well with the data, which proves again the 4-th order multiphoton process.
A velocity-map image from a planar Au surface is shown in the inset of Fig. 3 a. The image was integrated over laser shots with an energy of nJ, corresponding to a peak intensity of on the cathode. Generally, in laser-induced multiphoton emission the emitted electron velocity vectors exhibit cylindrical symmetry along the direction normal to the sample surface. Therefore, the center of mass (COM) of the image is set as coordinate origin. The corresponding angle-integrated radial velocity distribution of the projected electrons is plotted in Fig. 3 a as black line. To allow for comparison with the theoretical model, the 3D velocity/energy distribution is required. Introducing a novel mathematical method similar to the Onion Peeling algorithm Dasch (1992), we are able to reconstruct the momentum/energy distribution when the angular distribution of emitted electrons is known. Fortunately, for multiphoton emission, the intensity of photoemitted electrons at various angles can be derived from the Berglund-Spicer model Berglund and Spicer (1964b) as
| (2) |
where is the optical absorption coefficient, is the electron-electron scattering length for an electron of kinetic energy , and expresses the electron analogy of refraction at the vacuum-metal boundary Dowell and Schmerge (2009). For a small (our case, ), i. e., an incident photon energy comparable to the work function , the equation can be simplified to Poole et al. (1972-1973); Pei and Berglund (2002). Therefore, the 3D velocity distribution can be reconstructed as is described in detail in the supplementary information.
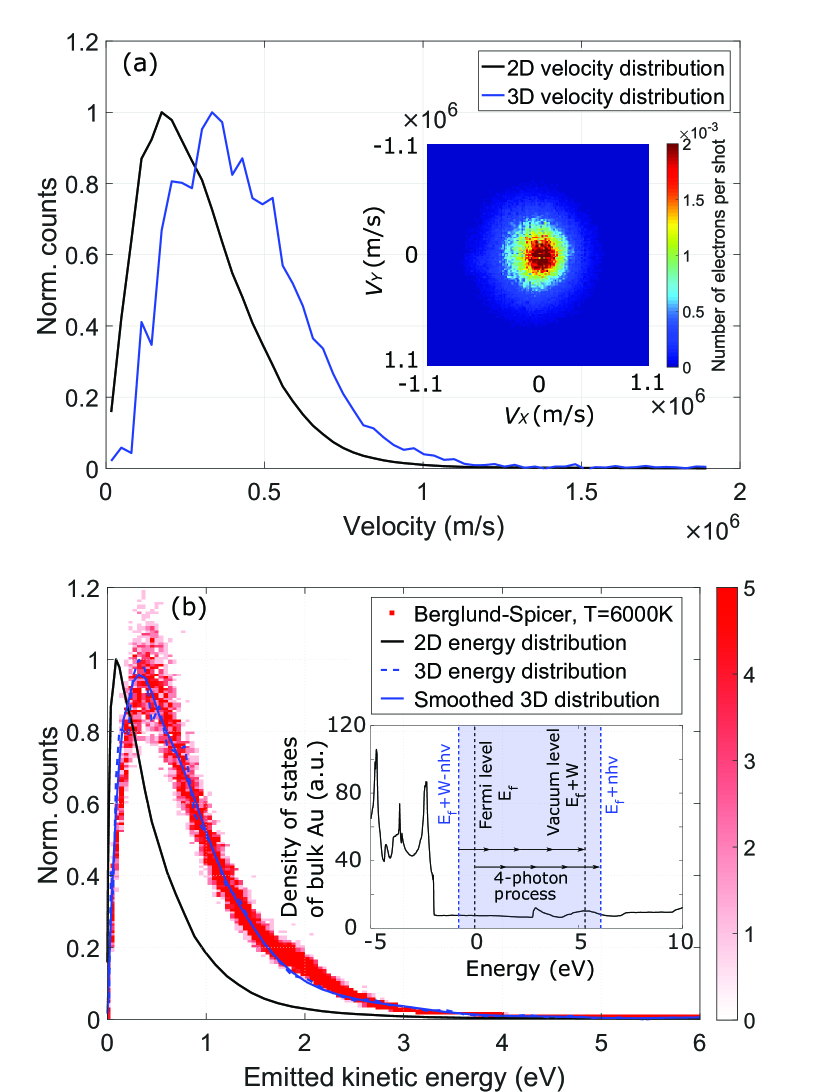
The reconstructed velocity distribution is plotted as blue line in Fig. 3 a, and the smoothed energy distribution shown in Fig. 3 b. The energy distribution of the emitted electrons shows an energy spread of eV, which corresponds to the energy difference between a four-1.55 eV-photon excitation and the Au work function of 5.31 eV.
IV Discussion
The Berglund-Spicer three-step model is employed as the analytic expression for the kinetic energy distribution of the photoemitted electrons. As the model is derived for single-photon emission, it is implied in our analysis that the electrons at an initial energy state absorb sufficient number of photons instantaneously, rather than sequentially, to be pumped to a higher energy state . The kinetic energy distribution for single-photon emission Berglund and Spicer (1964a) is adapted to multiphoton emission as
| (3) |
where is the Fermi energy of Au. for is a semiclassical threshold function. is the electron-electron scattering length, which is proportional to . The absorption efficient is calculated from the extinction coefficient as and taken as a constant independent of electron energy. is a correction factor related to both and , which is between 0.5 to 1. To evaluate Equation 3, the probability of a photon carrying energy is calculated from the measured laser spectrum in the range from 760 to 850 nm. To overcome the barrier of 5.31 eV, an electron is assumed to always absorb four photons (). Absorption of various photon energies leads to slight difference of the quantum yield at a certain emitted kinetic energy as one can see from Fig. 3 b. The main consequence of absorbing photons with various energies is the spectral/intensity broadening, which is illustrated by the color coding in Fig. 3 b, but with an essentially unchanged spectral shape. We mention that (3) only includes the emitted electrons that experience none or one electron-electron scattering process during transport to the metal-vacuum surface. Electron-electron scattering is dominant over electron-phonon scattering and reshapes the energy distribution on a fast timescale, i. e., during an ultrashort laser pulse.
The density of states (DOS), i. e., the number of states available for electrons at a certain energy level, is shown in the inset of Fig. 3 b. During the photoemission process, an energy state is first occupied by an electron, which is then excited to a higher energy state , which was empty. As fermions, electrons obey the Pauli exclusion principle. In thermal equilibrium, the possibility of electrons to occupy an available energy state is given by the Fermi-Dirac (FD) distribution . However, excitation of a metal with ultrashort strong laser pulses initially creates a nonequilibrium distribution that then thermalizes via electron-electron scattering towards a Fermi-Dirac distribution. In gold, this thermalization occurs on a timescale of hundreds of femtoseconds Fann et al. (1992a, b). Subsequently, the electrons cool down by dissipating energy into the lattice via electron-phonon scattering occurring on a longer picosecond timescale. In the following discussion, where we employ the Berglund-Spicer model in our analysis, we assume that the electronic system can be described by a Fermi-Dirac distribution with quasi-equilibrium electron temperature . Hence, the appropriate densities of states and FD distributions are multiplied with the energy distribution as , resulting in the spectrum shown in Fig. 3 b.
The best fit with our reconstructed experimental energy distribution is obtained for an electron temperature of 6000 K. This is comparable to previously observed electron temperatures of 7000 K in surface-enhanced multiphoton emission from copper Aeschlimann et al. (1995). The high energy tail of the spectrum indicates that very “hot” electrons are photoemitted by the femtosecond laser pulse, consistent with the high excess energy deposited into the electronic system. For the energy tail up to 4 eV, except for the high temperature, another process that might need to be taken into account is above-threshold photoemission (ATP), i. e., the absorption of one (or more) extra photon, occurring together with the four-photon process Banfi et al. (2005). Moreover, for our experimental conditions, we can neglect tunnel ionization, which could result in high energy emitted electrons. Since we estimate the absorbed peak intensity for the recorded image, Fig. 3 a, to be taking into account Fresnel losses. This implies a Keldysh parameter , which is well in the multiphoton emission regime; here, is the ponderomotive energy with laser wavelength and intensity .
Since both, the measured quantum yield and the momentum distribution, are in quantitative agreement with the Fowler-Dubridge and Berglund-Spicer models, as one would expect from multiphoton emission from a planar Au cathode, the VMI spectrometer has successfully been implemented as a tool to characterize the photoemitted electrons from cathodes, especially to directly measure the transverse momentum distribution. Assuming there is no correlation between the location of emission and the transverse momentum, the RMS normalized emittance is defined as Dowell and Schmerge (2009)
| (4) |
where is the spatial spread and is the momentum spread of the electron bunch. From the velocity map image shown in the inset of Fig. 3 a, the RMS normalized emittance of the planar Au photocathode irradiated by 45-fs 800-nm laser pulses with a focal spot size of and is characterized to be and in the and -directions, respectively. To decrease the intrinsic normalized emittance, in principle one needs to decrease either the emission area or the momentum spread. The former can be intuitively decreased by an extremely tight focal spot size or sharp tip surface, which geometrically limits the emission area. For reducing of the momentum/energy spread, choosing a proper material with appropriate work function and irritated by a laser beam with matched photon energy, for example the photoemission of Cu under 266-nm laser irradiation, is expected to help. Further reduction is expected when entering the strong-field emission regime, where the electrons are considered to adiabatically tunnel through the surface barrier with zero initial momentum and are then driven by the instantaneous optical field Corkum (1993); Krüger et al. (2011). Under these conditions electrons are expected to be emitted with a relatively small divergence angle and significantly lower transverse momentum spread.
V Conclusions
We demonstrated an electron spectrometer with VMI and SMI capabilities, which intuitively allows for the measurement of the normalized transverse emittance of photocathodes. i. e., through the direct observation of the transverse position and momentum distributions. We verified and benchmarked the capabilities of the instrument in a proof-of-concept experiment, in which we characterized the photoemitted electrons from a 400 nm thin Au film. For ultrashort femtosecond laser pulses with a peak intensity lower than at 800 nm central wavelength, which would correspond to , multiphoton emission is shown to be the dominant contribution to the entire electron current.
We intend to utilize this new setup for the emittance characterization of electron bunches strong-field emitted from nanotips under optical field irradiation. Such devices should show superior emittance Herink et al. (2012); Tsujino et al. (2016). Moreover, the small radius of the sharp tips realize a field enhancement, which dramatically lowers the laser power required for entering the strong-field regime and thus avoids damaging of the cathodes. Our ongoing work aims at the characterization of electron emission from nanostructured array emitters, which are predicted to provide high-current low-emittance coherent electron bunches in the strong-field emission regime.
VI Acknowledgments
We gratefully acknowledge helpful discussions with Jens S. Kienitz and Nele Müller, the expert technical support of Thomas Tilp, and Nicolas Tancogne-Dejean for providing the computed density-of-states data of bulk Au.
Besides DESY, this work has been supported by the excellence cluster “The Hamburg Center for Ultrafast Imaging – Structure, Dynamics and Control of Matter at the Atomic Scale” (CUI, DFG-EXC1074), the priority program QUTIF (SPP1840 SOLSTICE) of the Deutsche Forschungsgemeinschaft, the European Research Council under the European Union’s Seventh Framework Programme (FP7/2007-2013) through the Consolidator Grant COMOTION (ERC-Küpper-614507) and the Synergy Grant AXSIS (ERC-Kaertner-609920), the Helmholtz Association “Initiative and Networking Fund”, and the accelerator on a chip program (ACHIP) funded by the Betty and Gordon Moore foundation.
References
- Chapman et al. (2006) H. N. Chapman, A. Barty, M. J. Bogan, S. Boutet, S. Frank, S. P. Hau-Riege, S. Marchesini, B. W. Woods, S. Bajt, W. H. Benner, London W. A., E. Plönjes, M. Kuhlmann, R. Treusch, S. Düsterer, T. Tschentscher, J. R. Schneider, E. Spiller, T. Möller, C. Bostedt, M. Hoener, D. A. Shapiro, K. O. Hodgson, D. van der Spoel, F. Burmeister, M. Bergh, C. Caleman, G. Huldt, M. M. Seibert, F. R. N. C. Maia, R. W. Lee, A. Szöke, N. Timneanu, and J. Hajdu, “Femtosecond diffractive imaging with a soft-x-ray free-electron laser,” Nat. Phys. 2, 839–843 (2006).
- Barty et al. (2008) Anton Barty, Sebastien Boutet, Michael J. Bogan, Stefan Hau-Riege, Stefano Marchesini, Klaus Sokolowski-Tinten, Nikola Stojanovic, Ra’anan Tobey, Henri Ehrke, Andrea Cavalleri, Stefan Düsterer, Matthias Frank, Sǎsa Bajt, Bruce W. Woods, M. Marvin Seibert, Janos Hajdu, Rolf Treusch, and Henry N. Chapman, “Ultrafast single-shot diffraction imaging of nanoscale dynamics,” Nat. Photon. 2, 415 (2008).
- Young et al. (2010) L Young, E P Kanter, Bertold Kraessig, Y Li, A M March, S T Pratt, R Santra, S. H. Southworth, N Rohringer, L F DiMauro, Gilles Doumy, C A Roedig, N Berrah, L Fang, M Hoener, P H Bucksbaum, J P Cryan, S Ghimire, J M Glownia, D A Reis, J D Bozek, C Bostedt, and M Messerschmidt, “Femtosecond electronic response of atoms to ultra-intense x-rays,” Nature 466, 56 (2010).
- Barty et al. (2012) Anton Barty, Carl Caleman, Andrew Aquila, Nicusor Timneanu, Lukas Lomb, Thomas A White, Jakob Andreasson, David Arnlund, Saša Bajt, Thomas R M Barends, Miriam Barthelmess, Michael J Bogan, Christoph Bostedt, John D Bozek, Ryan Coffee, Nicola Coppola, Jan Davidsson, Daniel P Deponte, R Bruce Doak, Tomas Ekeberg, Veit Elser, Sascha W Epp, Benjamin Erk, Holger Fleckenstein, Lutz Foucar, Petra Fromme, Heinz Graafsma, Lars Gumprecht, Janos Hajdu, Christina Y Hampton, Robert Hartmann, Andreas Hartmann, Günter Hauser, Helmut Hirsemann, Peter Holl, Mark S Hunter, Linda Johansson, Stephan Kassemeyer, Nils Kimmel, Richard A Kirian, Mengning Liang, Filipe R N C Maia, Erik Malmerberg, Stefano Marchesini, Andrew V Martin, Karol Nass, Richard Neutze, Christian Reich, Daniel Rolles, Benedikt Rudek, Artem Rudenko, Howard Scott, Ilme Schlichting, Joachim Schulz, M Marvin Seibert, Robert L Shoeman, Raymond G Sierra, Heike Soltau, John C H Spence, Francesco Stellato, Stephan Stern, Lothar Strüder, Joachim Hermann Ullrich, X Wang, Georg Weidenspointner, Uwe Weierstall, Cornelia B Wunderer, and Henry N Chapman, “Self-terminating diffraction gates femtosecond x-ray nanocrystallography measurements,” Nat. Photon. 6, 35–40 (2012).
- Rudek et al. (2012) Benedikt Rudek, Sang-Kil Son, Lutz Foucar, Sascha-W. Epp, Benjamin Erk, Robert Hartmann, Marcus Adolph, Robert Andritschke, Andrew Aquila, Nora Berrah, Christoph Bostedt, Nicola Bozek, Johnand Coppola, Frank Filsinger, Hubert Gorke, Tais Gorkhover, Heinz Graafsma, Lars Gumprecht, Andreas Hartmann, Günter Hauser, Sven Herrmann, Helmut Hirsemann, Peter Holl, Andre Hömke, Loic Journel, Christian Kaiser, Nils Kimmel, Faton Krasniqi, Kai-Uwe Kühnel, Michael Matysek, Marc Messerschmidt, Danilo Miesner, Thomas Möller, Robert Moshammer, Kiyonobu Nagaya, Bjorn Nilsson, Guillaume Potdevin, Daniel Pietschner, Christian Reich, Daniela Rupp, Gerhard Schaller, Ilme Schlichting, Carlo Schmidt, Florian Schopper, Sebastian Schorb, Claus-Dieter Schröter, Joachim Schulz, Marc Simon, Heike Soltau, Lothar Strüder, Kiyoshi Ueda, Georg Weidenspointner, Robin Santra, Joachim Ullrich, Artem Rudenko, and Daniel Rolles, “Ultra-efficient ionization of heavy atoms by intense x-ray free-electron laser pulses,” Nat. Photon. 6, 858–865 (2012).
- Barty et al. (2013) Anton Barty, Jochen Küpper, and Henry N. Chapman, “Molecular imaging using x-ray free-electron lasers,” Annu. Rev. Phys. Chem. 64, 415–435 (2013).
- Erk et al. (2014) Benjamin Erk, Rebecca Boll, Sebastian Trippel, Denis Anielski, Lutz Foucar, Benedikt Rudek, Sascha W Epp, Ryan Coffee, Sebastian Carron, Sebastian Schorb, Ken R Ferguson, Michele Swiggers, John D Bozek, Marc Simon, Tatiana Marchenko, Jochen Küpper, Ilme Schlichting, Joachim Ullrich, Christoph Bostedt, Daniel Rolles, and Artem Rudenko, “Imaging charge transfer in iodomethane upon x-ray photoabsorption.” Science 345, 288–291 (2014).
- Huang and Kim (2007) Zhirong Huang and Kwang Je Kim, “Review of x-ray free-electron laser theory,” Phys. Rev. ST Accel. Beams 10, 1–26 (2007).
- Ihee et al. (2001) H Ihee, VA Lobastov, UM Gomez, BM Goodson, R Srinivasan, CY Ruan, and Ahmed H Zewail, “Direct imaging of transient molecular structures with ultrafast diffraction,” Science 291, 458–462 (2001).
- Siwick et al. (2003) B J Siwick, J R Dwyer, R E Jordan, and R J Dwayne Miller, “An atomic-level view of melting using femtosecond electron diffraction,” Science 302, 1382–1385 (2003).
- Gulde et al. (2014) Max Gulde, Simon Schweda, Gero Storeck, Manisankar Maiti, Hak Ki Yu, Alec M Wodtke, Sascha Schäfer, and Claus Ropers, “Ultrafast low-energy electron diffraction in transmission resolves polymer/graphene superstructure dynamics,” Science 345, 200–204 (2014).
- Yang et al. (2016) Jie Yang, Markus Guehr, Xiaozhe Shen, Renkai Li, Theodore Vecchione, Ryan Coffee, Jeff Corbett, Alan Fry, Nick Hartmann, Carsten Hast, Kareem Hegazy, Keith Jobe, Igor Makasyuk, Joseph Robinson, Matthew S Robinson, Sharon Vetter, Stephen Weathersby, Charles Yoneda, Xijie Wang, and Martin Centurion, “Diffractive imaging of coherent nuclear motion in isolated molecules,” Phys. Rev. Lett. 117, 153002 (2016).
- Krüger et al. (2011) Michael Krüger, Markus Schenk, and Peter Hommelhoff, “Attosecond control of electrons emitted from a nanoscale metal tip.” Nature 475, 78–81 (2011).
- Herink et al. (2012) G Herink, D R Solli, M Gulde, and C Ropers, “Field-driven photoemission from nanostructures quenches the quiver motion.” Nature 483, 190–193 (2012).
- Mustonen et al. (2011) Anna Mustonen, Paul Beaud, Eugenie Kirk, Thomas Feurer, and Soichiro Tsujino, “Five picocoulomb electron bunch generation by ultrafast laser-induced field emission from metallic nano-tip arrays,” Astrophys. Lett. & Comm. 99, 103504 (2011).
- Putnam et al. (2016) William P Putnam, Richard G Hobbs, Phillip D Keathley, Karl K Berggren, and Franz X Kärtner, “Optical-field-controlled photoemission from plasmonic nanoparticles,” Nat. Phys. 13, 335–339 (2016).
- Tsujino et al. (2016) Soichiro Tsujino, Prat Das Kanungo, Mahta Monshipouri, Chiwon Lee, and R.J. Dwayne Miller, “Measurement of transverse emittance and coherence of double-gate field emitter array cathodes,” Nat. Commun. 7, 13976 (2016).
- Kärtner et al. (2016) F. X. Kärtner, F. Ahr, A. L. Calendron, H. Çankaya, S. Carbajo, G. Chang, G. Cirmi, K. Dörner, U. Dorda, A. Fallahi, A. Hartin, M. Hemmer, R. Hobbs, Y. Hua, W. R. Huang, R. Letrun, N. Matlis, V. Mazalova, O. D. Mücke, E. Nanni, W. Putnam, K. Ravi, F. Reichert, I. Sarrou, X. Wu, A. Yahaghi, H. Ye, L. Zapata, D. Zhang, C. Zhou, R. J D Miller, K. K. Berggren, H. Graafsma, A. Meents, R. W. Assmann, H. N. Chapman, and P. Fromme, “Axsis: Exploring the frontiers in attosecond x-ray science, imaging and spectroscopy,” Nucl. Instrum. Meth. A 829, 24–29 (2016).
- Berglund and Spicer (1964a) C. N. Berglund and W. E. Spicer, “Photoemission studies of copper and silver: Theory,” Phys. Rev. 136, A1030 (1964a).
- Berglund and Spicer (1964b) C. N. Berglund and W. E. Spicer, “Photoemission studies of copper and silver: Experiment,” Phys. Rev. 136, A1044–A1064 (1964b).
- Krolikowski and Spicer (1969) W. F. Krolikowski and W. E. Spicer, “Photoemission studies of the noble metals. i. copper,” Phys. Rev. B 185, 882–900 (1969).
- Krolikowski and Spicer (1970) W. F. Krolikowski and W. E. Spicer, “Photoemission studies of the noble metals. ii. gold,” Phys. Rev. B 1, 478–487 (1970).
- Eppink and Parker (1997) André T. J. B. Eppink and David H. Parker, “Velocity map imaging of ions and electrons using electrostatic lenses: Application in photoelectron and photofragment ion imaging of molecular oxygen,” Rev. Sci. Instrum. 68, 3477–3484 (1997).
- Chichinin et al. (2009) A I Chichinin, K H Gericke, S Kauczok, and C Maul, “Imaging chemical reactions — 3d velocity mapping,” Int. Rev. Phys. Chem. 28, 607–680 (2009).
- Stei et al. (2013) M. Stei, J. von Vangerow, R. Otto, A. H. Kelkar, E. Carrascosa, T. Best, and R. Wester, “High resolution spatial map imaging of a gaseous target,” J. Chem. Phys. 138, 214201 (2013).
- Petite et al. (1992) Guillaume Petite, Pierre Agostini, Rusty Trainham, Eric Mevel, and Philippe Martin, “Electron emission from metals under laser irradiation,” Phys. Rev. B 45, 12 210 – 12 217 (1992).
- Müller et al. (2015) Nele L. M. Müller, Sebastian Trippel, Karol Długołęcki, and Jochen Küpper, “Electron gun for diffraction experiments on controlled molecules,” J. Phys. B 48, 244001 (2015), arXiv:1507.02530 [physics] .
- Scientific Instrument Services Inc., USA (2011) Scientific Instrument Services Inc., USA, “Simion 8.1,” (2011), URL: http://simion.com.
- Bechtel et al. (1975) J. H. Bechtel, W. L. Smith, and N. Bloembergen, “Four-photon photoemission from tungsten,” Opt. Comm. 13, 56–59 (1975).
- Damascelli et al. (1996) A Damascelli, G Gabetta, A Lumachi, L Fini, and F Parmigiani, “Multiphoton electron emission from Cu and W: An angle-resolved study.” Phys. Rev. B 54, 6031–6034 (1996).
- Lide (2003) David R. Lide, CRC Handbook of Chemistry and Physics, 84th ed. (CRC Press, 2003).
- (32) Mikhail N. Polyanskiy, “Refractive index database,” https://refractiveindex.info, accessed on 24. July 2017.
- Dasch (1992) Cameron J. Dasch, “One-dimensional tomography: a comparison of Abel, onion-peeling, and filtered backprojection methods,” Applied Optics 31, 1146 (1992).
- Dowell and Schmerge (2009) David H. Dowell and John F. Schmerge, “Quantum efficiency and thermal emittance of metal photocathodes,” Phys. Rev. ST Accel. Beams 12, 074201 (2009).
- Poole et al. (1972-1973) R. T. Poole, R. C. G. Leckey, J. G. Jenkin, and J. Liesegang, “Photoelectron angular distribution from gold,” J. Elec. Spec. Rel. Phen. 2, 371–376 (1972-1973).
- Pei and Berglund (2002) Zeting Pei and C. Neil Berglund, “Angular distribution of photoemission from gold thin films,” Jpn. J. Appl. Phys. 41, L52–L54 (2002).
- Fann et al. (1992a) W. S. Fann, R. Storz, H. W K Tom, and J. Bokor, “Direct measurement of nonequilibrium electron-energy distributions in sub-picosecond laser-heated gold films,” Phys. Rev. Lett. 68, 2834–2837 (1992a).
- Fann et al. (1992b) W. S. Fann, R. Storz, H. W K Tom, and J. Bokor, “Electron thermalization in gold,” Phys. Rev. B 46, 13592–13595 (1992b), arXiv:1011.1669 [physics] .
- Aeschlimann et al. (1995) M. Aeschlimann, C. A. Schmuttenmaer, H. E. Elsayed-Ali, R. J. D. Miller, J. Cao, Y. Gao, and D. A. Mantell, “Observation of surface enhanced multiphoton photoemission from metal surfaces in the short pulse limit,” J. Chem. Phys. 102, 8606–8613 (1995).
- Banfi et al. (2005) Francesco Banfi, Claudio Giannetti, Gabriele Ferrini, Gianluca Galimberti, Stefania Pagliara, Daniele Fausti, and Fulvio Parmigiani, “Experimental evidence of above-threshold photoemission in solids,” Phys. Rev. Lett. 94, 037601 (2005), arXiv:1201.3049 [physics] .
- Corkum (1993) P. B. Corkum, “Plasma perspective on strong-field multiphoton ionization,” Phys. Rev. Lett. 71, 1994–1997 (1993).