11email: orlando@astropa.inaf.it 22institutetext: European Space Agency, 8-10 rue Mario Nikis, 75738 Paris cedex 15, France 33institutetext: Universität Hamburg, Hamburger Sternwarte, Gojenbergsweg 112, 21029 Hamburg, Germany
Fifteen years in the high-energy life of the solar-type star HD 81809
Abstract
Context. The modulation of the activity level of solar-like stars is commonly revealed by cyclic variations in their chromospheric indicators, such as the Ca ii H&K “-index”, similarly to what is observed in our Sun. However, while the variation of solar activity is reflected also in the cyclical modulation of its coronal X-ray emission, a similar behavior has only been discovered in a few stars other than the Sun.
Aims. The data set of the long-term XMM-Newton monitoring program of HD 81809 is analyzed to study its X-ray cycle, to investigate if the latter is related to the chromospheric one, to infer the structure of the corona of HD 81809, and to explore if the coronal activity of HD 81809 can be ascribed to phenomena similar to the solar ones and, therefore, considered an extension of the solar case.
Methods. We analyze the observations of HD 81809 performed with XMM-Newton with a regular cadence of 6 months from 2001 to 2016 and representing one of the longest available observational baseline ( yr) for a solar-like star with a well-studied chromospheric cycle (with a period of yr). We investigate the modulation of coronal luminosity and temperature and its relation with the chromospheric cycle. We interpret the data in terms of a mixture of solar-like coronal regions, adopting a methodology originally proposed to study the Sun as an X-ray star.
Results. The observations show a well-defined regular cyclic modulation of the X-ray luminosity that reflects the activity level of HD 81809. The data covers approximately two cycles of coronal activity; the modulation has an amplitude of a factor of (excluding evident flares, as in the June 2002 observation) and a period of yr, consistent with that of the chromospheric cycle. We demonstrate that the corona of HD 81809 can be interpreted as an extension of the solar case and it can be modeled with a mixture of solar-like coronal regions along the whole cycle. The activity level is mainly determined by a varying coverage of very bright active regions, similar to cores of active regions observed in the Sun. Evidence of unresolved significant flaring activity is present especially in proximity of cycle maxima.
Key Words.:
Stars: activity – Stars: coronae – Stars: individual (HD81809) – X-rays: stars1 Introduction
Cyclic modulations in the activity level of late-type stars are commonly detected through chromospheric indicators, as the Ca ii H&K activity indicator (the “-index”). The long-term monitoring of the Ca ii -index measured in a large sample of stars with the Mt. Wilson 100-inch telescope has shown that solar-like cycles (with periods in the range yr) are present in many ( %) main-sequence stars with spectral types between F and M (Baliunas et al. 1995). Most often the cycles are detected in intermediate-activity stars, whereas less active stars show no evident variability, suggesting that they are in a “Maunder minimum”-like state (i.e. very small long-term variability), and the most active stars are dominated by irregular variability rather than by cyclic modulation. The Sun fits well in this sample with the well known 11-yr cycle, evident in the Ca ii -index (White et al. 1992).
In the Sun, the changes in its activity level are also evident through a cyclic variation in the coronal emission: the solar X-ray luminosity follows a cycle with the same periodicity as the chromospheric one and an amplitude between one and two orders of magnitude in the [] keV band (e.g. Orlando et al. 2001; Judge et al. 2003). It is worth to mention that solar cycles are similar to each other but not identical, neither in duration, nor in magnitude, and long-term changes do occur. In late-type stars other than the Sun, cyclical variations in the coronal emission have been found in recent years and only for few cases. The main reason is that typical targets of X-ray observations have been stars with a high activity level which, however, show modest (if any) amounts of long-term variability with no evidence of cyclic modulation (e.g. Stern 1998; Schmitt & Liefke 2004). A first hint that cyclic chromospheric activity implies cyclic coronal activity was found - on the base of statistical arguments - in low-activity stars by using the ROSAT all-sky survey (RASS) (Hempelmann et al. 1996). To date, clear cyclic variations in the coronal emission have been detected in three binary stars: 61 Cyg A (Hempelmann et al. 2003, 2006), Cen (Robrade et al. 2005, 2012; Wargelin et al. 2017), and HD 81809 (Favata et al. 2004 - Paper I - Favata et al. 2008 - Paper II). More recently a cyclic modulation in X-rays which follows the contemporaneous chromospheric cycle was also discovered in the young ( Myr) late-type star Hor (Sanz-Forcada et al. 2013).
These stars provide the best available data set to investigate the cyclical variations in the coronal emission of late-type stars. One of the longest available observational baseline ( yr) is that for HD 81809 which is also the system showing the clearest evidence of a cyclical modulation in its coronal emission (Paper II). HD 81809, at a nominal distance of pc, is known to be a binary system with an orbital period of yr and a maximum separation of arcsec (Pourbaix 2000; Tokovinin et al. 2015; for more details see Paper I). The two components have spectral types G2 and G9, and apparent magnitudes and , respectively; their masses are M⊙ and M⊙, respectively. Both components are slow rotators, with km s-1 (Soderblom 1982). HD 81809 is generally considered to have an age close to that of the Sun. However, Favata et al. (2004) have suggested that the stars are not on the main sequence, but rather subgiants. Although HD 81809 is binary in nature, this does not hamper studies on the cyclic modulation of coronal emission: the large physical separation of the two stars makes tidal effects negligible, and the low rotational velocity confirms that this is a non-interacting system. The very clear cyclical behavior of HD 81809 in the Ca ii -index (as evident from the Mt. Wilson program data; Baliunas et al. 1995) and in X-rays (see Paper II) points to the activity being dominated by one of the two components.
The chromospheric cycle of HD 81809 has a regular modulation similar to that of the Sun but with a shorter period of 8.2 yr. The analysis of the XMM-Newton data from 2001 to 2007 (thus covering six years of the cycle) discussed in Paper II has shown that a well-defined cycle seems to be present also in X-rays and appears to follow that in the Ca ii -index. Our previous analysis did not allow us to constrain accurately the amplitude of the X-ray cycle because the only maximum recorded was not well sampled and one of the data at the maximum was most likely affected by a flaring event which led to an overestimation of the flux. We derived an average luminosity approximately one order of magnitude higher than in the Sun. The previous analysis covered most (but not all) of one cycle describing a maximum in 2002 and a minimum in 2005. However, no evidence of a second maximum was present in the data and no indication that the next cycle has similar duration and amplitude as the first one. Here we analyze all available XMM-Newton observations, from 2001 to 2016, thus covering almost two coronal cycles. We compare the two cycles exploring possible significant changes (if any) and interpret the data in terms of a mixture of coronal regions observed in the Sun, adopting a methodology extensively applied to study the “Sun as a star” (Orlando et al. 2000; Peres et al. 2000). In Sect. 2, we present the XMM-Newton data; in Sect. 3 we describe the data analysis and discuss the results; and finally in Sect. 4 we draw our conclusions.
2 Observations
HD 81809 has been selected as target to investigate cyclic variations in the coronal emission because it has: (i) enough X-ray flux at Earth to allow an accurate analysis of the data, and (ii) a well defined cycle in the Ca ii -index (from Mt. Wilson program data; Baliunas et al. 1995) with a period of 8.2 yr which allows to study few cycles in a reasonable time. The strategy to sample the cyclic behavior of HD 81809 was based on the expected cycle duration of 8.2 yr and considered two observations per year, spaced by 6 months (see Table 1). Since April 2001, the observations have been executed regularly each year in the Spring (between April and June) and in the Fall (between September and November), with the only exception of the Spring 2006 season, due to a technical problem that prevented the observation from being carried out. The observations have different duration (ranging between 6 and 30 ks; see Table 1), because the exposure time has been adapted along the program to follow the variation in luminosity of the target. All observations up to May 2003 were taken with the medium filter; all the others are taken with the thick filter (this is due to a policy change of the observatory).
3 Analysis
All data sets are processed homogeneously using the SAS package. As a first step, we remove high background time intervals from the observations. The data collected on April 2001 is rejected from the analysis because the observation is affected by a very high background level (much higher than in the other observations) which, coupled with the short duration of the observation, resulted in a high noise level which could not be filtered out. Then, from the processed data, we extract lightcurves and spectra. We estimate the parameters characterizing the spectra (i.e. effective temperature and emission measure) by fitting simultaneously pn and MOS spectra, using XSPEC, with thermal plasma radiative loss models. To this end, we adopt Astrophysical Plasma Emission Code (APEC) models, considering the metal abundance frozen at , as in Papers I and II. As discussed in Paper II, the interstellar absorption is consistent with a zero value, and we do not include it in the fit.
3.1 Characterizing the coronal plasma using model parameter estimation
The spectra are first matched to an isothermal model, following the approach of Paper II. This allows a consistent comparison of our results with those of the previous papers (Papers I and II). We find that the results of the fit during the two cycles are similar to those found in Paper II, with a modest range of variability in best-fit temperature and a good correlation between temperature and stellar X-ray luminosity. Most of the spectra are well fit with a single-temperature model; however, in some cases, the of the fit yields a very low probability as, for instance, for the June 2002 data set when, most likely, a bright flare was present (see Paper II for more details). In the light of this, we explore the possibility to fit the spectra with more complex models that included two temperatures plasma components. In the fit, the temperatures and emission measures are allowed to vary and all the spectra are well fit (including the June 2002 spectrum). Table 1 reports the spectral parameters resulting from the fit for the complete observation timeline from November 2001 to October 2016. The Table reports also the emission measure-weighted temperature, , defined as
| (1) |
where and are the temperatures of the two isothermal components and EM1 and EM2 are their emission measures.
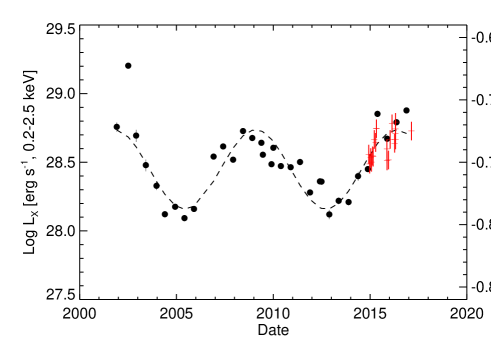
For all spectra, we compute the X-ray luminosity in the keV band. Figure 1 shows the light curve of the X-ray luminosity of HD 81809 together with a log-sinusoidal fit to the data (dashed line in the figure). On average the observations show a long-term variability in good agreement with the cyclical behavior of HD 81809 in the Ca ii -index (see Baliunas et al. 1995 and Paper II). The coherent behavior of this variability is consistent with a regular cyclic modulation in the coronal activity level. Our data cover approximately two cycles of coronal activity. A first maximum occurred approximately in 2001, although a significant level of uncertainty is present given that this maximum has not been properly sampled by our observations (see also Paper II). Then the luminosity decreased to a minimum around 2005 and increased toward a second broad maximum that occurred in 2009-2010. The X-ray luminosity in the second maximum is very close to the values observed in late 2001, supporting the assumption that the first observed maximum was in 2001. Around 2013 the luminosity reached a second minimum with X-ray luminosity similar to that of 2005 and, then, increased again toward a new maximum in 2016. From the fitting of the data with a sinusoidal function, we find that the cyclic modulation of the X-ray luminosity has an amplitude of a factor of , if one ignores the apparently anomalous June 2002 observation, and a period of yr very close to that of the chromospheric cycle. According to these estimates, the star is currently at its maximum. The analysis shows that the two cycles appear very similar each other and suggest a regular coronal cycle in HD 81809 analogous to that observed in the Sun. We note that the amplitude of the cycle (about a factor of 5) is much lower than that of the Sun (which is about a factor of 50; Orlando et al. 2001), probably due to the higher level of activity of HD 81809. We conjecture that this might reflect a dynamo more productive of magnetic fields, so that a significant coronal activity (in terms of presence of active regions, cores, and possibly flares) is always present on the stellar surface (even during the minimum) at variance with the solar case. This idea is supported by the evidence that the X-ray flux of HD 81809 at minimum is much larger (by a factor of ) than the X-ray flux of the Sun at minimum (see also Fig. 3 in Paper II), suggesting a significant coronal activity in HD 81809 even at minimum.
The June 2002 data point is the only most prominent exception to the regular cyclic modulation in the coronal activity level with a luminosity higher than during the maximum; this was most likely due to a bright flare dominating the X-ray emission of HD 81809 during the observation. In fact, the spectrum in June 2002 is characterized by a second temperature component at MK and corresponding emission measure comparable to that of the colder component (see Table 1). As discussed in detail in Papers I and II, these characteristics point at a period of enhanced flare-like activity, although the light curve extracted from this observation (which however only spans approximately two hours) shows no evidence of flare-like variability. The comparison of the June 2002 spectrum with the spectrum of the flaring Sun observed as a star supports this interpretation (see Paper II and Sect. 3.3 for more details). Other observations (e.g. April 2011 and April 2015) show similar high temperature components although with corresponding emission measures lower than in June 2002.
3.2 Chromospheric Ca ii activity measured by TIGRE
In correspondence of the last maximum in the coronal activity level of HD 81809, chromospheric Ca ii activity has been measured continuously between 2014 and 2017 by TIGRE, a fully automatic 1.2 m telescope located at the La Luz Observatory in central Mexico. TIGRE’s main instrument is the fibre-fed Échelle spectrograph HEROS with a spectral resolution of R20,000 and a spectral range from Å to 8800 Å with a small gap of 100 Å centered around 5800 Å; a detailed description of the TIGRE facility is given by Schmitt et al. (2014).
The TIGRE facility is primarily designed to execute spectroscopic long-term monitoring programs and one of these programs is the long-term monitoring of active stars. The most commonly used activity indicator is the Mount Wilson S-index (Baliunas et al. 1995). With the TIGRE spectra we first derive an instrumental S-index (STIGRE) with an automatic procedure (see Mittag et al. 2016 for a detailed description), which works as follows: first, the radial velocity (RV) shift of the Ca ii region is estimated via a cross correlation with a synthetic spectrum and then a RV correction of the Ca ii region is performed. Afterwards, the counts in the four band passes of the STIGRE index are integrated and the ratio between the counts of both line centers and the quasi reference continua are calculated. This ratio yields the STIGRE-value, which is transformed into the Mount Wilson scale with a linear relation derived by Mittag et al. (2016) through
| (2) |
In this fashion our TIGRE S-indices can be readily compared to the vast amount of literature available on the activity derived from the Ca ii line cores. The changes in , measured between 2014 and 2017, are shown in Fig. 1 (red crosses superimposed to the X-ray lightcurve). We find that, in the period analyzed, the chromospheric Ca ii activity level increases following the increase in the coronal activity level. Unfortunately the TIGRE data do not cover a full cycle of activity, so that we cannot derive the period and amplitude of the cyclic modulation of chromospheric Ca ii activity. In the next future, therefore, it is highly desirable to continue the monitoring of HD 81809 with both XMM-Newton and TIGRE instruments to enable a more precise comparison between coronal and chromospheric activity variations.
| Obs. ID | Obs. start UTC | Obs. duration | EM2 / EM1 | ||||
|---|---|---|---|---|---|---|---|
| [s] | [ erg s-1] | [MK] | [MK] | [MK] | |||
| 0032340301 | 2001-11-01 23:16:52 | 6402 | |||||
| 0032341301 | 2002-11-02 18:04:22 | 5453 | |||||
| 0032342201 | 2002-06-06 03:07:46 | 6395 | |||||
| 0032342301 | 2003-05-03 11:10:15 | 8452 | |||||
| 0143630701 | 2003-11-22 05:33:21 | 7208 | |||||
| 0143630801 | 2004-04-29 22:09:49 | 22319 | |||||
| 0202610801 | 2004-11-09 19:16:08 | 30708 | |||||
| 0202611001 | 2005-05-03 19:19:09 | 28917 | |||||
| 0202611601 | 2005-10-30 05:57:32 | 30119 | |||||
| 0401880601 | 2006-11-05 23:41:06 | 22213 | |||||
| 0401880701 | 2007-05-04 12:22:37 | 23209 | |||||
| 0501930401 | 2007-11-09 16:42:54 | 16918 | |||||
| 0501930501 | 2008-05-14 23:38:08 | 16917 | |||||
| 0550061101 | 2008-11-06 18:13:31 | 16917 | |||||
| 0550061201 | 2009-04-27 06:36:24 | 16915 | |||||
| 0600820401 | 2009-05-24 23:00:31 | 11914 | |||||
| 0600820501 | 2009-11-04 16:32:25 | 11919 | |||||
| 0600820601 | 2009-12-08 07:22:42 | 13417 | |||||
| 0600820701 | 2010-04-30 23:45:12 | 11915 | |||||
| 0654550401 | 2010-10-31 17:48:38 | 13914 | |||||
| 0654550501 | 2011-04-27 09:52:48 | 10921 | |||||
| 0670320101 | 2011-11-02 11:38:16 | 12917 | |||||
| 0670320601 | 2012-05-07 12:21:03 | 12918 | |||||
| 0690800401 | 2012-06-07 00:38:40 | 14414 | |||||
| 0690800501 | 2012-11-01 10:47:39 | 12017 | |||||
| 0690800701 | 2013-04-27 23:47:21 | 17418 | |||||
| 0720580801 | 2013-10-30 06:04:59 | 14600 | |||||
| 0720580901 | 2014-04-28 11:30:24 | 26000 | |||||
| 0741700401 | 2014-10-29 15:35:25 | 15999 | |||||
| 0741700501 | 2015-04-30 11:36:57 | 22700 | |||||
| 0760290401 | 2015-10-29 21:10:29 | 15000 | |||||
| 0760290501 | 2016-04-25 07:18:57 | 18500 | |||||
| 0783340401 | 2016-10-29 12:03:04 | 11000 |
3.3 Characterizing the coronal plasma using a mixture of solar-like coronal regions
Although HD 81809 cannot be considered a solar twin (because it is a binary system and one of the two components has mass and radius different from those of the Sun), we demonstrated in Paper II that the observations can be interpreted in terms of a mixture of solar-like active regions. At the base of this interpretation there was the assumption that the X-ray activity of the system is dominated by the more massive, larger companion (the primary component) with a mass and radius . This assumption is justified by the evident coherent, cyclic variability observed (due to a dominant component in the system) and by the impossibility to produce the observed levels of activity with the smaller secondary component and filling factors smaller than 1 (see also the discussion below on the comparison between the X-ray luminosity of the Sun and that of HD 81809). Here we adopt the same assumption and investigate if and how a mixture of solar-like coronal regions can describe the corona of the primary component of HD 81809 along its cycle of activity.
In Paper II we adopted a methodology originally developed in the context of the study of the “Sun as a star” (see Orlando et al. 2000; Peres et al. 2000) and investigated if the cycle of HD 81809 can be explained in terms of solar-like structures by modeling the stellar corona with varying coverage of solar-like active regions and cores of active regions. However, as discussed in Sect. 3.1, some observations suggest a significant flare-like activity that cannot be described in terms of only active regions and cores. The most evident case is the June 2002 observation characterized by a luminosity higher than during all the three maxima in the coronal cycle (see Fig. 1). Hints of flare-like activity are also present in other observations (e.g. April 2011 and April 2015).
Several authors suggested that a superposition of many flare-like events, ranging in energy from very frequent nano- and micro-flares to less frequent larger flares, might contribute significantly to stellar coronal emission (e.g. Butler et al. 1986; Feldman et al. 1997; Drake et al. 2000 and references therein). In the light of this, here we adopt a similar methodology of Paper II, but now considering also the contribution of solar-like flaring regions. The “quiet Sun” is omitted because, at its minimum of coronal activity, the Sun has an X-ray luminosity which is orders of magnitude lower than the Sun at maximum (see Peres et al. 2000 and Fig. 3) and, in the presence of active regions, its contribution to X-ray emission is negligible (see also Orlando et al. 2001, 2004). Thus we model the evolution of the coronal X-ray luminosity and temperature of HD 81809 along its cycle of activity in terms of varying coverage of the stellar surface with solar-like active regions, cores, and flares. As in Paper II, our simulations assume the minimum radius, , for the dominant (the primary) component of HD 81809 in order to derive upper limits111The smaller the star, the higher the filling factors necessary to reproduce the observed level of emission. for the filling factors derived for the various types of coronal structures.
As a first step in our approach, we consider the average distribution of emission measure vs. temperature, EM(), per unit surface area for each class of solar coronal structures considered here (namely active regions, cores, and flares). To this end, we take advantage of the results of the analysis of observations collected with the soft X-ray telescope (SXT) on board the Yohkoh satellite (Tsuneta et al. 1991) which are discussed in previous studies (Orlando et al. 2001, 2004; Reale et al. 2001). For the reader convenience, we summarize here the method followed by those authors to derive the EM() distributions of specific coronal regions. In the case of the solar corona outside evident flares, Orlando et al. (2001) have shown that three different classes of coronal regions contributing to the X-ray emission of the whole solar corona can be identified from the analysis of Yohkoh/SXT images: quiet regions, active regions, and active region cores. The selection of these regions is based on the SXT pixel intensity (or, in other words, on the surface brightness), a criterion similar to that adopted by Hara (1996) and Drake et al. (2000). Once the regions are selected, the EM() distribution is derived from the analysis of the selected pixels following the method outlined by Orlando et al. (2000). It is worth noting that studies conducted during a complete solar coronal cycle have shown that the latter can be explained by a varying surface coverage of active regions and cores (Orlando et al. 2001) a mechanism which we wish to test for HD 81809. More specifically, these studies have shown that the average temperature of the different classes of regions increases from quiet regions ( MK) to active regions ( MK) to cores ( MK) (Orlando et al. 2001). The contribution of quiet regions to the X-ray emission does not change appreciably, whereas the contribution from active regions and cores decreases by several orders of magnitude with the solar cycle. Indeed although active regions and cores in the Sun cover only a minor fraction of the solar surface (% at the maximum and % at the minimum) they dominate the EM() distribution of the whole solar corona for temperatures above MK (outside flares) and determine the changes in X-ray luminosity and average temperature of the whole solar corona (Orlando et al. 2001). This behaviour justifies our choice to neglect the contribution of the quiet Sun from our analysis. For the purposes of the present paper, we derive the average EM() distributions of active regions and cores, by considering the analysis of Orlando et al. (2004) who studied the long term evolution of a solar active region and its core observed with Yohkoh/SXT from its emergence (July 5, 1996) to the decay phase (end of October 1996). The average distributions are derived by averaging the distributions obtained by these authors in different phases of evolution of these regions.
For the EM() distribution of flares, we consider a sample of flares observed with Yohkoh/SXT and analyzed by Reale et al. (2001). The sample includes eigth flares from weak (GOES class C5.8) to very intense ones (X9). For each flare, the EM() distribution of the flaring region was derived by Reale et al. (2001) in the rise, peak, and decay phase. Here we consider those distributions derived for all the flares and in different phases of their evolution and determine the average contribution of flaring regions to the EM() distribution of the whole corona, by assuming that the differential energy frequency distribution of solar flares is described as where is the flare energy and the index (e.g. Aschwanden & Parnell 2002; Wang & Dai 2013 and references therein). Then, from the EM() distributions per unit surface area for each type of solar coronal structures, we explore different surface coverage of active regions, cores, and flares and derive the resulting EM() distribution of the whole corona and the corresponding XMM-Newton spectrum and X-ray luminosity. Finally we compare the simulated data with those of HD 81809.
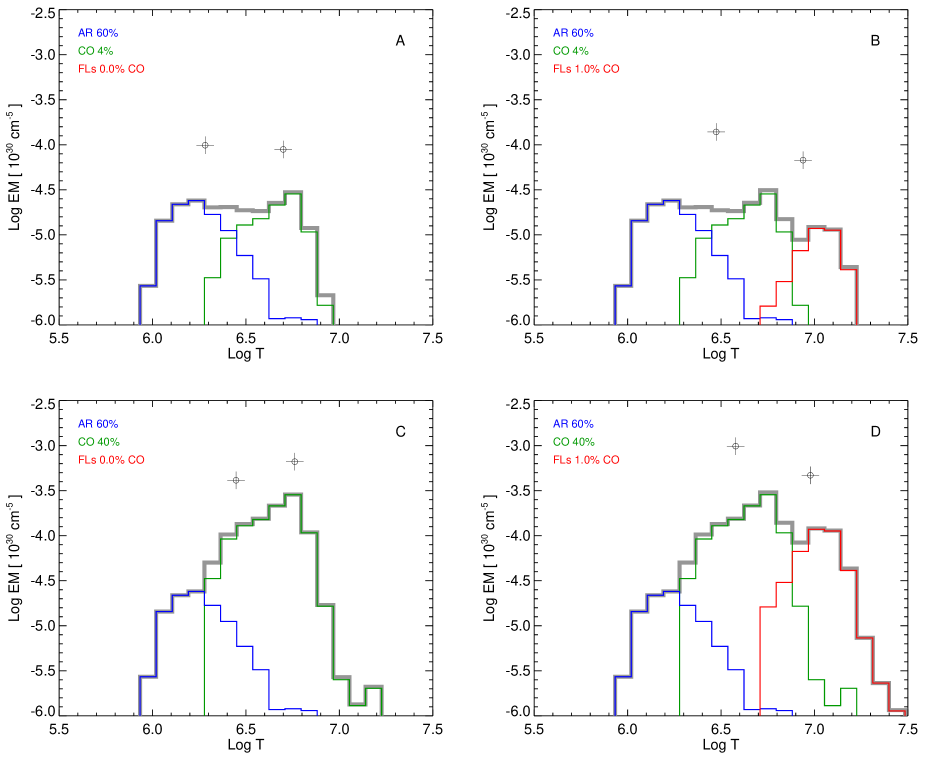
In Paper II, we found that the coronal emission is largely dominated by cores out of the cycle minimum so that the coverage of active regions can be constrained only during the minimum. Following the results of Paper II, the minimum in 2005 can be described by assuming a coverage of active regions with a maximum surface filling factor of about % (corresponding to 27% if considering the upper limit to the star radius, ) and a coverage of cores with %. We assume, therefore, the same coverage of active regions during the whole evolution. This assumption reflects our unability to constrain the active regions coverage. However it is unlikely that the active regions coverage does not vary during the cycle as shown, for instance, in our Sun. In Sect. 3.4 we discuss this point in more detail. With the above approximation, the cyclic modulation of coronal activity is determined by varying only the coverage of cores and flares. We allow the filling factor of cores, , to vary between 4 and 40%, the latter corresponding to a full coverage of the stellar surface considering the filling factor of active regions at 60% and a stellar radius of . We assume the coverage of flares to depend on the coverage of cores and allow the filling factor of flares, , to vary between 0 and 1% of the coverage of cores (in other words, we allow a small percentage of the cores to be flaring). Figure 2 shows the modeled EM() distributions for the minimum and maximum allowed coverage of cores and flares. As expected, the contribution from active regions to the EM() distribution is significant only when the coverage of cores is minimum (upper panels in Fig. 2). In that case the contribution of active regions is comparable to those of cores. Conversely, when the coverage of cores is the maximum (40%), the EM() distribution is largely dominated by cores. As a result, the surface filling factor of active regions cannot be univocally determined. The flares contribute to the high temperature portion of the EM() distribution, leading to an higher average coronal temperature and to an harder spectrum.
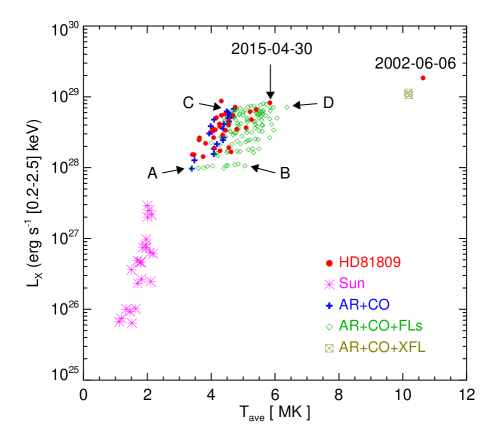
From the EM() distributions we synthesize the corresponding XMM-Newton spectra and analyze them in the same way as the actual data of HD 81809, using XSPEC. In particular we estimate the parameters characterizing the simulated spectra (namely temperature and emission measure) by fitting the spectra with two isothermal components (APEC models). Then we derive the coronal luminosity, , and the emission measure-weighted temperature, , defined in Eq. 1. Figure 3 reports the range of variation in and obtained for the simulated data (blue and green symbols) using the above approach, together with those observed for the Sun (magenta symbols; data adapted from Orlando et al. 2001) and HD 81809 (red symbols) along their cycle. The figure clearly shows that the simulated data cover the entire observed range of variations of HD 81809 in terms of both and , so that the entire cycle of HD 81809 can be reproduced by simply assuming the same coverage of active regions (%) and a different coverage of cores and flares. Both coronal temperature and luminosity at the cycle minimum can be explained if the active regions cover % of the stellar surface, the cores about 4%, and there are no flaring regions, in agreement with Paper II. An EM() distribution close to that at cycle minimum is shown in panel A of Fig. 2 (see also the corresponding data point labeled A in Fig. 3). For comparison, the average temperature and the X-ray luminosity of the solar corona at minimum are the result of active regions covering no more than 0.1% of the solar surface, with no cores and flares present (Orlando et al. 2001). In fact, the coronal temperature of the Sun at minimum is a factor of 3 lower and the X-ray luminosity two orders of magnitude lower than those of HD 81809 at minimum (see Fig. 3). This is due in part also to the smaller radius of the Sun with respect to that of the primary component of HD 81809. In fact, in Paper II we found that the X-ray surface flux (in the keV band) of the Sun at minimum is only a factor of lower than that of HD 81809 at minimum (see Fig. 3 in Paper II).
The coronal luminosity of HD 81809 close to the cycle maximum can be reproduced if the active regions cover % of the stellar surface and the cores about 40% (panel C in Fig. 2 and data point labeled C in Fig. 3). However, out of the minimum, some of the data points show values of temperature that cannot be simply explained as a mixture of active regions and cores only (blue symbols in Fig. 3). In these cases a contribution of flares is required (green symbols in Fig. 3). For instance the April 2015 data (see Fig. 3), characterized by a coronal temperature MK can be represented if, for instance, the active regions cover % of the stellar surface, the cores about 40%, and 1% of cores is flaring (data point labeled D in Fig. 3). The corresponding EM() distribution is shown in panel D of Fig. 2. In the case of the Sun, at solar maximum the coronal temperature and luminosity are determined by a surface coverage of active regions of about 30%, a coverage of cores of about 1%, and no flares present (Orlando et al. 2001). As a result, the coronal temperature and luminosity of the Sun at maximum are still significantly lower that those of HD 81809 at minimum (see Fig. 3). Again the different luminosity is partially due to the different radius of the two stars; in fact the X-ray surface flux of the Sun at maximum is only slightly lower than that of HD 81809 at maximum (see Fig. 3 in Paper II). This cannot explain however the different average temperature. We note that the less massive companion in HD 81809, with a mass M⊙ very close to that of the Sun, has most likely levels of activity similar to those of the Sun. Its luminosity, therefore, is expected to be much lower than that of the more massive larger companion, even at maximum of activity. This justifies our assumption that the X-ray activity of the system is dominated by the primary component.
The above results suggest that, besides the June 2002 data set (with a coronal temperature MK in Fig. 3) which is clearly an outlier separated from the cloud of values of HD 81809, other data points in Fig. 3 might have an unresolved flaring component contributing to the coronal emission. In Paper II, we interpreted the June 2002 data point as a flare-like phenomenon. This is supported by the evidence that its spectral characteristics can be reproduced if the contribution of a very intense solar flare (a GOES class X9 flare observed with Yohkoh/SXT on November 2, 1992) is added to the synthetic X-ray spectrum simulating the cycle maximum of HD 81809 (see crossed square in Fig. 3). We wonder, therefore, if the systematic higher coronal temperature of some of the data points with respect to simulations considering only a mixture of active regions and cores can be considered as evidence of flares not visible as short-term variability in the XMM-Newton observations. As shown by Orlando et al. (2004) in their study of the Sun as a star, the characteristics of X-ray variability due to the coronal cycle and to flaring activity are different. A prominent difference is that the variability induced by flares leads to a significant change of coronal temperature, whereas the variability due to the cycle is mainly characterized by large variations in X-ray luminosity (see Fig. 9 in Orlando et al. 2004). This is evident also in Fig. 3 where the variability induced by an increased flaring activity (for instance, evolving from panel A to panel B in Fig. 2) leads to an evolution from data point A to data point B; the variability induced by an increasing coverage of cores (namely evolving from panel A to panel C in Fig. 2) leads to an evolution from data point A to data point C in Fig. 3. In other words, flaring regions significantly increase the average coronal temperature, a feature that seems to characterize some of the data points of HD 81809 (e.g. the April 2015 data, see Fig. 3).
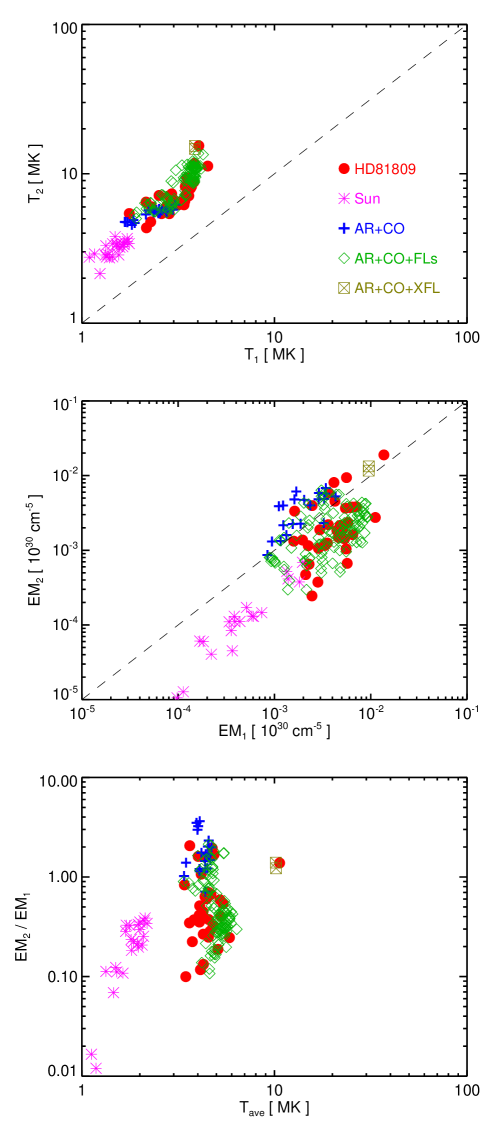
In Fig. 4 we compare the parameters derived from the spectral fitting of the actual data of HD 81809 with those derived from the fitting of simulated spectra (colors and symbols as in Fig. 3). Again we find that the range of variations of the parameters characterizing the spectra of HD 81809 along its cycle are well represented in terms of a mixture of active regions, cores, and flares (green diamonds in Fig. 4). Here the comparison of fitting parameters derived from observed and simulated spectra shows clearly that a mixture of only active regions and cores (blue crosses in Fig. 4) cannot describe most of the data points of HD 81809. In fact, in many cases the observed spectra require the second isothermal component with higher values of and/or lower values of EM2 (and ratio EM2/EM1 lower than 1) than the spectra simulated with a mixture of active regions and cores. We conclude that adding a contribution from flares is necessary to reproduce the spectral characteristics of all data points of HD 81809. Again this result supports the scenario of an unresolved significant flaring activity in HD 81809. This is not evident if the observed spectra are fit with one isothermal component, as we did in Paper II.
3.4 A scaled up Sun?
To probe the distribution of coronal temperature in HD 81809 during its cycle and to attempt a rough reconstruction of its EM() distribution, a three-temperatures model was adopted, in which the temperatures were fixed at keV ( MK), keV ( MK), and keV ( MK), namely the values roughly corresponding to the peaks of emission measure of the EM() distributions of active regions, cores, and flares, respectively (see Fig. 2). For this model, therefore, only the normalizations (emission measures) were allowed to vary. Table 2 reports the best-fit parameters from the three-temperatures model, for all the data set of HD 81809.
| Date | EM1 | EM2 | EM3 |
|---|---|---|---|
| [ cm-5] | [ cm-5] | [ cm-5] | |
| 2001-11-01 | |||
| 2002-06-06 | |||
| 2002-11-02 | |||
| 2003-05-03 | |||
| 2003-11-22 | |||
| 2004-04-29 | |||
| 2004-11-09 | |||
| 2005-05-03 | |||
| 2005-10-30 | |||
| 2006-11-05 | |||
| 2007-05-04 | |||
| 2007-11-09 | |||
| 2008-05-14 | |||
| 2008-11-06 | |||
| 2009-04-27 | |||
| 2009-05-24 | |||
| 2009-11-04 | |||
| 2009-12-08 | |||
| 2010-04-30 | |||
| 2010-10-31 | |||
| 2011-04-27 | |||
| 2011-11-02 | |||
| 2012-05-07 | |||
| 2012-06-07 | |||
| 2012-11-01 | |||
| 2013-04-27 | |||
| 2013-10-30 | |||
| 2014-04-28 | |||
| 2014-10-29 | |||
| 2015-04-30 | |||
| 2015-10-29 | |||
| 2016-04-25 | |||
| 2016-10-29 |
The variability of the best-fit emission measures along the coronal cycle of HD 81809 is shown in Fig. 5. The cycle modulation is particularly evident in the emission measure of the intermediate (green circles) and coldest (blue) isothermal components (upper panel in the figure). The hottest (red circles) component shows many upper limits to the emission measure and a weaker relation with the coronal cycle; nevertheless, for this component, the highest values of EM occur, in general, in proximity of cycle maxima. If we interpret the isothermal components in terms of solar-like coronal regions, the cold component corresponds to the active regions, the intermediate to the cores, and the hot to the flares.
This new approach in the analysis of actual spectra confirms that the cyclic modulation is mainly due to the varying coverage of cores. The lower panel in Fig. 5 shows a clear correlation between the emission measure of cores and the coronal luminosity of HD 81809 with the EM increasing by about one order of magnitude between the minimum and maximum of the cycle. We note that this is compatible with the increase of from 4 to 40% in our simulations. Thus, we speculate that this regular and gradual increase reflects the increase of surface filling factor of cores. The figure shows a correlation also for the active regions but with the EM varying only by a factor excluding the June 2002 data point. The EM of active regions is comparable to that of cores close to the minimum; then the EM of cores increases with the level of activity faster than that of active regions and it is a factor of larger than that of active regions close to the maximum. This result shows that the coverage of active regions cannot be considered permanent as assumed in Sect. 3.3; a varying coverage of active regions contributes to the cyclic modulation of coronal activity. This was expected also considering that, in the Sun, the coverage of active regions varies during the coronal cycle. In fact our choice to consider a permanent coverage of active regions was dictated by our unability to constrain the active regions coverage. In addition it is worth to note that the adopted filling factor, %, is an upper limit when a star radius is considered. For , the upper limit is even lower, %, thus allowing a variation of active regions coverage during the cycle of a factor of 3, as inferred from Fig. 5. Despite the increasing active regions coverage toward the maximum, Fig. 5 confirms that the active regions contribution is not determinant for the observed variability which is, instead, mostly due to the varying coverage of cores. The contribution of flares is, in general, the lowest in terms of EM, although it increases rapidly with the level of coronal activity, becoming comparable to the contribution of active regions in proximity of cycle maxima. This means that their contribution to the X-ray luminosity is not determinant as also shown by Fig. 3. Nevertheless the hot isothermal component (or, in other words, the flares) is important to fit the high energy part of the spectrum, as demonstrated by the fitting with two isothermal components of actual spectra (see Fig. 4) and by the average coronal X-ray temperature (see Table 1 and Fig. 3).
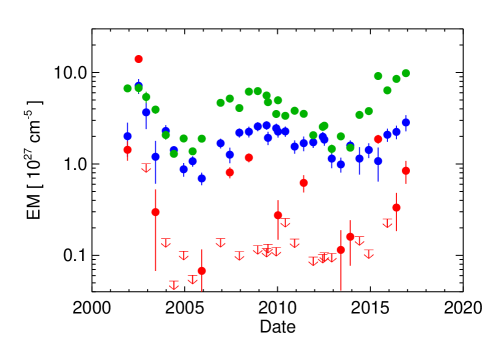
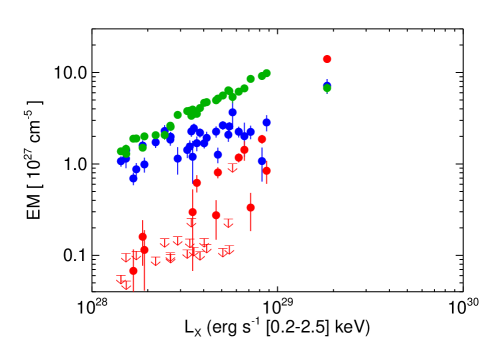
Figure 5 also shows that the June 2002 observation differs significantly from the others. The coronal emission is largely dominated by the hot component (flares) which has the largest value of EM. The other two components (active regions and cores) have similar EM, a factor of lower than that of the hot component (see Table 2). This result supports the idea that a bright flare was dominating the coronal emission of HD 81809 in the June 2002 data. Interestingly, in this case, the EM of the hot component rather than that of the intermediate one seems to be an extension of the distribution of data points of the cores (see the lower panel in Fig. 5). This reinforces the peculiarity of this data point with respect to the others.
The scenario suggested by the fitting with a three-temperatures model is, in some way, analogous to that discussed by Drake et al. (2000) to explain the high levels of coronal emission measure distributions derived for the intermediate-activity stars Eri (K2 V) and Boo A (G8 V) from Extreme Ultraviolet Explorer spectroscopic observations. These authors found that the coronae of solar-like stars with activity levels up to that of Boo A can be explained in terms of coronal structures (active regions and cores of active regions) of the same type of that observed in the Sun. The activity level follows the surface area coverage of these regions: in higher activity stars the coverage approaches unity. We observe a similar behavior in HD 81809 where its activity level during the coronal cycle is modulated by the varying coverage of active regions and cores which is the maximum (around unity) in correspondence of cycle maxima. Drake et al. (2000) suggest that, as the surface area coverage of active regions and cores is close to unity, the interactions and merging of active coronal regions should increase, leading to a corresponding increase of flaring activity in terms of frequency and intensity of flares. This is consistent with the evidence of a significant (unresolved) flaring activity in the data of HD 81809 especially in proximity of its cycle maxima. The best evidence of a bright flare is in the June 2002 data point, which shows the highest X-ray luminosity of HD 81809, close to the first cycle maximum, recorded in the long-term monitoring program of XMM-Newton. We conjecture that the increasing surface coverage of active regions and cores in HD 81809 when it approaches a cycle maximum, makes the interaction among these regions more effective. As a result, higher frequency and larger flares could be produced than would be within individual active regions. We suggest that an unresolved flaring activity in HD 81809 is responsible for heating plasma to coronal temperatures of MK, explaining the evidence of a hot plasma component in some spectra of HD 81809 especially close to the cycle maxima.
4 Summary and Conclusions
We have presented the analysis of the complete data set resulting from the long-term XMM-Newton monitoring program of the solar-like star HD 81809, covering 15 years of evolution. The star is characterized by a well-defined cycle in its chromospheric activity. We have shown here that HD 81809 is also characterized by a cyclic variability of coronal X-ray luminosity which is coherent with the chromospheric one. The data covers approximately two cycles of coronal activity; the modulation of X-ray luminosity has an amplitude of a factor of (excluding an evident flare in the June 2002 observation) and a period of yr, consistent with that of the chromospheric cycle. The two coronal cycles are very similar, pointing at a regular modulation of the coronal activity.
Pevtsov et al. (2003) studied the relationship between the total magnetic flux and the X-ray luminosity inferred from X-ray and magnetic field observations of the Sun and of a sample of active stars (including dwarfs and pre-main-sequence stars). They found that the magnetic flux and X-ray luminosity exhibit a linear relationship over 12 orders of magnitude, suggesting an universal relationship between magnetic flux and the power dissipated through coronal heating. This relationship can be particularly useful when magnetic measurements are unavailable and one can use X-rays as a proxy for the magnetic flux. In the case of HD 81809, the observed variation in X-ray luminosity suggests that the magnetic flux ranges between G cm2 at minimum and G cm2 at maximum. These values are significantly larger than those measured in the Sun and ranging between G cm2 at minimum and G cm2 at maximum.
The spectra of HD 81809 have been interpreted in terms of a mixture of solar-like coronal structures (active regions, cores of active regions, and flaring regions). We have found that the observed range of variations of HD 81809 along the cycle, in terms of coronal temperature and luminosity, can be explained with a different surface coverage of the various types of solar coronal structures, suggesting that the corona of HD 81809 can be considered as a scaled-up version of the solar corona. The activity level of HD 81809 is mainly regulated by a varying coverage of the cores. At the minimum of activity, our analysis suggests that the EM() distribution of HD 81809 is determined by comparable contributions from active regions and cores. Assuming the lower limit to the radius of HD 81809 (namely ), we have found that, to describe the minimum, the surface coverage of active regions should be % and that of cores %, with no flares present. This coverage is much larger than that observed in the Sun at its maximum of activity and, in addition, for a star with a much larger radius than the Sun. This justifies the higher level of activity of HD 81809 and the significantly higher values of coronal temperature and luminosity at minimum with respect to those of the Sun at maximum.
When HD 81809 increases its level of activity, the coverage of cores gradually increases from % at minimum up to % in proximity of the maximum. The EM() distribution becomes dominated by cores and, in some cases, by flares, making the contribution from active regions negligible and their surface coverage not univocally determined. In the light of this, we assumed a permanent coverage of active regions during the whole cycle with an upper limit to the filling factor derived at minimum (%). The spectral analysis based on a three-temperatures model has confirmed the interpretation that the variation of coronal activity of HD 81809 is mainly regulated by a varying coverage of cores spanning one order of magnitude. In addition, this analysis has also allowed us to identify a moderate change (a factor of 3) in the active regions coverage which follows that of cores during the coronal cycle. In many cases, mostly close to the maximum, the actual data are characterized by a coronal temperature higher than that of simulations assuming a coverage of only active regions and cores. In these cases a significant contribution of flares is necessary to fit the data. We have interpreted this result as evidence of an unresolved significant flaring activity present in HD 81809 which increases for increasing level of activity. Following Drake et al. (2000), we speculate that, as the surface filling factors of active regions and cores increase and approach unity, the intensity and frequency of flaring events increase because of the increasing complexity of the coronal structures which interact each other. This is also consistent with the evidence that the intensity and frequency of flares in the Sun increase with its coronal cycle.
A comparison of the X-ray cycle of HD 81809 with those of other late-type stars reported in the literature shows that HD 81809 has a cycle with similar characteristics. The cycle of 61 Cygni A (a K5V star with a mass ) has been monitored with ROSAT and XMM-Newton in the period 1993-2012 (covering yr of evolution; Hempelmann et al. 2003, 2006; Robrade et al. 2012). Its cycle shows many similarities with that of HD 81809. It is characterized by regular variations of X-ray luminosity with an amplitude of a factor of (slightly lower than that of HD 81809) and a period of yr, consistent with Ca ii measurements. Another example is Cen that has been monitored in X-rays by several instruments (ROSAT, XMM-Newton, Chandra) in the period 1995-2013 (covering yr of evolution; Robrade et al. 2005; Ayres 2009; Robrade et al. 2012; Ayres 2014; Wargelin et al. 2017). In this case, the observations suggest that the B component (K1V with ) is characterized by an X-ray cycle with a minimum-to-peak contrast of 4.5 and a period of yr (consistent with the chromospheric cycle), whereas the A component (G2V with ) was in a Maunder-Minimum-like low state since 2005 and now is approaching a maximum (Robrade & Schmitt 2016) with a possible period of about yr. The B component, therefore, shows amplitude and period of X-ray variations remarkably similar to those found for HD 81809. Conversely, an X-ray cycle with rather different characteristics is that of the young ( Myr) late-type star Hor observed with XMM-Newton over 21 months in 2011-2013 (Sanz-Forcada et al. 2013). In fact, Hor, at variance with the other cases, shows a somewhat irregular 1.6-yr X-ray cycle very similar to the contemporaneous chromospheric cycle. Indication of a second longer cycle superposed to the shorter one comes from the apparent amplitude modulation of the 1.6-yr cycle. In the period monitored by XMM-Newton, the X-ray flux shows variation of a factor of (lower than the amplitude found for HD 81809). Interestingly, a brief episode of chaotic variability is also present when the longer cycle seems to approach its maximum. After this episode, the cyclic behavior resumes. The complex variability revealed for Hor is most likely due to the youth of the star which makes a major difference with the other late-type stars for which an X-ray cycle has been detected.
Acknowledgements.
This paper is based on observations obtained with XMM-Newton, an ESA science mission with instruments and contributions directly funded by ESA Member States and the USA (NASA).References
- Aschwanden & Parnell (2002) Aschwanden, M. J. & Parnell, C. E. 2002, ApJ, 572, 1048
- Ayres (2009) Ayres, T. R. 2009, ApJ, 696, 1931
- Ayres (2014) Ayres, T. R. 2014, AJ, 147, 59
- Baliunas et al. (1995) Baliunas, S. L., Donahue, R. A., Soon, W. H., et al. 1995, ApJ, 438, 269
- Butler et al. (1986) Butler, C. J., Rodono, M., Foing, B. H., & Haisch, B. M. 1986, Nature, 321, 679
- Drake et al. (2000) Drake, J. J., Peres, G., Orlando, S., Laming, J. M., & Maggio, A. 2000, ApJ, 545, 1074
- Favata et al. (2004) Favata, F., Micela, G., Baliunas, S. L., et al. 2004, A&A, 418, L13 (Paper I)
- Favata et al. (2008) Favata, F., Micela, G., Orlando, S., et al. 2008, A&A, 490, 1121 (Paper II)
- Feldman et al. (1997) Feldman, U., Doschek, G. A., & Klimchuk, J. A. 1997, ApJ, 474, 511
- Hara (1996) Hara, H. 1996, PhD thesis, PhD thesis. Natl. Astronom. Obs., Japan.164 pp. , (1996)
- Hempelmann et al. (2006) Hempelmann, A., Robrade, J., Schmitt, J. H. M. M., et al. 2006, A&A, 460, 261
- Hempelmann et al. (2003) Hempelmann, A., Schmitt, J. H. M. M., Baliunas, S. L., & Donahue, R. A. 2003, A&A, 406, L39
- Hempelmann et al. (1996) Hempelmann, A., Schmitt, J. H. M. M., & Stȩpień, K. 1996, A&A, 305, 284
- Judge et al. (2003) Judge, P. G., Solomon, S. C., & Ayres, T. R. 2003, ApJ, 593, 534
- Mittag et al. (2016) Mittag, M., Schröder, K.-P., Hempelmann, A., González-Pérez, J. N., & Schmitt, J. H. M. M. 2016, A&A, 591, A89
- Orlando et al. (2000) Orlando, S., Peres, G., & Reale, F. 2000, ApJ, 528, 524
- Orlando et al. (2001) Orlando, S., Peres, G., & Reale, F. 2001, ApJ, 560, 499
- Orlando et al. (2004) Orlando, S., Peres, G., & Reale, F. 2004, A&A, 424, 677
- Peres et al. (2000) Peres, G., Orlando, S., Reale, F., Rosner, R., & Hudson, H. 2000, ApJ, 528, 537
- Pevtsov et al. (2003) Pevtsov, A. A., Fisher, G. H., Acton, L. W., et al. 2003, ApJ, 598, 1387
- Pourbaix (2000) Pourbaix, D. 2000, A&AS, 145, 215
- Reale et al. (2001) Reale, F., Peres, G., & Orlando, S. 2001, ApJ, 557, 906
- Robrade & Schmitt (2016) Robrade, J. & Schmitt, J. H. M. M. 2016, ArXiv:1612.06570
- Robrade et al. (2005) Robrade, J., Schmitt, J. H. M. M., & Favata, F. 2005, A&A, 442, 315
- Robrade et al. (2012) Robrade, J., Schmitt, J. H. M. M., & Favata, F. 2012, A&A, 543, A84
- Sanz-Forcada et al. (2013) Sanz-Forcada, J., Stelzer, B., & Metcalfe, T. S. 2013, A&A, 553, L6
- Schmitt & Liefke (2004) Schmitt, J. H. M. M. & Liefke, C. 2004, A&A, 417, 651
- Schmitt et al. (2014) Schmitt, J. H. M. M., Schröder, K.-P., Rauw, G., et al. 2014, Astronomische Nachrichten, 335, 787
- Soderblom (1982) Soderblom, D. R. 1982, ApJ, 263, 239
- Stern (1998) Stern, R. A. 1998, in Astronomical Society of the Pacific Conference Series, Vol. 154, Cool Stars, Stellar Systems, and the Sun, ed. R. A. Donahue & J. A. Bookbinder, 223
- Tokovinin et al. (2015) Tokovinin, A., Mason, B. D., Hartkopf, W. I., Mendez, R. A., & Horch, E. P. 2015, AJ, 150, 50
- Tsuneta et al. (1991) Tsuneta, S., Acton, L., Bruner, M., et al. 1991, Sol. Phys., 136, 37
- Wang & Dai (2013) Wang, F. Y. & Dai, Z. G. 2013, Nature Physics, 9, 465
- Wargelin et al. (2017) Wargelin, B. J., Saar, S. H., Pojmański, G., Drake, J. J., & Kashyap, V. L. 2017, MNRAS, 464, 3281
- White et al. (1992) White, O. R., Skumanich, A., Lean, J., Livingston, W. C., & Keil, S. L. 1992, PASP, 104, 1139