Identification of 210Pb and 210Po in the bulk of copper samples with a low-background alpha particle counter
Abstract
We established a method to assay 210Pb and 210Po contaminations in the bulk of copper samples using a low-background alpha particle counter. The achieved sensitivity for the 210Pb and 210Po contaminations reaches a few mBq/kg. Due to this high sensitivity, the 210Pb and 210Po contaminations in oxygen free copper bulk were identified and measured for the first time. The 210Pb contaminations of our oxygen free copper samples were 17-40 mBq/kg. Based on our investigation of copper samples in each production step, the 210Pb in oxygen free copper was understood to be a small residual of an electrolysis process. This method to measure bulk contaminations of 210Pb and 210Po could be applied to other materials.
keywords:
210Pb , 210Po , copper , radio purity , Alpha spectroscopy1 Introduction
In recent low-background experiments performed underground and aiming for dark matter or neutrinoless double beta decay detection, radio-purity of the detector materials is a critical issue. Oxygen free copper (OFC) is readily available commercial material of low radio isotope (RI) content. Thus it is used in experiments such as XMASS [1], and CUORE [2]. In order to investigate RI in the uranium and thorium chains, 238U and 232Th contaminations are usually measured by Inductively Coupled Plasma Mass Spectrometry or Glow Discharge Mass Spectrometry (GD-MS) with high precision. However, if the radioactive equilibrium is broken, inferred 226Ra or 210Pb contaminations will be different. With a high purity germanium detector (HPGe), 226Ra can be measured down to a few tens of mBq/kg. However, the sensitivity for 210Pb contamination is limited to around 100 mBq/kg. Moreover, HPGe cannot distinguish surface from bulk contamination. Since the requirements for RI contamination are becoming more stringent, we developed a better way to measure the contamination of 210Pb in copper with a low-background alpha particle counter. By measuring the time evolution of event rate of the 5.30 MeV alpha rays from 210Po decay with an alpha particle counter, the 210Pb contamination can be determined because the 210Po half-life is 138.4 days and much shorter than that of the parent isotope, 210Pb.
In this paper, we report that we measured 210Pb and 210Po in OFC using this method and found their contamination for the first time. Also we observed that the 210Pb contamination decreases only after electrolysis process among copper refinement steps is applied. We describe details of the method in Section 2 and the result of measurements in Section 3.
2 Methodology
2.1 Measurement of 210Po under low background condition
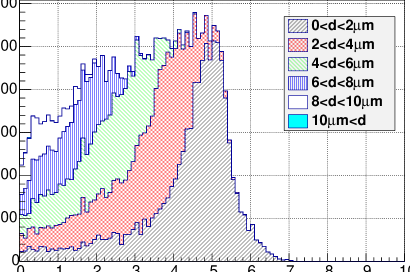
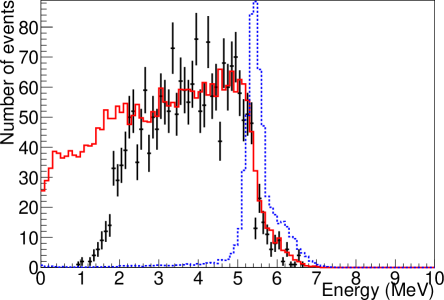
A low-background alpha particle counter is commonly used to measure the surface RI contamination. But it is also possible to measure bulk radioactive contamination [3]. In the alpha particle counter, energy deposition of an alpha ray emerging from the material surface is measured. Fig. 1 shows the energy distribution of 5.30 MeV alpha rays generated uniformly in copper bulk obtained from a Geant4 [4] Monte Carlo (MC) simulation. The distribution is continuous because alpha rays emerging from the bulk lose part of their energy before reaching the surface. The contribution of bulk 210Po alpha ray mostly comes from within 10 m from the surface of the copper sample.
To measure bulk contamination, the following conditions are important: (C1) Background from the alpha particle counter itself should be small. (C2) Radioactive contamination on the sample surface should be minimized. (C3) The surface roughness of samples should be much smaller than the range of alpha rays in copper. (C4) alpha rays from radioactive nuclei other than 210Po should be negligible. To keep these conditions, we performed the following procedures.
In order to satisfy the condition (C1), we used the alpha particle counter, an Ultra-Lo1800 made by XIA LLC [5]. The Ultra-Lo1800 measures the induced charge from ions and electrons created by an alpha ray. Background from the outside is vetoed by a surrounding veto counter. The measured area of samples should be 30 cm diameter circle or 42.5 cm square. All the measurements in this paper were performed using the 30 cm diameter circle mode. The alpha particle counter was installed underground at Kamioka Satellite of the Kavli Institute for the Physics and Mathematics of the Universe, the University of Tokyo, so that the background generated by cosmogenics is negligible. Argon gas is fed from a liquid argon bottle. In order to reduce the background from emanating 222Rn and 220Rn, the gas line connections are all made from electro-polished (EP) stainless steel. Most of the background comes from 222Rn and 220Rn emanating from detector materials or the upstream piping and a liquid argon bottle. After the sample is set in the alpha particle counter, argon gas is purged for 90 minutes to lower the humidity below 50 ppm and also to flush out the 222Rn and 220Rn. We do not use the data of the first day, because it still contains 222Rn and 220Rn backgrounds and also the detector conditions such as humidity become stable after that. Moreover, we do not use the data within one day before the liquid argon bottle runs empty because the energy scale of the detector changes as the bottle empties.
To satisfy the condition (C2), the alpha particle counter was installed in a class 1000 clean room in order to minimize dust contamination during sample exchange. We also kept the samples in an ethylene vinyl alcohol copolymer bag not to accumulate radon daughters on the sample surface during storage and we assume that any residual accumulation is negligible. To minimize the residual surface contamination [6] and to make the surface flat, all copper samples were electro-polished. By the EP process, the surface becomes smooth with an average roughness of much less than 1 m, that we verified with a laser microscope. Therefore the surface roughness is much smaller than alpha ray range in copper, 10 m. So the resulting roughness doesn’t affect the alpha counter measurement, satisfying condition (C3).
In order to confirm the condition (C4), we measured 238U and 232Th bulk contamination in the copper samples (coarse copper, bare copper, OFC, 6N copper samples shown in Section 3) by GD-MS. Including the coarse copper which is the lowest purity sample, we found that all the samples are less than detection limits of the GD-MS, 100 ppt, which corresponds to 1.2 mBq/kg and 0.4 mBq/kg in 238U and 232Th, respectively. The values are the same order of the alpha particle counter background so that the contributions from 238U and 232Th in the copper samples are negligible. Also we checked 226Ra bulk contamination of the coarse copper sample by HPGe. No significant signal was found and the upper limit was obtained to be 3.0 mBq/kg. The 226Ra contribution is negligible.
2.2 Data analysis
The alpha counter provides energy (), , and . Here, is the time when the signal starts to rise and is the time when the signal reaches its maximum height. Therefore, - is a proxy for the time electrons drift from the sample surface to the electrode. Details are shown in [5].
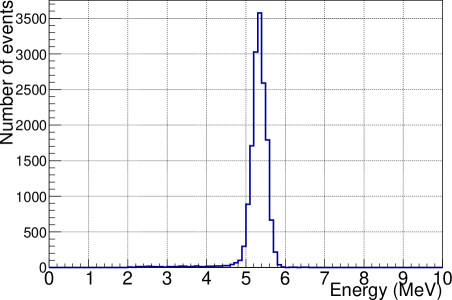
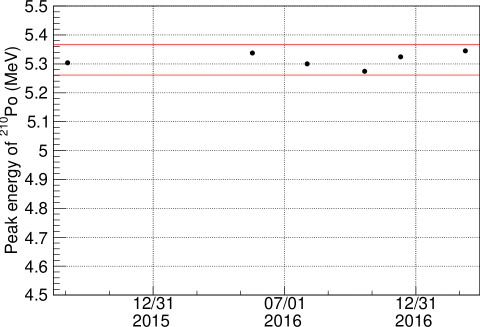
Energy calibration data are routinely taken using 5.30 MeV alpha ray from the 210Po decay of a surface alpha-ray source (10 cm by 10 cm square copper plate) which is located at the center of the sample tray. Fig. 2 shows an example of the energy distribution of 5.30 MeV alpha ray from the 210Po decay. Using the data taken just before the sample measurements, the energy is corrected by fitting the peak. The energy resolution is estimated to be 4.7% (1) at 5.30 MeV. In order to check the stability of the energy, the 210Po 5.30 MeV peak is continuously monitored. The observed stability is within 1% as shown in Fig. 3.
Data selection criteria are: (S1) An event is registered, (S2) No veto signal is observed, (S3) 60 s(-), and (S4) 2.54.8 MeV.
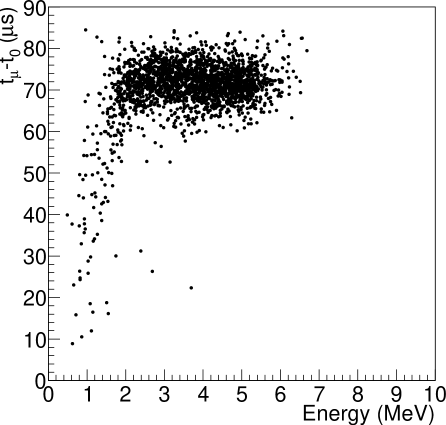
Fig. 4 compares data from a coarse copper sample provided by Mitsubishi Materials Corporation (MMC) for our study and the respective simulation. Coarse copper is the quality of copper before the electrolysis process and its purity is about 99%. Alpha rays from the bulk have a continuous energy distribution. As shown in Fig. 4, the alpha rays from the sample surface are clustered around - = 70 s. Criterion (S3) selects events happening at the sample surface, not in the gas surrounding sample.
We only use the data where the energy is larger than 2.5 MeV because the efficiency below this energy is affected by the trigger threshold effects as evident in Fig. 4. Events around 5.30 MeV may contain residual surface 210Po alpha-ray events. Therefore events in 2.54.8 MeV are used to estimate the 210Po bulk contamination. The contribution in 4.8 MeV from surface 210Po alpha rays is estimated to be less than 10%, based on the calibration sample study. Energy distribution of the surface 210Po simulation is sharper than that of the calibration data shown in Fig. 4. It is because the simulation assumed the contamination was evenly distributed over the entire surface, though the calibration sample is smaller (10 cm by 10 cm) and located at the center of the sample tray. Energy resolution at the outer boundary of the sample area is not as good as that in the central area, that is taken into account in the simulation.
We use the emissivity in 2.54.8 MeV to estimate the 210Po contamination in the copper bulk. Emissivity is the efficiency corrected alpha-ray event rate from a unit area. From the MC simulation, the conversion factor from the emissivity in 2.54.8 MeV to 210Po contamination for copper is obtained as 2.7102 (Bq/kg)/(alpha/cm2/hr).
The observed background level in our setup before applying criterion (S4) is about 10-4 alpha/cm2/hr. The remaining background comes from the decay of daughter nuclei of 220Rn and 222Rn (down to 210Pb) to the surface of the samples. The energies of the dominant alpha rays from these daughters are 6.78 MeV from 216Po, 6.05 MeV from 212Bi, 8.79 MeV from 212Po, 6.00 MeV from 218Po, and 7.69 MeV from 214Po. The lowest energy of alpha ray among these daughter nuclei is 6.00 MeV from the 218Po decay. Thus, most of background can be removed by selecting low-energy events and the background for the bulk 210Po measurement is reduced to be 10-5 alpha/cm2/hr.
The remaining background from the alpha particle counter was estimated by measuring a clean silicon wafer. Simply measuring the emissivity of an empty stainless steel sample tray is not relevant as any sample put on the tray prevents that background from reaching the alpha particle counter. A silicon wafer is one of the cleanest among our measured sample. Assuming that it has no bulk contribution in itself we use this measurement to extract a maximal contribution from the detector to the 2.54.8 MeV region. The measured emissivity of the silicon wafer in 2.54.8 MeV is (5.65.6)10-6 alpha/cm2/hr, which would correspond to a 1.5 mBq/kg 210Po contamination using the MC derived copper bulk conversion factor.
To determine the 210Pb contamination, we measure 210Po several times over different periods because the 210Pb and 210Po decay equilibrium may have been previously broken. The evolution of the 210Pb and 210Po contaminations is described as the following equations:
| (1) |
| (2) |
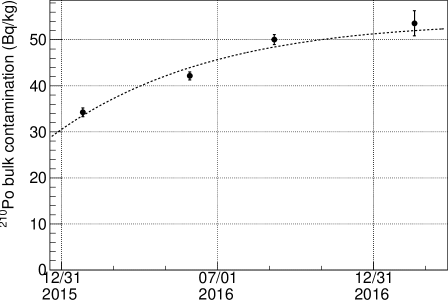
where and are the life times of 210Pb and 210Po, and they are 32.17 years and 0.55 years, respectively. and are the 210Pb and 210Po contaminations at time , respectively. is obtained from the emissivity measurement after background subtraction. =0 is the time when the copper samples were delivered. By fitting the data with the equations above, 210Pb and 210Po contaminations are obtained. Fig. 5 shows the time evolution to the equilibrium of the 210Po contamination in the coarse copper bulk together with the resulting fit. The 210Pb contamination in coarse copper bulk is estimated to be 571 Bq/kg. To check the validity of the conversion factor, the 210Pb contamination in coarse copper is investigated with HPGe. The measured contamination is 55.61.5 (stat.)+16.7-5.6 (sys.) Bq/kg, which is consistent with our alpha particle counter measurement. The dominant systematic uncertainty of the conversion factor comes from the uncertainty of the HPGe measurement and is estimated to be +30% -10%.
3 Copper sample measurements
Based on the methodology detailed in the previous section, we measure the 210Pb and 210Po contaminations in various copper samples.
3.1 Oxygen free copper samples
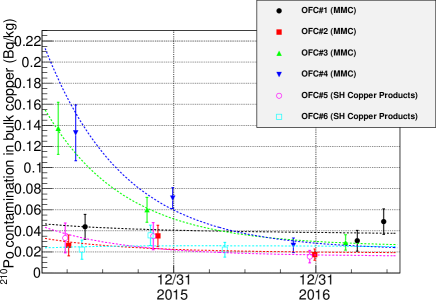
We investigate different OFC (Japanese Industrial Standards (JIS) H2123 C1020) batches as well as OFC samples made by different companies. We purchased plates that were processed by rolling. All plates were electro-polished taking off about 20 m of the material surface. Fig. 6 shows the time evolution of the 210Po contaminations in the bulk for the measured samples. Four samples were made by MMC and the other two by another company, SH copper products. As a result of the fitting, the 210Pb contaminations in all the samples are estimated to be within 17-40 mBq/kg, though 210Po contaminations vary widely as summarized in Table 1. This is the first identification of a 210Pb contamination in OFC. Although OFC is known as a clean material, we found that our samples contain a few tens of mBq/kg of 210Pb. The variation of the 210Pb contaminations among the OFC samples is small. We also investigated the highest grade of OFC, class 1 according to the American Society for Testing and Materials (ASTM) B170 C10100 standard. It was made by SH copper products and the 210Pb contamination we measured was 3613 mBq/kg. Thus we do not see a significant difference on the 210Pb contamination between the different OFC grades.
3.2 Copper samples from different steps in the production process
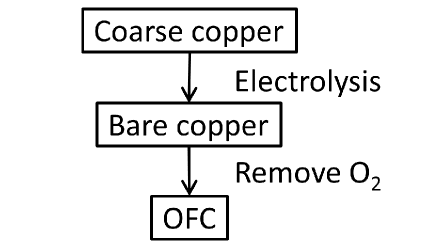
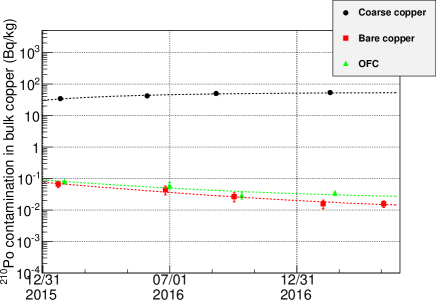
In order to investigate the origin of the 210Pb contamination in OFC, we measured copper samples under refining, namely, coarse copper, bare copper, and OFC (JIS H2123 C1020). These were all made and provided by MMC for this study. The result of the coarse copper measurement was already shown in Section 2. Bare copper is made from coarse copper by electrolysis. OFC is then made from bare copper by removing the oxygen contamination as summarized in Fig. 7. The samples were all formed by cutting and milling, but not by rolling in order to minimize possible 210Pb accumulation from roller. To remove the contribution from surface activity, we removed about 50 m surface materials by EP with fresh electrolysis solution in a clean room. Each sample was measured more than three times to investigate time evolution of 210Pb and 210Po decays. Fig. 8 shows the time evolution of 210Po contaminations of the samples. The fit results including other samples are summarized in Table 1. Coarse copper has the highest 210Pb contamination. The 210Pb contamination of the samples that underwent the electrolysis process, bare copper and OFC, are more than three orders of magnitude lower than that of coarse copper. The equilibrium between 210Pb and 210Po decays is largely broken. In the coarse copper sample, the 210Pb contamination is higher than 210Po contamination. On the other hand, bare copper and OFC have a higher 210Po contamination than 210Pb contamination. These results indicate most of the 210Pb is removed in the electrolysis process but the reduction ratio for the daughter isotopes, 210Bi or 210Po is smaller than that of 210Pb. The 210Pb contamination in OFC that was not rolled is consistent with that of the rolled OFC samples shown in Fig. 6.
| Sample | 210Pb contamination | 210Po contamination |
|---|---|---|
| (mBq/kg) | (mBq/kg) | |
| OFC#1 (C1020) (MMC) | 408 | 4721 |
| OFC#2 (C1020) (MMC) | 206 | 3314 |
| OFC#3 (C1020) (MMC) | 277 | (1.60.3)102 |
| OFC#4 (C1020) (MMC) | 238 | (2.20.4)102 |
| OFC#5 (C1020) (SH copper products) | 176 | 4418 |
| OFC#6 (C1020) (SH copper products) | 278 | 2417 |
| OFC (class1) (SH copper products) | 3613 | 383 |
| Coarse copper (MMC) | (571)103 | (162)103 |
| Bare copper (MMC) | 8.44.0 | (1.10.2)102 |
| OFC (MMC) | 238 | (1.30.3)102 |
| 6N copper (MMC) | 4.1 | 4.8 |
| Electroformed copper (Asahi-Kinzoku) | 5.3 | 18 |
3.3 Very low 210Pb contamination copper
To find the copper least contaminated with 210Pb, we investigated 6N (99.9999% purity) copper made by MMC. 6N copper is made from bare copper. The main process to make 6N copper is an additional electrolysis in a clean environment. The number of 210Po events in the 6N copper sample is only one or two events over two weeks measurement. This event rate from the 6N copper sample is consistent with the background observed in the silicon wafer samples. This implies that the copper is as pure as the silicon wafer or that both materials purity exceed the sensitivity capabilities of the instruments. Therefore we can only derive an upper limit for the 210Pb contamination in 6N copper. The 210Pb and 210Po contamination limits at 90% confidence level (CL) are estimated to be 4.1 mBq/kg and 4.8 mBq/kg, respectively. The 210Pb contamination of 6N copper is much smaller than those of OFC. According to the GD-MS measurement, one of the stable lead isotope, 208Pb contaminations in coarse copper, bare copper, OFC, and 6N copper are 2200 ppm, 0.19 ppm, 0.98 ppm, and 0.002 ppm, respectively. The 208Pb contamination ratio of coarse copper, bare copper, and OFC are similar to that of our 210Pb measurements. The 210Pb contamination in 6N copper is expected to be 0.05 mBq/kg if we assume that the ratio between 208Pb and 210Pb is common among these copper samples. To directly measure such a low level contamination, further background reduction and longer duration measurements are required.
Another very low 210Pb contamination sample was electroformed copper. The electroformed copper we measured was accumulated on a stainless steel base about 500 m in thickness. The input material was copper phosphate. After machining the accumulated copper to make flat surface, EP is applied to remove about 50 m of materials. The observed number of alpha-ray events was consistent with the background expectation. The 210Pb contamination limit at 90% CL in the electroformed copper bulk is estimated to be 5.3 mBq/kg.
4 Summary and discussion
We established a new method to measure the 210Pb and 210Po contaminations in copper bulk by distinguishing bulk originating alpha rays from those of surface. This is the first measurement of 210Pb contamination in copper bulk using a low-background alpha particle counter. Due to the achievement of very low background in the alpha counter, the sensitivity to measure this 210Pb and 210Po contaminations reaches a few mBq/kg. We found that OFC contains a small, but non-zero, 17-40 mBq/kg contaminations of 210Pb. This 210Pb is interpreted as a small residual from the electrolysis process based on the investigation of the coppers in each production step. The 6N and the electroformed coppers contaminate 210Pb at least one order lower than OFC. The method we established here to measure the copper bulk contamination could apply to other materials. Because radon emanates continuously into the air and decay products are accumulated on the surface of the material, 210Pb can get mixed into the material in the production process. 210Pb contamination needs to be investigated independently from that of 238U or 226Ra. To check the 210Pb bulk contamination is important for dark matter and neutrinoless double beta decay experiments. Our method can improve material screening and preparation for such low background experiments.
Acknowledgments
We gratefully acknowledge the cooperation of Mitsubishi Materials Corporation. They kindly provide us the copper samples in each copper production process, that helps the understanding of the origin of 210Pb in OFC. We also gratefully acknowledge the cooperation of Kamioka Mining and Smelting Company. This work was supported by the Japanese Ministry of Education, Culture, Sports, Science and Technology, Grant-in-Aid for Scientific Research, ICRR Joint-Usage, JSPS KAKENHI Grant Number, 26104004.
References
References
- [1] K. Abe et al., Nucl. Instrum. Meth. A 716 (2013) 78.
- [2] C. Alduino et al., Journal of Instrumentation 11, P07009 (2016).
- [3] G. Zuzel et al., Applied Radiation and Isotopes 126 (2017) 165-167.
- [4] S. Agostinelli et al., Nucl. Instrum. Meth. A 506 (2003) 250.
- [5] W. K. Warburton, J. Wahl, and M. Momayezi, Ultra-low Background Gas-filled Alpha Counter, U.S. Patent 6 732 059, May 4, 2004. W. K. Warburton et al., IEEE Nuclear Sci. Symp. Conf. Rec., Oct. 16-22, 2004, vol. 1, pp. 577-581, Paper N16-80. M. Z. Nakib et al., AIP Proc. 1549, 78-81 (2013). B. D. McNally et al., Nucl. Instrum. Meth. A 750 (2014) 96-102.
- [6] G. Zuzel et al., Nucl. Instrum. Meth. A 676 (2012) 140-148.