Direct Observation of Two-Step Magnetic Reconnection in a Solar Flare
Abstract
We report observations of an eruptive X2.8 flare on 2013 May 13, which shows two distinct episodes of energy release in the impulsive phase. The first episode is characterized by the eruption of a magnetic flux rope, similar to the energy-release process in most standard eruptive flares. While the second episode, which is stronger than the first normal one and shows enhanced high-energy X-ray and even -ray emissions, is closely associated with magnetic reconnection of a large-scale loop in the aftermath of the eruption. The reconnection inflow of the loop leg is observed in the Solar Dynamics Observatory (SDO)/Atmospheric Imaging Assembly (AIA) 304 Å passband and accelerates towards the reconnection region to a speed as high as 130 km/s. Simultaneously the corresponding outflow jets are observed in the AIA hot passbands with a speed of 740 km/s and mean temperature of 14 MK. RHESSI observations show a strong burst of hard X-ray (HXR) and -ray emissions with hard electron spectra of , exhibiting a soft-hard-harder behavior. A distinct altitude decrease of the HXR loop-top source coincides with the inward swing of the loop leg observed in the AIA 304 Å passband, which is suggested to be related to the coronal implosion. This fast inflow of magnetic flux contained in the loop leg greatly enhances the reconnection rate and results in very efficient particle acceleration in the second-step reconnection, which also helps to achieve a second higher temperature peak up to T 30 MK.
1 Introduction
Magnetic reconnection is widely considered as the fundamental energy release process in solar flares, which are among the most magnificent phenomena on the Sun. In the classical CSHKP flare model (Carmichael, 1964; Sturrock, 1966; Hirayama, 1974; Kopp & Pneuman, 1976), a prominence or flux rope moves outwards and magnetic reconnection continuously occurs in the current sheet region underneath, leaving behind rising soft X-ray (SXR) flare loops and separating ribbons. Due to pressure imbalance more field lines are swept into the reconnection region, which are generally referred to as inflows (e.g., Yokoyama et al., 2001; Takasao et al., 2012; Savage et al., 2012). Bi-directional outflows of the reconnection jets are presumed to move both upward and downward from the reconnection site, and are sometimes observed in different forms such as plasmoids, supra-arcade downflows and newly-formed loops (Innes et al., 1997; Wang et al., 2007; Liu, 2013; Liu et al., 2013; Su et al., 2013). However the search for direct observations of these features is still needed because of the tight relation to magnetic reconnection.
The energy released by magnetic reconnection is used for plasma heating and particle acceleration (see the reviews by Fletcher et al., 2011; Holman, 2016; Benz, 2017), for which the Reuven Ramaty High-Energy Solar Spectroscopic Imager (RHESSI; Lin et al., 2002) provides both imaging (Hurford et al., 2002) and spectral analyses (Smith et al., 2002). The observed double coronal sources (e.g., Sui & Holman, 2003; Veronig et al., 2006; Liu et al., 2008; Su et al., 2013) are considered as strong evidence for magnetic reconnection, and to relate to the heating in both upper and lower reconnection outflow regions. The loop-top (LT) X-ray source is observed to move downward in the early phase of flares before its commonly upward motion, for which there are interpretations of different scenarios such as the relaxation of newly reconnected field lines, particle acceleration in a collapsing magnetic trap and coronal implosion (Sui & Holman, 2003; Sui et al., 2004; Veronig et al., 2006; Ji et al., 2007; Liu et al., 2009). The HXR spectra in solar flares typically show a hard non-thermal distribution around the peak, and in most cases they soften again towards the flare end, exhibiting a soft-hard-soft (SHS) behavior (Grigis & Benz, 2004). However, there are also some flares for which the spectra continue to harden after the peak, referred to as a soft-hard-harder (SHH) behavior, and these flares are shown to be preferably associated with solar energetic particle (SEP) events (Grayson et al., 2009).
In this letter we present observations of an X2.8 flare on 2013 May 13 showing two-step magnetic reconnection. Besides the first common step characterized by the eruption of a magnetic flux rope resembling most standard eruptive flares, the second anomalous one is manifested as strong reconnection of a large-scale loop in the aftermath of the eruption, which moves inward at a speed as high as 130 km/s. Simultaneously hot outflows and large energy release with emissions from high-energy particles up to the -ray range are recorded. This event has been studied by Martínez Oliveros et al. (2014) and Saint-Hilaire et al. (2014), who concentrated on the unusual loop-prominence system in the aftermath of the flare that was observed in white light by the Solar Dynamics Observatory (SDO; Pesnell et al., 2012)/Helioseismic and Magnetic Imager(HMI; Schou et al., 2012), indicative of very high coronal densities of the order of cm-3. In the present paper, we concentrate on the plethora of magnetic reconnection signatures related to the second burst of strong energy release, using observations by SDO/Atmospheric Imaging Assembly (AIA; Lemen et al., 2012) and RHESSI.
2 Observation and Analysis
The event under study takes place on 2013 May 13 in NOAA active region 11748 near the northeast solar limb, where it produces more than ten flares on that day including two X-class events. Here we concentrate on the X2.8 flare which starts at 15:48 UT and peaks at 16:05 UT. At the early phase a magnetic flux rope erupts out accompanied by a jet-like structure, and the eruption leads to a fast halo coronal mass ejection (CME), with a velocity of 1850 km/s according to the SOHO/LASCO CME catalog 111http://cdaw.gsfc.nasa.gov/CME_list/. The flare is followed by a long gradual phase lasting more than four hours, during which an elongated current sheet and a cusp-shaped structure can be clearly seen above the post-flare loops.
2.1 EUV Observation
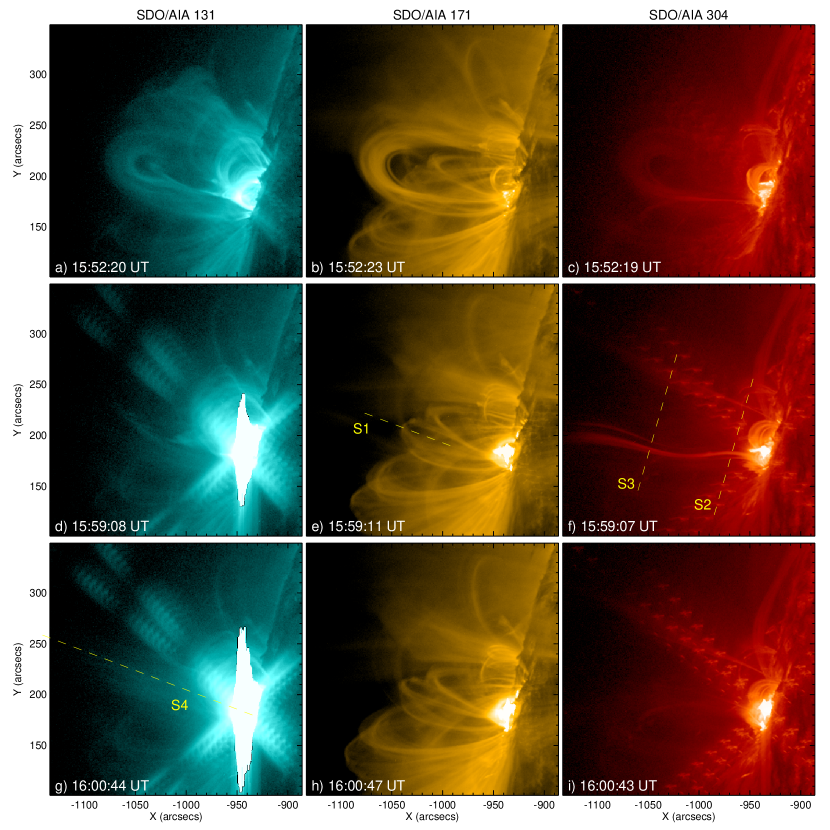
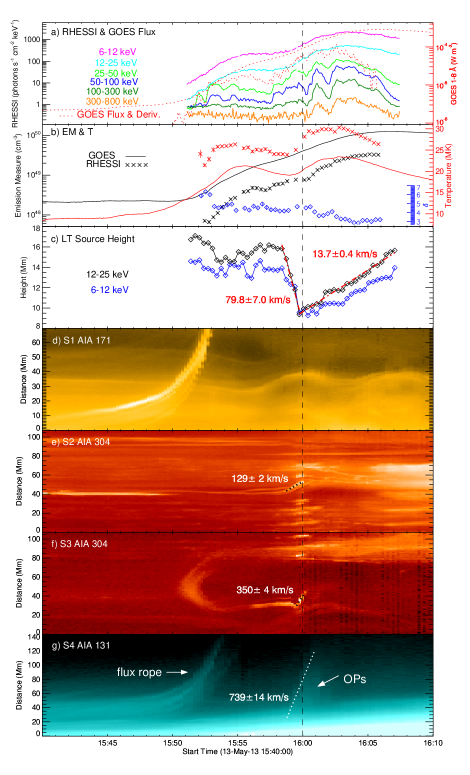
Figure 1 shows the observations of SDO/AIA three EUV passbands, i.e., 131 Å (primarily contributed from Fe XXI line with a peak response temperature at ), 171 Å (Fe IX, ) and 304 Å (He II, ). Some hot loops rise and expand rapidly in the early phase, which are likely associated with a magnetic flux rope. The erupting flux rope is connected to the flaring loop underneath by a linear feature (see AIA 131 Å images in Figure 1 and its animation), which is similar in location to the current sheet observed in the gradual phase. Some plasma blobs move upward along this structure at around 15:54 UT (see the animation of Figure 1; for similar observations, see Liu et al., 2010; Liu, 2013; Zhu et al., 2016). According to the standard flare model, this linear feature with highly dynamic characteristics most likely corresponds to the vertical current sheet that is formed in the wake of the erupting flux rope, where magnetic reconnection is supposed to occur. Some coronal loops are observed to contract toward the flaring region and oscillate after the eruption (e.g., Liu et al., 2009; Liu & Wang, 2010; Simões et al., 2013; Russell et al., 2015), as seen in the AIA 171 Å images in the animation of Figure 1 and the stack plot in Figure 2(d), which is generated by placing a virtual slit across the coronal loops (S1 in Figure 1(e), 155 pixels long and 6 pixels wide, measured from the low-altitude end).
The most intriguing phenomenon in this event is the behavior of a long leg-like structure observed in the AIA 304 Å passband (see Figure 1(f)). It shows up in the cool EUV passbands as one leg of the stretched overlying loops, but becomes more and more prominent as the erupting flux rope moves outside from the AIA field of view (FOV). Then it is only detectable in the AIA 304 Å passband, indicating a low temperature of 0.05 MK. At 15:59 UT the leg suddenly accelerates toward the region above the flaring loops and disappears (see the animation of Figure 1). To study the dynamics, we place two virtual slits across the loop leg (S2 and S3 in Figure 1(f), both are 240 pixels long and 6 pixels wide, measured from the south end). The time-distance plots in Figure 2(e,f) show that after 15:59 UT the loop leg undergoes a fast swing northwards and disappears. The linear fits give the swing speeds of 130 km/s and 350 km/s respectively, with the upper part generally faster.
Almost at the same time when the loop leg disappears, some diffusive plasmas quickly move upward, which are only visible in the AIA hot passbands (e.g., 131 Å image in Figure 1(g)). The virtual slit S4 of 325 pixels long and 10 pixels wide is placed on the 131 Å images along these outward-moving plasmas (OPs) and measured from the low-altitude end. The stack plot in Figure 2(g) shows the erupting flux rope as well as the diffusive OPs, with the out-moving speed of 740 km/s.
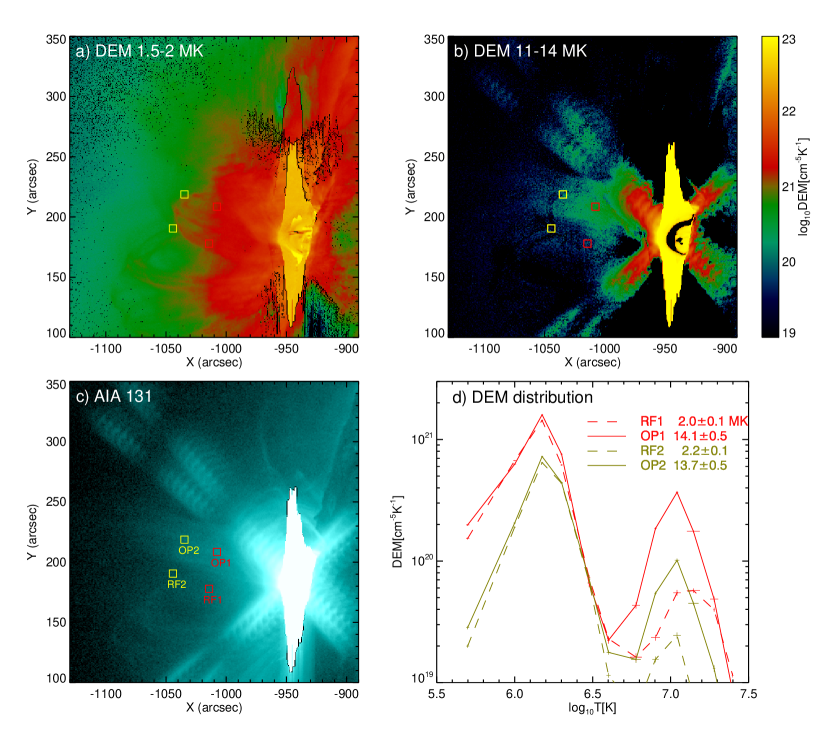
In order to confirm the high temperature of OPs, we perform a differential emission measure (DEM) analysis utilizing six AIA EUV passbands data (the optically thick 304 Å is not included), which are further processed to level 1.6 by applying the procedures aia_deconvolve_richardsonlucy and aia_prep in the Solar Software (SSW). The code developed by Hannah & Kontar (2012) is used and some results at 16:00 UT are shown in Figure 3. The background coronal plasmas generally show up in the DEM maps of temperature below 4 MK, while OPs only in high temperatures exceeding 8 MK (e.g., DEM maps in Figure 3(a,b)). In addition, four sub-regions, each including pixels2, are chosen for a detailed study, with OP1 and OP2 on the plasma jets, RF1 and RF2 nearby at similar altitudes as a reference. The DEM curves exhibit a common double peak distribution (e.g., Gou et al., 2015). Note that the cool components from OP1 and RF1 are almost the same but the hot one in OP1 is much larger than that in RF1. The DEM curves of OP2 and RF2 have a similar relation to OP1 and RF1. Thus we can conclude that the hot plasmas make a significant contribution to the observed OPs, while in the nearby reference region, the background coronal plasma dominates. We calculate the corrected mean temperature (see details in Gou et al., 2015)
| (1) |
which is only weighted by the hot DEMs above 4 MK, and obtain 14 MK for OP1 and a slightly lower value for OP2, as shown in Figure 3(d). The mean temperatures for RF1 and RF2 in Figure 3(d) are only weighted by the cool DEMs (T4 MK), because the small hot component probably comes from scattering. The uncertainties are calculated following the error propagation theory.
The sudden inward motion and the disappearance of the loop leg, as well as the simultaneously upward-moving hot plasmas in the perpendicular direction, provide strong evidence for magnetic reconnection that is driven by the inflow as exhibited by the fast inward swing of the loop leg. The hot OPs, which show both temporal and spatial consistency with the cool inflow, are therefore related to the reconnection outflow roughly moving at the Alfvén speed. So we estimate the reconnection rate at that time, , as 0.18 if using the lower inflow speed of 130 km/s, since it is measured near the reconnection site of the loop, i.e., the region above the flaring loops close to S2, where the hot outflow is observed to move upward. The speeds of the loop motion in the upper regions can be much higher but they are most probably a response to the inflow to the reconnection region below. This interpretation is confirmed by the delay of the start of the inflow swing in the higher region up to 40 seconds (e.g., compare those in Figure 2 (e) and (f)).
2.2 X-ray Observation
2.2.1 X-ray Fluxes
Figure 2(a) shows GOES and RHESSI X-ray fluxes during the impulsive phase of the flare. The RHESSI fluxes in the 6–12 and 12–25 keV bands have similar temporal evolution to that from GOES 1–8 Å, with gradual time variation and two distinct energy-release episodes. While the fluxes of high energy bands vary rapidly and closely resemble the GOES time derivative, consistent with the well-known Neupert effect (Neupert, 1968; Veronig et al., 2002). Note that right after 16:00 UT, i.e., the time of magnetic reconnection of the loop observed in the AIA EUV channels, RHESSI fluxes show strong bursts of high-energy emissions from flare-accelerated particles up to the –ray range, i.e., 500 keV. This huge energy release and accelerated particles to such high energies further confirms the strong reconnection process.
2.2.2 RHESSI Imaging
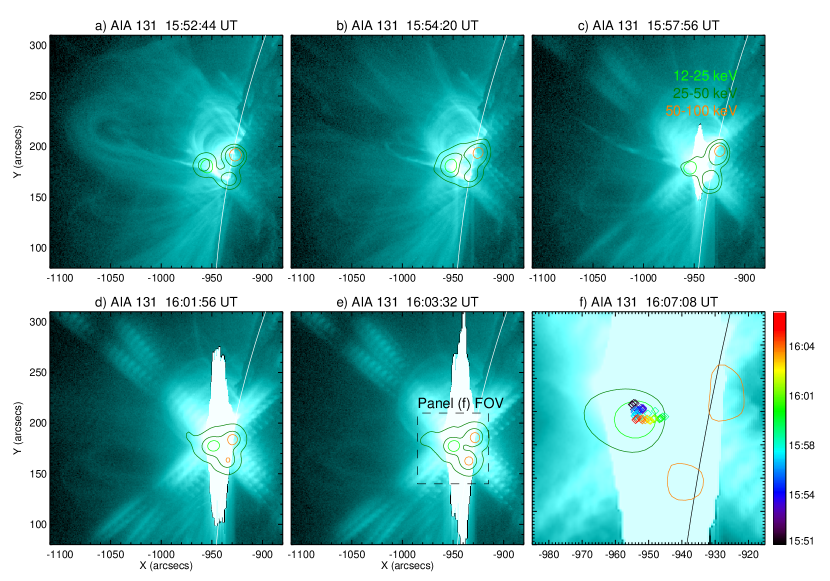
We reconstruct RHESSI X-ray images with the CLEAN algorithm using front detector segments 3–9, integrating over 20s time intervals. Figure 4 and its animation show the 12–25, 25–50 and 50–100 keV sources which are plotted on corresponding AIA 131 Å images. The 12–25 keV and 50–100 keV emissions mainly come from the flare LT and footpoints respectively, and 25–50 keV emission comes from both of them. One can see an extended source in 25–50 keV above the LT after 16:00 UT, similar to that in Figure 4 of Martínez Oliveros et al. (2014).
We determine the centroid of emission above 70% of the peak flux to study the evolution of the LT source location (Veronig et al., 2006). In Figure 4(f) we plot the motion locus of RHESSI 12–25 keV LT sources. It shows both downward and upward motions with respect to the solar surface. The axis of motion, which is determined by a linear fit to the centroid data, is offset from the solar radial direction by 6 toward north. We therefore use the distance above the solar surface as the height of sources, and the evolutions of 6–12 and 12–25 keV sources are shown in Figure 2(c). The 12–25 keV sources are located slightly above the 6–12 keV ones, indicating hotter flare loops are higher, which is consistent with the standard flare model. Note that there is a sharp decrease of the LT source height at around 15:59 UT, in which the 12–25 keV LT drops from 16 Mm to 10 Mm within less than 80 seconds with a speed of 80 km/s. This is similar to the LT altitude decrease observed in the early stage of flares but much faster and stronger, and here it coincides well with the inward swing of the loop leg in AIA 304 Å (see Figure 2 (c,e,f)). Thereafter, the LT source continues to move upward, indicating continuous rising of the current sheet and reconnection site.
2.2.3 X-ray Spectra
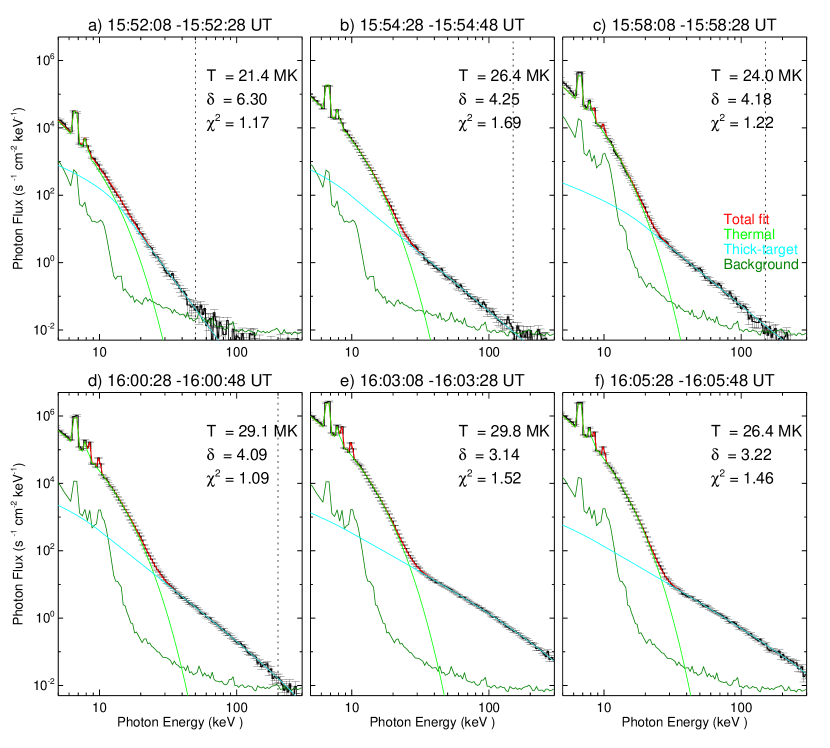
We derive the RHESSI spectra accumulated over 20s intervals from 15:50 UT to 16:05 UT using front detector 1 and fit them with an isothermal component (f_vth) plus a thick-target bremsstrahlung function (f_thick2) of a power-law electron distribution (Holman, 2003). Functions f_pileup_mod and f_drm_mod are also used to correct pileup and adjust the detector response model based on the counts around the iron line complex at 6.7 keV. For intervals where the attenuator is in the A3 state (both thick and thin attenuators inserted) additional lines at 8.45 and 10 keV are also included to compensate for instrumental effects (Phillips et al., 2006). The low energy boundary of fitting is set to 6 keV as there are attenuators in for all intervals, and the high boundaries are set automatically with the keyword spex_fit_auto_erange .
Figure 5 shows some examples of background subtracted RHESSI spectra and fitting results. The obtained spectral fits are acceptable with reduced 1. After 16:00 UT the thermal temperatures increase significantly and non-thermal particles come from much higher energies. The detailed temporal evolution of fitting parameters, i.e., emission measure (EM) and temperature (T) from the thermal component, and the power-law index () of the electron distribution derived from the thick-target bremsstrahlung model, is shown in Figure 2(b). One can see that T (red cross symbols) exhibits two distinct peaks and the second one, which occurs after 16:00 UT, is higher with T 30 MK, indicating a superhot component (Lin et al., 1981) during the second episode of energy release. A thermal fit to GOES data (black and red lines) reveals a similar trend both in EM and T, although the obtained EM is larger and T is smaller due to the preferential response to relatively cooler plasma compared to RHESSI. The spectral index of the flare-accelerated electrons generally changes between 5 and 4 before 16:00 UT, while it decreases to 3 during the second energy-release episode, indicating a soft-hard-harder (SHH) evolution, which could result from magnetic trapping of energetic particles in the corona (Metcalf & Alexander, 1999).
3 Summary and Discussion
We study the X2.8 flare on 2013 May 13 which exhibits unusual two-step magnetic reconnection as well as two distinct episodes of energy release. The first episode is associated with the erupting flux rope, similar to most flare-CME events that show a close correlation between the impulsive phase of CME acceleration and the flare energy release (e.g., Zhang et al., 2001; Temmer et al., 2008). However, the interesting and anomalous behavior in this event is the second-step magnetic reconnection of one large-scale loop in the aftermath of the eruption, which is accompanied by another, even stronger energy-release episode. We present clear observations of a plethora of magnetic reconnection signatures associated with the second phase. The magnetic inflow of the loop leg is suddenly swept into the reconnection region at a very high speed of 130 km/s, faster than previous observations which generally range from 5 to 100 km/s (e.g., Yokoyama et al., 2001; Lin et al., 2005; Takasao et al., 2012; Su et al., 2013). Together with the corresponding hot outflow moving upward from that region approximately at Alfvén speed, we obtain a reconnection rate of 0.18 at that time. RHESSI observations show significant energy release and hard spectra ( 3) with emissions up to the –ray range, as well as a second larger temperature peak up to T30 MK, indicative of a superhot component.
The contraction and oscillation of the coronal loops in AIA 171 Å images can be interpreted as the coronal implosion, according to which the force balance of the loop is disrupted due to a reduction in the magnetic pressure resulted by magnetic energy release associated with the eruption (Hudson, 2000). This consequent decrease of magnetic pressure around the reconnection site can also explain the inward swing of the loop leg inflow in AIA 304 Å and simultaneously the sharp altitude decrease of the RHESSI LT source. Furthermore, the loop leg that is quickly sucked into the reconnection site causes a sudden increase in the inflow speed and magnetic flux, which can inevitably overshoot and lead to magnetic flux pileup around the current sheet. As a result, the current sheet is expected to become thinner and longer, causing a possible extension in both upward and downward directions, which is also consistent with the altitude decrease of the LT source. In return, the thinning and extension of the current sheet may trigger the tearing mode instability (Furth et al., 1963), which would lead to multiple O-type and X-type reconnection sites, therefore enhancing the reconnection rate (e.g., Lin et al. 2015 and references therein).
References
- Benz (2017) Benz, A. O. 2017, Living Reviews in Solar Physics, 14, 2
- Carmichael (1964) Carmichael, H. 1964, NASA Special Publication, 50, 451
- Fletcher et al. (2011) Fletcher, L., Dennis, B. R., Hudson, H. S., et al. 2011, Space Sci. Rev., 159, 19
- Furth et al. (1963) Furth, H. P., Killeen, J., & Rosenbluth, M. N. 1963, Physics of Fluids, 6, 459
- Gou et al. (2015) Gou, T., Liu, R., & Wang, Y. 2015, Sol. Phys., 290, 2211
- Grayson et al. (2009) Grayson, J. A., Krucker, S., & Lin, R. P. 2009, ApJ, 707, 1588
- Grigis & Benz (2004) Grigis, P. C., & Benz, A. O. 2004, A&A, 426, 1093
- Hannah & Kontar (2012) Hannah, I. G., & Kontar, E. P. 2012, A&A, 539, A146
- Hirayama (1974) Hirayama, T. 1974, Sol. Phys., 34, 323
- Holman (2003) Holman, G. D. 2003, ApJ, 586, 606
- Holman (2016) Holman, G. D. 2016, Journal of Geophysical Research (Space Physics), 121, 11
- Hudson (2000) Hudson, H. S. 2000, ApJ, 531, L75
- Hurford et al. (2002) Hurford, G. J., Schmahl, E. J., Schwartz, R. A., et al. 2002, Sol. Phys., 210, 61
- Innes et al. (1997) Innes, D. E., Inhester, B., Axford, W. I., & Wilhelm, K. 1997, Nature, 386, 811
- Ji et al. (2007) Ji, H., Huang, G., & Wang, H. 2007, ApJ, 660, 893
- Kopp & Pneuman (1976) Kopp, R. A., & Pneuman, G. W. 1976, Sol. Phys., 50, 85
- Lemen et al. (2012) Lemen, J. R., Title, A. M., Akin, D. J., et al. 2012, Sol. Phys., 275, 17
- Lin et al. (2005) Lin, J., Ko, Y.-K., Sui, L., et al. 2005, ApJ, 622, 1251
- Lin et al. (2015) Lin, J., Murphy, N. A., Shen, C., et al. 2015, Space Sci. Rev., 194, 237
- Lin et al. (2002) Lin, R. P., Dennis, B. R., Hurford, G. J., et al. 2002, Sol. Phys., 210, 3
- Lin et al. (1981) Lin, R. P., Schwartz, R. A., Pelling, R. M., & Hurley, K. C. 1981, ApJ, 251, L109
- Liu (2013) Liu, R. 2013, MNRAS, 434, 1309
- Liu et al. (2010) Liu, R., Lee, J., Wang, T., et al. 2010, ApJ, 723, L28
- Liu & Wang (2010) Liu, R., & Wang, H. 2010, ApJ, 714, L41
- Liu et al. (2009) Liu, R., Wang, H., & Alexander, D. 2009, ApJ, 696, 121
- Liu et al. (2013) Liu, W., Chen, Q., & Petrosian, V. 2013, ApJ, 767, 168
- Liu et al. (2008) Liu, W., Petrosian, V., Dennis, B. R., & Jiang, Y. W. 2008, ApJ, 676, 704-716
- Martínez Oliveros et al. (2014) Martínez Oliveros, J.-C., Krucker, S., Hudson, H. S., et al. 2014, ApJ, 780, L28
- Metcalf & Alexander (1999) Metcalf, T. R., & Alexander, D. 1999, ApJ, 522, 1108
- Neupert (1968) Neupert, W. M. 1968, ApJ, 153, L59
- Pesnell et al. (2012) Pesnell, W. D., Thompson, B. J., & Chamberlin, P. C. 2012, Sol. Phys., 275, 3
- Phillips et al. (2006) Phillips, K. J. H., Chifor, C., & Dennis, B. R. 2006, ApJ, 647, 1480
- Russell et al. (2015) Russell, A. J. B., Simões, P. J. A., & Fletcher, L. 2015, A&A, 581, A8
- Saint-Hilaire et al. (2014) Saint-Hilaire, P., Schou, J., Martínez Oliveros, J.-C., et al. 2014, ApJ, 786, L19
- Savage et al. (2012) Savage, S. L., Holman, G., Reeves, K. K., et al. 2012, ApJ, 754, 13
- Schou et al. (2012) Schou, J., Scherrer, P. H., Bush, R. I., et al. 2012, Sol. Phys., 275, 229
- Simões et al. (2013) Simões, P. J. A., Fletcher, L., Hudson, H. S., & Russell, A. J. B. 2013, ApJ, 777, 152
- Smith et al. (2002) Smith, D. M., Lin, R. P., Turin, P., et al. 2002, Sol. Phys., 210, 33
- Sturrock (1966) Sturrock, P. A. 1966, Nature, 211, 695
- Sui & Holman (2003) Sui, L., & Holman, G. D. 2003, ApJ, 596, L251
- Sui et al. (2004) Sui, L., Holman, G. D., & Dennis, B. R. 2004, ApJ, 612, 546
- Su et al. (2013) Su, Y., Veronig, A. M., Holman, G. D., et al. 2013, Nature Physics, 9, 489
- Takasao et al. (2012) Takasao, S., Asai, A., Isobe, H., & Shibata, K. 2012, ApJ, 745, L6
- Temmer et al. (2008) Temmer, M., Veronig, A. M., Vršnak, B., et al. 2008, ApJ, 673, L95
- Veronig et al. (2006) Veronig, A. M., Karlický, M., Vršnak, B., et al. 2006, A&A, 446, 675
- Veronig et al. (2002) Veronig, A., Vršnak, B., Dennis, B. R., et al. 2002, A&A, 392, 699
- Wang et al. (2007) Wang, T., Sui, L., & Qiu, J. 2007, ApJ, 661, L207
- Yokoyama et al. (2001) Yokoyama, T., Akita, K., Morimoto, T., Inoue, K., & Newmark, J. 2001, ApJ, 546, L69
- Zhang et al. (2001) Zhang, J., Dere, K. P., Howard, R. A., Kundu, M. R., & White, S. M. 2001, ApJ, 559, 452
- Zhu et al. (2016) Zhu, C., Liu, R., Alexander, D., & McAteer, R. T. J. 2016, ApJ, 821, L29