Andromeda’s Parachute: A Bright Quadruply Lensed Quasar at
Abstract
We present Keck Cosmic Web Imager spectroscopy of the four putative images of the lensed quasar candidate J014709+463037 recently discovered by Berghea et al. (2017). The data verify the source as a quadruply lensed, broad absorption-line quasar having . We detect intervening absorption in the Fe II , Mg II , and/or C IV transitions in eight foreground systems, three of which have redshifts consistent with the photometric-redshift estimate reported for the lensing galaxy (). By virtue of their positions on the sky, the source images probe these absorbers over transverse physical scales of –21 kpc, permitting assessment of the variation in metal-line equivalent width as a function of sight-line separation. We measure differences in of across all sight-line pairs subtending 7–21 kpc, suggestive of a high degree of spatial coherence for Mg II-absorbing material. is observed to vary by % over the same scales across the majority of sight-line pairs, while C IV absorption exhibits a wide range in differences of –80% within transverse distances kpc. J014709+463037 is one of only a handful of quadruply lensed systems for which all four source images are very bright (–17.7 mag) and are easily separated in ground-based seeing conditions. As such, it is an ideal candidate for higher-resolution spectroscopy probing the spatial variation in the kinematic structure and physical state of intervening absorbers.
1 Introduction
Strong gravitational lensing of high-redshift quasars has proven a powerful astrophysical and cosmological tool for a myriad of applications. Experiments range from high-fidelity spectroscopy probing the structure of the broad-line region surrounding the host active galactic nuclei (e.g., Rauch & Blandford, 1991; Sluse et al., 2012) to time domain observations constraining cosmological parameters (e.g., Bonvin et al., 2017). However, the brightest and most valuable of these sources are rare. Candidate lensed quasars may now be efficiently identified via color and morphological selection techniques (e.g., Schechter et al., 2017) or using variability criteria (e.g., Kochanek et al., 2006) in wide-field optical and near-infrared imaging surveys (e.g., Inada et al., 2012; Diehl et al., 2014; Shanks et al., 2015). Follow-up spectroscopy is then always required to confirm the nature of the system.
Recently, Berghea et al. (2017) identified a quadruply lensed quasar candidate in imaging obtained by the Panoramic Survey Telescope and Rapid Response System (hereafter PS1; Chambers et al., 2016). Astrometry of the components implies distances between source images of –. They reported satisfactory spectral energy distribution (SED) fits to the source photometry for quasar templates at both and . Additionally, they found that SED modeling of the photometry of the prospective lens galaxy yields a best-fit redshift .
In principle, images of a source QSO at lensed by a foreground system at and separated by 1.3– probe physical scales of –21 kpc at –2. Such a configuration is highly valuable for study of the transverse small-scale coherence of circumgalactic medium (CGM) absorption. The brightness of this particular candidate (–17.7 mag) and relatively large separation of the source images enable high-signal-to-noise (S/N) spectroscopy with maximum efficiency.

In this Letter, we present spectroscopy from the recently-commissioned Keck Cosmic Web Imager (KCWI; Morrissey, P. et al. 2017, in prep.) confirming that this system (J014709+463037) is a quadruply lensed quasar at . We then analyze intervening metal-line absorption systems for constraints on their spatial coherence. Given the source image configuration and its location on the sky, we refer to this object as “Andromeda’s Parachute.”111The NASA Apollo and Orion command modules and SpaceX Dragon capsule (source image D) made ocean landings with the aid of a parachute system (A–C). We adopt the WMAP5 cosmology (, , and ; Komatsu et al. 2009) throughout this work unless otherwise specified.

2 Observations
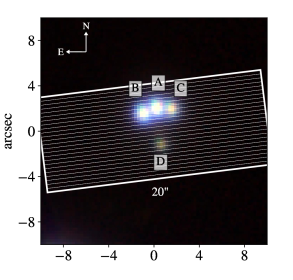
We observed J014709+463037 with KCWI on the night of 2017 June 21 UT. The instrument was configured with the Small image slicer and the BL grating, providing a spatial sampling of and a spectral resolution . The field-of-view of KCWI in this configuration is , permitting simultaneous spectroscopy of all four source images in a single pointing. PS1 imaging of the target and the placement of the KCWI footprint is shown in Figure 1 (left panel). The image slices were oriented at a position angle of . We obtained two exposures of 600 s each while the target was at airmass –1.6.
The data were reduced using the publicly-available kderp package.222See https://github.com/kcwidev/kderp. We used in-house software to rectify the curved object traces along the cube resulting from differential atmospheric dispersion. The final rectified KCWI image, averaged over the wavelength range , is shown in the right-hand panel of Figure 1.
To extract one-dimensional spectra from this rectified cube, we performed a simple sum of the flux over the spatial dimensions in -pixel sub-cubes centered on each source image (see red apertures in Figure 1, right panel). A sky spectrum was extracted in the same manner from an off-source region of the datacube and was subtracted from each of the on-source spectra. We then co-added the 1D spectra extracted from the two 600-s exposures for each source image. These co-added 1D spectra are shown in Figure 2, and have median S/N per pixel measured redward of the quasar emission line of , , , and in images A, B, C, and D, respectively.
3 Spectroscopic Analysis
Figure 2 makes evident that each source image originates from the same high-redshift quasar. The complex absorption features blanketing the quasar’s broad , Si IV, and C IV emission lines (at Å, Å, and Å) indicate it belongs to the broad absorption line (BAL) quasar subclass (Weymann et al., 1991).
3.1 Redshift of J014709+463037
To measure the quasar redshift, we cross-correlate the quasar template used in Hewett & Wild (2010) with each of the four spectra shown in Figure 2. Given the BAL nature of J014709+463037, we exclude the template blueward of restframe Å (i.e., the and N V QSO emission lines). We fit a Gaussian to the peak of the cross-correlation, adopting the best-fit Gaussian centroid as the redshift for each source image. We adopt the mean and sample standard deviation of the four measurements as the source redshift . Observations at longer wavelengths are needed to constrain the redshift to higher precision.
3.2 Intervening Absorption
We visually inspected each spectrum to identify foreground metal-line absorption, focusing in particular on the identification of C IV , Mg II , and Fe II transitions known to arise in collisionally ionized or photoionized diffuse media at temperatures K (Bergeron & Stasińska, 1986). We fit a Gaussian function to each absorber to determine its wavelength centroid, and calculate a redshift for each absorption system () from the average redshift of the centroids of every associated absorption feature. We measure observed equivalent widths () using a boxcar sum of the flux decrement over the velocity range of each line, and compute rest equivalent width using .
We summarize these systems in Table 1 and indicate them with vertical lines in Figure 2. The reported uncertainties in the rest equivalent widths, do not include errors associated with continuum normalization. The effect of continuum-level placement on the measurement of equivalent width can often be significant, especially for BAL quasars observed at the medium spectral resolution of our KCWI configuration. However, systematic error in continuum placement is likely to be similar across the four sight lines. We therefore expect analysis of the relative variation in at a given to be insensitive to these uncertainties.
| Sight Line | Redshift | Transition () | ||
|---|---|---|---|---|
| (Å) | (mÅ) | (mÅ) | ||
| A | 0.5775 | Mg II (2796) | 96.2 | 4.6 |
| A | 0.6069 | Mg II (2796) | 437.2 | 3.9 |
| A | Fe II (2600) | 74.0 | 2.4 | |
| A | 1.0491 | Fe II (2600) | 189.4 | 3.6 |
| A | 1.7587 | C IV (1548) | 91.2 | 2.0 |
| A | 1.7525 | C IV (1548) | 78.6 | 2.1 |
| A | 2.0371 | C IV (1548) | 137.4 | 2.1 |
| A | Si IV (1393) | 137.4 | 1.9 | |
| A | H I (1216) | 1713.5 | 4.2 | |
| A | 2.0386 | C IV (1548) | 35.5 | 2.0 |
| A | 2.1766 | C IV (1548) | 26.8 | 2.4 |
| B | 0.5776 | Mg II (2796) | 106.0 | 4.9 |
| B | 0.6070 | Mg II (2796) | 267.7 | 6.3 |
| B | Fe II (2600) | 22.8 | 2.2 | |
| B | 1.0491 | Fe II (2600) | 71.5 | 4.1 |
| B | 1.7586 | C IV (1548) | 100.2 | 2.2 |
| B | 2.0371 | C IV (1548) | 111.0 | 2.3 |
| B | Si IV (1393) | 111.0 | 2.0 | |
| B | H I (1216) | 1741.2 | 4.4 | |
| B | 2.0388 | C IV (1548) | 28.03 | 2.3 |
| B | 2.1767 | C IV (1548) | 24.7 | 2.4 |
| C | 0.5772 | Mg II (2796) | 143.6 | 7.5 |
| C | 0.6068 | Mg II (2796) | 376.9 | 6.1 |
| C | Fe II (2600) | 36.6 | 3.6 | |
| C | 1.0494 | Fe II (2600) | 481.4 | 6.4 |
| C | 1.7585 | C IV (1548) | 126.2 | 3.1 |
| C | 2.0370 | C IV (1548) | 120.1 | 2.4 |
| C | Si IV (1393) | 120.1 | 2.7 | |
| C | H I (1216) | 1649.4 | 5.8 | |
| C | 2.0387 | C IV (1548) | 53.6 | 2.3 |
| C | 2.1765 | C IV (1548) | 45.4 | 4.3 |
| D | 0.5762 | Mg II (2796) | 129.9 | 15.5 |
| D | 0.5768 | Mg II (2796) | 102.2 | 13.9 |
| D | 0.6069 | Mg II (2796) | 322.7 | 18.8 |
| D | Fe II (2600) | 42.8 | 10.8 | |
| D | 0.7584 | Mg II (2796) | 965.5 | 20.2 |
| D | Fe II (2600) | 715.6 | 23.2 | |
| D | 1.0487 | Fe II (2600) | 619.6 | 13.5 |
| D | 1.7587 | C IV (1548) | 21.8 | 6.6 |
| D | 2.0370 | C IV (1548) | 132.9 | 7.4 |
| D | Si IV (1393) | 132.9 | 2.7 | |
| D | H I (1216) | 1649.4 | 5.8 | |
| D | 2.0387 | C IV (1548) | 25.0 | 6.7 |
Note. — The observed wavelength of each of these absorbers is indicated above the corresponding source image spectrum in Figure 2.
Given the complexity of the spectra of J014709+463037 and the resolution of these data, we do not attempt to identify metal absorption lines in the forest, and we are likely missing absorption lines contaminated by the BAL features dominating the regions near the quasar emission lines. Higher resolution data will be required to perform a comprehensive analysis of intervening absorption; however, we discuss some preliminary findings based on the present dataset in Section 3.4.
The KCWI data were not of sufficient depth to detect emission from the lensing galaxy, and hence cannot directly constrain its redshift. We note that three intervening absorbers are found to have redshifts within the - photometric errors of the Berghea et al. redshift estimate for the lens (); in addition, two of these systems are detected in all four source images. One of these latter systems, identified at in sight line A, has a redshift very close to the best-fit photometric estimate. Moreover, source image D (the image closest to the expected position of the lens in projection) exhibits a two-component absorbing structure in the system near (having and 0.5768). These double components are not exhibited in any of the other sight lines at , and are suggestive of the complex, multiple-component Mg II absorbers typically observed close to bright galaxies (e.g., Kacprzak et al., 2010; Chen et al., 2014). Sight line D also exhibits strong Mg II absorption at that is not detected in the other sight lines due to blending with a higher-redshift C IV absorber (at ), raising the possibility that this system is associated with the lensing galaxy. Without a spectrum of the lens itself, we cannot be certain of its redshift; however, the detection of absorption in every sight line at , its complex velocity structure in sight line D, and the consistency of this redshift with photometric constraints from Berghea et al. (2017) leads us to adopt in our analysis below.
3.3 Sight Line Geometry
To compute the transverse separation of the four sight lines as a function of absorber redshift, we refer to Equation (5) in Cooke et al. (2010):
| (1) |
where is the observed angular separation between the sight lines and is the co-moving distance to the redshift , with L, S, and ‘abs’ indicating the lens, source, and absorber, respectively. For these calculations, we assume that the source is located directly behind the center of mass of the lensing galaxy.
Adopting and a source redshift , we show the resulting physical separations between all sight-line combinations at the redshifts of several of the systems identified in Section 3.2 in Table 2. If instead or , each distance would increase by a factor of or , respectively. The J014709+463037 system thus permits assessment of the variation in the strength and velocity structure of foreground absorption on scales of a kiloparsec at , –10 kpc at , and –20 kpc at .
| Sight Line Pair | ||||||||
|---|---|---|---|---|---|---|---|---|
| () | (kpc) | (kpc) | (kpc) | (kpc) | (kpc) | (kpc) | (kpc) | |
| A-B | 1.26 | 7.7 | 7.4 | 5.9 | 3.8 | 1.1 | 0.51 | 0.28 |
| A-C | 1.27 | 7.8 | 7.5 | 5.9 | 3.8 | 1.1 | 0.51 | 0.28 |
| A-D | 3.34 | 20.4 | 19.5 | 15.5 | 10.0 | 2.9 | 1.3 | 0.73 |
| B-C | 2.48 | 15.2 | 14.5 | 11.6 | 7.5 | 2.2 | 1.0 | 0.54 |
| B-D | 3.28 | 20.1 | 19.2 | 15.3 | 9.9 | 2.9 | 1.3 | 0.72 |
| C-D | 3.35 | 20.5 | 19.6 | 15.6 | 10.1 | 2.9 | 1.3 | 0.73 |

3.4 Coherence in across Multiple, Close Sight Lines
The analysis described in Section 3.2 revealed 7–8 securely-detected intervening absorption systems toward every quasar image. For all of these systems, with the exception of the C IV absorber at in sight line A and the Mg II absorber at in sight line D, we detect counterpart absorbers within a velocity range , with the vast majority of the counterparts lying within . Given the physical separation of the sight lines, this finding is suggestive of absorbing structures extending over relatively large scales (e.g., –20 kpc at ). To quantitatively assess the physical extent of these absorbers and the scale over which their varies, we compute the fractional difference in values measured at a given for each pair of sight lines, , where sight line X has the stronger absorption of the two. We show these fractional differences for Mg II (filled circles) and Fe II (filled squares) systems in the upper panel of Figure 3 vs. physical separation of the sight line pair (taken from Table 2). The lower panel of the Figure shows the same measurements for our C IV systems (filled circles). Each point is color coded by the corresponding value of .
Considering the two Mg II systems at and , we measure small fractional differences () across the full range of sight line separations (kpc), pointing to a high degree of coherence over large scales even for these relatively weak absorbers (having Å). The two Fe II systems, on the other hand, exhibit a much greater degree of variation in absorption strength, yielding fractional differences of between every sight line pair. We find that the four C IV systems exhibit a quite high degree of variation, with differences ranging between and over kpc separations. Such a wide range of values points to gas densities which vary on sub-kpc scales for the weakest of these absorbers (with Å).
Figure 3 also includes similar measurements collected from the literature analyzing intervening C IV 1548, Mg II 2796, and Fe II 2600 absorption along lensed quasar sight lines. For each system, we adopt updated constraints on where available and recalculate the transverse physical sight-line separations assuming the WMAP5 (Komatsu et al., 2009) cosmology (with one exception described below). In detail, we include systems from Young et al. (1981); Foltz et al. (1984); Smette et al. (1992, 1995); Monier et al. (1998); Lopez et al. (1999) and Chen et al. (2014). For absorbers from Foltz et al. (1984), we assume and an angular sight-line separation of (Sol et al., 1984). In the case of absorbers from Smette et al. (1995), we assume as in Lopez et al. (1999). The Monier et al. (1998) study focused on the Cloverleaf lens, for which is still not precisely known; here we adopt as estimated in Goicoechea & Shalyapin (2010). For absorbers from Chen et al. (2014), we do not compute sight-line separations, and instead adopt the physical distances listed in that work (although they assume slightly different cosmological parameters). Fractional differences (or lower limits in cases in which an absorber is securely detected along only one sight line) for each of these systems are indicated with open stars (C IV and Mg II) and filled crosses (Fe II) in Figure 3. 333There are a few additional studies which offer detailed analysis of metal-line absorption along lensed quasar sight lines (e.g., Rauch et al., 1999, 2002; Churchill et al., 2003); however, because these authors did not report equivalent widths, we do not include them here.
Taken together, these measurements point to varying degrees of spatial coherence for the three metal-line transitions examined. In the case of Mg II , 22 of the 25 absorber pairs exhibit fractional differences of over a wide range of sight line separations (kpc). This level of coherence is exhibited by both strong (Å) and weak (Å) systems. Eight of these pairs have fractional differences , and again have a wide range of maximum . Such small variations are suggestive of Mg II-absorbing clouds or cloud complexes extending over areas several kiloparsecs across for both strong and weak Mg II systems.
Turning to the Fe II absorbers, we find that the majority of their fractional differences are . While the number of sight lines probing this transition is small, this suggests that the bulk of the Fe II-absorbing material in these structures typically extends over kpc. Additional measurements probing smaller physical separations will be valuable for tightening this constraint.
Finally, we find that the C IV systems exhibit a high degree of coherence over the physical scales probed. Among the 57 absorber pairs shown, 50 have fractional differences , and 22 have fractional differences . Generally speaking, small fractional differences are exhibited over the full range of maximum values; however, we also note that the strongest absorbers in the sample (with Å) all have fractional differences . Again, this finding points to C IV-absorbing structures extending over at least kpc, and is suggestive of longer coherence lengths for stronger absorbers.
4 Discussion
The study of intervening absorption-line systems observed in background quasar spectroscopy has proven essential for assessing, e.g., the neutral gas content of the Universe (Wolfe et al., 2005) and the evolution of its metal content (Simcoe et al., 2011; Lehner et al., 2014). In spite of these advances, numerous open questions remain regarding the physical nature of the absorbers themselves. Cosmological simulations predict that many of these systems arise in the environments of luminous galaxies, tracing cool inflowing streams or large-scale outflows driven by star formation (e.g., Fumagalli et al., 2011; Shen et al., 2013; Faucher-Giguère et al., 2015). However, it has proven difficult to leverage such predictions for constraints on the physical origins of a given observed absorber population.
A crucial limitation has been our lack of information on the sizes and morphologies of the absorbing structures. Because background quasars provide only a pencil-beam probe, constraints on the physical extent of these systems have been obtained via modeling of the ionization state of the gas (Churchill & Charlton, 1999; Stocke et al., 2013; Werk et al., 2014). However, these analyses are subject to substantial systematic uncertainties (e.g., in the shape of the extragalactic ionizing background spectrum, and in the cloud geometry / density profile), and typically may only be used to constrain the cloud thickness to within an order of magnitude (e.g., Werk et al., 2014).
Spectroscopy of multiple, close background sight lines offers a valuable alternative probe of absorber morphology by mapping the transverse dimension. Gravitationally-lensed quasars are perhaps the most efficient such sources, as they may be very bright, and produce similar continua at a given . Overall, the variations observed in these systems (summarized in Figure 3) indicate that either (1) each gas cloud composing the absorbers extends across the physical separation of the beams; or (2) they arise from extended structures made up of numerous smaller clouds with similar velocity spread and/or column density along any given sight line.
Ultimately, higher spectral resolution () will be required to distinguish between these scenarios, as it permits detailed comparison of the column densities, velocity centroids, and line widths of individual absorbing components across the sightlines (e.g., Rauch et al., 1999, 2001, 2002; Chen et al., 2014). A spectroscopic survey for galaxies associated with these absorbers will allow us to establish their context within the CGM, and will in addition test a basic assumption invoked by most CGM studies to date. Mg II absorbers with strengths similar to those in our sample (with Å) are common within projected distances kpc of galaxies at low redshift (; Chen et al. 2010). However, constraints on the distribution in these environments come from the assembly of numerous projected QSO-galaxy pairs, each of which probes an independent halo. Larger samples of lensed QSOs probing foreground systems (e.g., Chen et al., 2014) will provide a critical test of the standard interpretation that the distribution of absorbers observed toward numerous QSO-galaxy pairs is representative of the absorption profile in an individual galaxy CGM.
Moreover, measurement of the sizes, velocity coherence, and metallicity of such absorbers will permit quantitative comparisons to the CGM features predicted in hydrodynamical ‘zoom’ simulations, differentiating between smooth accretion streams, gas associated with infalling satellites, and the turbulent, clumpy flows arising from stellar feedback (e.g Shen et al., 2013; Nelson et al., 2015; Faucher-Giguère et al., 2015; Fielding et al., 2017). Such constraints will in addition be necessary to test formalisms suggesting that the CGM cools via “shattering”, resulting in a high covering fraction of parsec-scale, photoionized cloudlets (McCourt et al., 2016). With lensed QSOs expected to be discovered in the ongoing PS1 and Dark Energy Surveys (Dark Energy Survey Collaboration et al., 2016), and several thousand to be uncovered by LSST (Ivezic et al., 2008; Oguri & Marshall, 2010), this technique will soon become the state of the art in CGM studies.
References
- Bergeron & Stasińska (1986) Bergeron, J., & Stasińska, G. 1986, A&A, 169, 1
- Berghea et al. (2017) Berghea, C. T., Nelson, G. J., Rusu, C. E., Keeton, C. R., & Dudik, R. P. 2017, ArXiv e-prints
- Bonvin et al. (2017) Bonvin, V., et al. 2017, MNRAS, 465, 4914
- Chambers et al. (2016) Chambers, K. C., et al. 2016, ArXiv e-prints
- Chen et al. (2014) Chen, H.-W., Gauthier, J.-R., Sharon, K., Johnson, S. D., Nair, P., & Liang, C. J. 2014, MNRAS, 438, 1435
- Chen et al. (2010) Chen, H.-W., Helsby, J. E., Gauthier, J.-R., Shectman, S. A., Thompson, I. B., & Tinker, J. L. 2010, ApJ, 714, 1521
- Churchill & Charlton (1999) Churchill, C. W., & Charlton, J. C. 1999, AJ, 118, 59
- Churchill et al. (2003) Churchill, C. W., Mellon, R. R., Charlton, J. C., & Vogt, S. S. 2003, ApJ, 593, 203
- Cooke et al. (2010) Cooke, R., Pettini, M., Steidel, C. C., King, L. J., Rudie, G. C., & Rakic, O. 2010, MNRAS, 409, 679
- Crighton et al. (2015a) Crighton, N. H. M., Hennawi, J. F., Simcoe, R. A., Cooksey, K. L., Murphy, M. T., Fumagalli, M., Prochaska, J. X., & Shanks, T. 2015a, MNRAS, 446, 18
- Dark Energy Survey Collaboration et al. (2016) Dark Energy Survey Collaboration et al. 2016, MNRAS, 460, 1270
- Diehl et al. (2014) Diehl, H. T., et al. 2014, in Proc. SPIE, Vol. 9149, Observatory Operations: Strategies, Processes, and Systems V, 91490V
- Faucher-Giguère et al. (2015) Faucher-Giguère, C.-A., Hopkins, P. F., Kereš, D., Muratov, A. L., Quataert, E., & Murray, N. 2015, MNRAS, 449, 987
- Fielding et al. (2017) Fielding, D., Quataert, E., McCourt, M., & Thompson, T. A. 2017, MNRAS, 466, 3810
- Foltz et al. (1984) Foltz, C. B., Weymann, R. J., Roser, H.-J., & Chaffee, Jr., F. H. 1984, ApJ, 281, L1
- Fumagalli et al. (2011) Fumagalli, M., Prochaska, J. X., Kasen, D., Dekel, A., Ceverino, D., & Primack, J. R. 2011, MNRAS, 418, 1796
- Goicoechea & Shalyapin (2010) Goicoechea, L. J., & Shalyapin, V. N. 2010, ApJ, 708, 995
- Hewett & Wild (2010) Hewett, P. C., & Wild, V. 2010, MNRAS, 405, 2302
- Inada et al. (2012) Inada, N., et al. 2012, AJ, 143, 119
- Ivezic et al. (2008) Ivezic, Z., et al. 2008, Serbian Astronomical Journal, 176, 1
- Kacprzak et al. (2010) Kacprzak, G. G., Churchill, C. W., Ceverino, D., Steidel, C. C., Klypin, A., & Murphy, M. T. 2010, ApJ, 711, 533
- Kochanek et al. (2006) Kochanek, C. S., Mochejska, B., Morgan, N. D., & Stanek, K. Z. 2006, ApJ, 637, L73
- Komatsu et al. (2009) Komatsu, E., et al. 2009, ApJS, 180, 330
- Lehner et al. (2014) Lehner, N., O’Meara, J. M., Fox, A. J., Howk, J. C., Prochaska, J. X., Burns, V., & Armstrong, A. A. 2014, ApJ, 788, 119
- Lopez et al. (1999) Lopez, S., Reimers, D., Rauch, M., Sargent, W. L. W., & Smette, A. 1999, ApJ, 513, 598
- Markwardt (2009) Markwardt, C. B. 2009, in Astronomical Society of the Pacific Conference Series, Vol. 411, Astronomical Data Analysis Software and Systems XVIII, ed. D. A. Bohlender, D. Durand, & P. Dowler, 251
- McCourt et al. (2016) McCourt, M., Oh, S. P., O’Leary, R. M., & Madigan, A.-M. 2016, ArXiv e-prints
- Monier et al. (1998) Monier, E. M., Turnshek, D. A., & Lupie, O. L. 1998, ApJ, 496, 177
- Nelson et al. (2015) Nelson, D., Genel, S., Vogelsberger, M., Springel, V., Sijacki, D., Torrey, P., & Hernquist, L. 2015, MNRAS, 448, 59
- Oguri & Marshall (2010) Oguri, M., & Marshall, P. J. 2010, MNRAS, 405, 2579
- Rauch & Blandford (1991) Rauch, K. P., & Blandford, R. D. 1991, ApJ, 381, L39
- Rauch et al. (1999) Rauch, M., Sargent, W. L. W., & Barlow, T. A. 1999, ApJ, 515, 500
- Rauch et al. (2001) —. 2001, ApJ, 554, 823
- Rauch et al. (2002) Rauch, M., Sargent, W. L. W., Barlow, T. A., & Simcoe, R. A. 2002, ApJ, 576, 45
- Rubin et al. (2015) Rubin, K. H. R., Hennawi, J. F., Prochaska, J. X., Simcoe, R. A., Myers, A., & Lau, M. W. 2015, ApJ, 808, 38
- Rudie et al. (2012) Rudie, G. C., et al. 2012, ApJ, 750, 67
- Schechter et al. (2017) Schechter, P. L., Morgan, N. D., Chehade, B., Metcalfe, N., Shanks, T., & McDonald, M. 2017, AJ, 153, 219
- Shanks et al. (2015) Shanks, T., et al. 2015, MNRAS, 451, 4238
- Shen et al. (2013) Shen, S., Madau, P., Guedes, J., Mayer, L., Prochaska, J. X., & Wadsley, J. 2013, ApJ, 765, 89
- Simcoe et al. (2011) Simcoe, R. A., et al. 2011, ApJ, 743, 21
- Sluse et al. (2012) Sluse, D., Hutsemékers, D., Courbin, F., Meylan, G., & Wambsganss, J. 2012, A&A, 544, A62
- Smette et al. (1995) Smette, A., Robertson, J. G., Shaver, P. A., Reimers, D., Wisotzki, L., & Koehler, T. 1995, A&AS, 113, 199
- Smette et al. (1992) Smette, A., Surdej, J., Shaver, P. A., Foltz, C. B., Chaffee, F. H., Weymann, R. J., Williams, R. E., & Magain, P. 1992, ApJ, 389, 39
- Sol et al. (1984) Sol, H., Vanderriest, C., Schneider, J., Lelievre, G., & Pedersen, H. 1984, A&A, 132, 105
- Stocke et al. (2013) Stocke, J. T., Keeney, B. A., Danforth, C. W., Shull, J. M., Froning, C. S., Green, J. C., Penton, S. V., & Savage, B. D. 2013, ApJ, 763, 148
- Werk et al. (2014) Werk, J. K., et al. 2014, ApJ, 792, 8
- Weymann & Foltz (1983) Weymann, R. J., & Foltz, C. B. 1983, ApJ, 272, L1
- Weymann et al. (1991) Weymann, R. J., Morris, S. L., Foltz, C. B., & Hewett, P. C. 1991, ApJ, 373, 23
- Wolfe et al. (2005) Wolfe, A. M., Gawiser, E., & Prochaska, J. X. 2005, ARA&A, 43, 861
- Young et al. (1981) Young, P., Sargent, W. L. W., Oke, J. B., & Boksenberg, A. 1981, ApJ, 249, 415