Lattice dynamics of quasi-two-dimensional CdSe nanoplatelets
and their Raman and infrared spectra
Abstract
Phonon spectra of CdSe nanoplatelets (2–6 ML) with the zinc-blende structure were calculated from first principles within the density-functional theory. It turned out that the Lamb modes in nanoplatelets are in fact optical rather than acoustic vibrations. Phonon spectra of the nanoplatelets show the appearance of a large number of low-frequency modes inherited from TA phonons in bulk CdSe. Calculations of the Raman spectra indicate a need to revise the interpretation of available experimental data. The largest contribution to the Raman spectra is provided by the quasi-Lamb modes with the symmetry. The modes whose frequencies depend on the environment of nanoplatelets and whose properties are closest to the properties of LO phonons explain the results obtained in the “nanoparticle-on-mirror” geometry. The features in Raman spectra previously attributed to surface optical (SO) modes should be interpreted as a manifestation of lower-order quasi-Lamb modes. Calculations of the infrared spectra find, in addition to the TO phonon line, the appearance of intense lines from surface modes originating from terminating F(Cl) atoms on the surface of nanoplatelets and true SO-modes.
pacs:
62.23.Kn, 63.22.Np, 78.30.Fs, 81.05.DzI Introduction
Vibrational spectroscopy is one of the most important methods for studying materials. The lattice dynamics determines such physical properties of solids as elastic moduli, sound velocity, heat capacity, thermal expansion, thermal conductivity, and infrared absorption. In addition, the phenomena associated with the electron-phonon interaction determine the mobility of carriers in semiconductors and the changes in their electronic structure and optical spectra with temperature.
To determine the vibration frequencies, infrared (IR) and Raman spectroscopy as well as inelastic neutron scattering are used. Since the vibration frequencies are very sensitive to the local chemical environment and the structure of materials, the measurement of these frequencies and their comparison with the calculated frequencies and atomic displacement patterns can give detailed information on atomic and electronic structure of materials.
The physical properties of semiconductor nanoplatelets are qualitatively different from those of bulk materials. In addition to the well-studied quantum size effects, this also applies to the phonon spectra of these quasi-two-dimensional systems. As was shown in a classical paper of Lamb, Lamb (1917) in the spectra of acoustic vibrations of thin plates, along with two acoustic modes with in-plane polarization, a new type of acoustic vibrations arises, in which the atoms are displaced in the out-of-plane direction and for which the quadratic dispersion law is characteristic (, where is the in-plane component of wave vector). The peculiarities of optical vibrations in thin plates were discussed in Refs. Fuchs and Kliewer, 1965; Ruppin and Englman, 1970.
The objects of this study are quasi-two-dimensional CdSe nanoplatelets with the zinc-blende (ZB) structure. Like other cadmium chalcogenides, cadmium selenide is currently an object of considerable interest due to unique optical properties which are observed in nanoobjects of various shapes and are controlled by the size effect and by creating of heterostructures. In particular, CdSe colloidal nanoplatelets with a thickness of few monolayers Ithurria and Dubertret (2008); Ithurria et al. (2011) are characterized by atomically flat surfaces. Very homogeneous thickness of the nanoplatelets results in very narrow luminescence bands. The giant oscillator strength of the exciton transitions in them Feldmann et al. (1987) results in very short luminescence decay times (hundreds of picoseconds) Tessier et al. (2012, 2013) and high absorption coefficients, which are much higher than those for quantum dots. Achtstein et al. (2015) Record narrow absorption and emission bands resulting from the thickness-dependent exciton transitions make them promising materials for the development of new types of light-emitting devices, Chen et al. (2014); Fan et al. (2015); Vitukhnovsky et al. (2015) lasers, Grim et al. (2014); She et al. (2014); Li et al. (2015) photodetectors, Lhuillier et al. (2015) and other optoelectronic devices.
The literature data on Raman and IR spectra of CdSe nanoplatelets are not too numerous. Cherevkov et al. (2013a, b); Sigle et al. (2014); Girard et al. (2016); Dzhagan et al. (2016) The main strong peak in the Raman spectra is explained by the light scattering by LO phonons whose frequency varies with a change in the nanoplatelet thickness as a result of the spatial confinement of the phonons. The weak features observed on the low-energy side of this peak are explained by surface optical (SO) phonons. Cherevkov et al. (2013a, b); Dzhagan et al. (2016) In Ref. Cherevkov et al., 2013a, b, the thickness dependence of the frequencies of LO and SO modes was studied. Under non-resonant excitation, the position of Raman peaks did not depend on the thickness. Under resonant excitation (the excitation energy was close to the energy of the exciton transition), the energy of the peaks decreased noticeably (by 2.5–7.5 cm-1) and their width slightly increased with decreasing nanoplatelets thickness. This difference in behavior was explained by preferential light scattering by LO() phonons (in the case of non-resonant excitation) or by confined LO() modes (in the case of resonant excitation). In Ref. Sigle et al., 2014, Raman spectra from individual nanoplatelets were obtained using the surface-enhanced Raman scattering (SERS) in the “nanoparticle-on-mirror” (NPOM) geometry. These spectra consisted of two overlapping lines, one of which, attributed to the LO() phonon, appeared at an energy by 7–10 cm-1 lower than the energy of the other line whose position was close to the energy of the line measured in standard geometry and ascribed to LO() phonon. In Ref. Girard et al., 2016, the low-frequency lines associated with intrinsic mechanical vibrations of nanoplatelets were detected in Raman spectra. The frequencies of these vibrations, however, were 40–50% below the calculated ones. This discrepancy was explained by the effect of heavy molecules of oleic acid located on the surfaces of nanoplatelets on the vibration frequency. In Ref. Dzhagan et al., 2016, Raman spectra of CdSe nanoplatelets were measured at low temperature (35 K) and at different excitation energies. This measurements confirmed the appreciable long-wave shift and broadening of the main line in the spectra under resonant excitation and revealed a complicated structure of the SO mode. In addition, in Ref. Dzhagan et al., 2016 the first infrared reflection spectra of CdSe nanoplatelets were obtained, and the features associated with LO and TO phonons were observed.
In this work, the first-principles calculations of the lattice dynamics of CdSe nanoplatelets are supplemented by modeling their Raman and infrared absorption spectra to better understand what information can be obtained from these optical studies. Based on the comparison of the results of calculations with available experimental data, a new, more reasonable interpretation of these data is proposed.
II Calculation details
All calculations in this paper were performed within the density functional theory using the ABINIT software package. In the calculations, the local density approximation (LDA), plane-wave basis, and norm-conserving pseudopotentials were used. The cut-off energy was 30 Ha (816 eV), the integration over the Brillouin zone for the starting FCC lattice was carried out on a 888 Monkhorst–Pack mesh. The relaxation of the unit cell parameters and atomic positions was carried out until the Hellmann–Feynman forces acting on the atoms became less than Ha/Bohr (0.25 meV/Å).
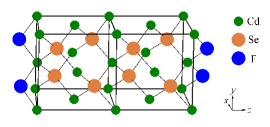
In accordance with modern concepts of the structure of CdSe nanoplatelets with the ZB structure, the studied nanoplatelets were [001]-oriented slabs, both surfaces of which ended in cadmium atoms (Fig. 1). Since the nanoplatelets contain one excess plane of Cd atoms, the extra charge of electrons introduced by these atoms requires electrical compensation. In this paper, we considered the simplest method of charge compensation using the surface F or Cl atoms. As shown in Ref. Vasiliev et al., 2017, energetically the most favorable position of these surface atoms are the bridge positions in which the halogen atoms enter the positions of the missing selenium atoms in the ZB structure (Fig. 1). Modeling of nanoplatelets was carried out using supercells to which a vacuum gap of 20 Å was added to isolate nanoplatelets from each other. The symmetry of such a supercell is described by space group. The thickness of nanoplatelets varied from 2 to 6 monolayers (ML). When modeling the nanoplatelets, 882 Monkhorst–Pack meshes were used for the integration over the Brillouin zone. All the results presented below were obtained on fully relaxed structures with stress-free surfaces.
Calculations of the phonon frequencies at the center and high-symmetry points at the boundary of the Brillouin zone, the Born effective charges , the high-frequency dielectric constant , the oscillator strengths , and the Raman susceptibility tensor were performed using the formulas obtained from the density-functional perturbation theory. Gonze and Lee (1997); Veithen et al. (2005) Raman spectra of randomly oriented nanoplatelets were obtained using the formulas given in Ref. Prosandeev et al., 2005 by calculating the rotational invariants of the Raman tensors and the Bose factors for 300 K. Infrared spectra (imaginary part of the complex dielectric constant) were calculated using the formula , where the sum runs over all modes , is the frequency of the th mode at the point, and is the unit cell volume. The calculated spectra were then averaged in order to obtain spectra of randomly oriented nanoplatelets. Dispersion curves in the phonon spectrum were calculated using the anaddb program (a part of the ABINIT package) by interpolating the results of exact calculations of phonon frequencies on a 88 mesh of wave vectors (15 irreducible points in the Brillouin zone).
III Phonon spectra of the nanoplatelets
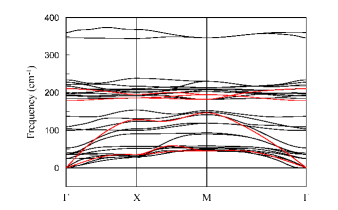
The phonon spectrum of a typical quasi-two-dimensional CdSe nanoplatelet with the ZB structure terminated by F atoms is shown in Fig. 2. In the figure we present only the dispersion curves for the square (two-dimensional) Brillouin zone because, as was confirmed by calculations on supercells, the dispersion of the phonon modes in the out-of-plane direction is absent.
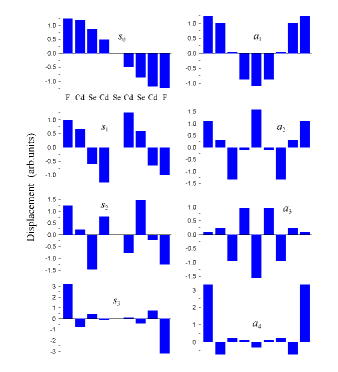
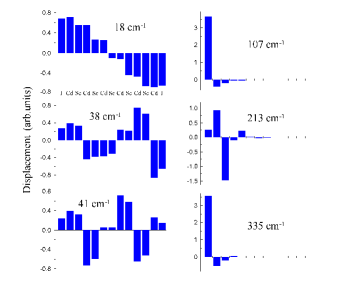
We now discuss the character of phonon modes at the point for a typical nanoplatelet with a thickness of 3 ML (nine atoms in the unit cell). After the removal of three acoustic modes corresponding to the translation of the nanoplatelet in three directions, 24 optical modes remain at the point. In 16 of them, the atomic displacements occur in the plane of the nanoplatelet (), and in the other eight modes the displacements are out-of-plane ( direction). By the character of the displacement patterns, the latter eight modes are similar to the Lamb modes (Fig. 3). The symmetric Lamb modes 111To denote symmetric and antisymmetric Lamb modes, we use the notations and , where indicates the order of the mode. The displacements of the atoms in these modes resemble the cosine function, with the wave periods for symmetric modes, and full periods for antisymmetric modes. (symmetry ) have zero Born effective charge (), whereas the antisymmetric Lamb modes (symmetry ) are characterized by a small effective charge (0.070–1.039), which indicates the appearance of polarization that accompanies vibrations. The appearance of the polarization is not related to the piezoelectric properties of CdSe since it cannot arise from the strain of the sample along the [001] direction. The polarization arises as a result of the displacement of atomic planes carrying a small ionic charge (the chemical bond in CdSe has a mixed covalent-ionic character). Because of the appearance of a long-range dipole-dipole interaction, the corresponding vibrational modes should be interpreted as optical rather than acoustic vibrations.222In Lamb’s original work, the waves in a thin plate were considered as purely acoustic waves in continuous media with zero-stress boundary conditions at the surfaces of the plate. In what follows we shall refer to them as quasi-Lamb modes. This feature of the Lamb waves can also be characteristic of nanoplatelets made of other dielectric materials.
In order to clarify the relationship between quasi-Lamb modes and normal modes in bulk CdSe, we performed the mode projection analysis by expanding the eigenvectors of the quasi-Lamb modes in an orthogonal basis of normal modes of bulk CdSe. This technique was first used for studying the vibrational spectra of CdSe quantum dots in Ref. Fu et al., 1999. In contrast to quantum dots, the vibrational spectra of CdSe nanoplatelets are described by good quantum numbers (, , indexes of the and Lamb modes), and so the component of wave vector is the only parameter which can be considered as an expansion parameter. The obtained results are presented in the Supplemental Material. Sup Due to the symmetry of nanoplatelets, the LA and LO() modes are the only modes which contribute to the and quasi-Lamb modes. The largest contribution to the low-order modes comes from LA phonons with , whereas the largest contribution to the high-order modes is from LO() phonons with . The largest contribution to the mode whose index is equal to the number of MLs in the nanoplatelet is provided by LO phonon of bulk CdSe (this mode has the highest value). The largest contribution to other modes are from the LA (low-order modes) or LO() (high-order modes) phonons with .
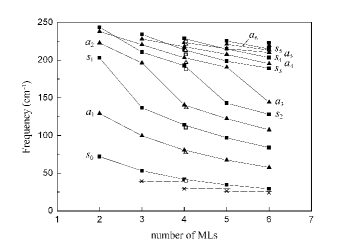
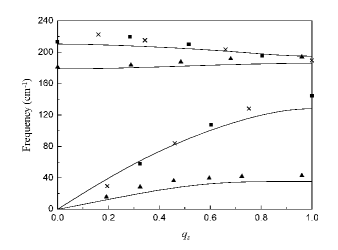
The frequencies of quasi-Lamb modes at the point as a function of the thickness of nanoplatelets are shown in Fig. 4. The figure does not include results for the flexural mode whose frequency is always zero at . It is seen that the frequencies of high-order quasi-Lamb modes are grouped near the frequency of LO phonon in bulk CdSe (210 cm-1 in our calculations). When increasing the nanoplatelet thickness, the lower-order modes “split off” from this group, and their frequencies rapidly decrease. According to the mode projection analysis, the largest contribution to the modes that are grouped around 210 cm-1 is made by LO phonons. The fact that the frequencies of these modes exceed the frequency of TO phonon in bulk CdSe (179 cm-1 in our calculations) indicates the existence of the dipole-dipole interaction in both and quasi-Lamb modes in the nanoplatelets. The replacement of the surface F atom by Cl results in a small (2–6 cm-1) lowering of the frequencies of all quasi-Lamb modes (Fig. 4).
The results shown in Fig. 4 can be used to determine the thickness of nanoplatelets. As the frequencies of quasi-Lamb modes depend on the mass of the surface atoms, and in the experimental nanoplatelets the surface atom is usually oxygen whose mass is close to that of fluorine, then Fig. 4 can be directly used to solve this problem. With this aim, we superimposed the experimental data from Ref. Girard et al., 2016 on our calculated curves. As in Ref. Girard et al., 2016, the observed vibration frequencies are somewhat lower than the calculated ones, but if one assumes that the nanoplatelet is actually by one monolayer thicker,333To identify nanoplatelets, it is convenient to use the wavelength of the first exciton peak in their absorption spectra. The authors of Ref. Girard et al., 2016 assumed the thickness to be 3 ML for nanoplatelets with nm, 4 ML for those with nm, and 5 ML for those with nm. the agreement becomes good. As for the model used in Ref. Girard et al., 2016, one should note that a model with an additional mass located on the surface of a nanoplatelet is not entirely adequate to the experiment since the thickness of the oleic acid layer on the surface of the nanoplatelet is comparable with the nanoplatelet thickness. Taking into account the difference between the sound velocities in CdSe and oleic acid, the model Nayfeh and Nagy (1997) of a plate covered with a medium whose acoustic wave impedance is substantially (about an order of magnitude) smaller than that of CdSe seems to be more adequate.
As was mentioned in Sec. I, one of the acoustic modes () in the vibrational spectra of thin plates is purely flexural, and for small its dispersion law is . Such a dispersion law can indeed be seen in the phonon spectra of nanoplatelets in Fig. 2 in the vicinity of the point.
All optical modes with the symmetry and in-plane atomic displacements are characterized by non-zero effective charge. When analyzing these modes, we see a large number of modes that are absent in bulk CdSe and appear in the phonon spectra of nanoplatelets in the frequency range 25–90 cm-1 (Fig. 2). In order to understand their origin, we performed the mode projection analysis of these modes (see the Supplemental Material Sup ). Due to the symmetry of nanoplatelets, the TA and TO phonons are the only modes which contribute to the modes. It turned out that in a nanoplatelet with a thickness of MLs, there are modes with a dominant contribution from TA phonons of bulk CdSe with , and the remaining modes have a dominant contribution from TO phonons.
The characteristic “doubling” of atomic displacements, which is observed for all acoustic-like modes on the left panel in Fig. 5, and the fact that the eigenvectors of these modes are directed along the [110] and [10] axes, support their relationship with TA phonons in bulk CdSe. Indeed, when the atoms in the (001) planes in the ZB structure are displaced along the indicated directions, two types of stresses of interatomic bonds arise in adjacent planes: one generating elongation and shortening of bonds and the other changing the angles between them without changing their lengths. Since the energy cost necessary to change the angles between the bonds is much less than that required to change their lengths, we immediately get a set of two strongly different local “shear moduli”. The “doubling” of atomic displacements is a consequence of this difference: atomic layers bound by stronger bonds experience smaller relative displacement. These pairs of atomic layers are bound with other pairs by much weaker bending bonds, which result in the low-frequency acoustic-like modes.
Next modes are the modes with frequencies in the range 181–194 cm-1. The mode projection analysis shows that only the lowest of these modes has a dominant contribution from TO phonon of bulk CdSe, whereas the modes with higher energies result from TO phonons with .
Finally, the last group of the modes (right panel in Fig. 5) can be interpreted as surface modes: the amplitude of atomic vibrations decays very rapidly when moving deep into the nanoplatelet. The maximum displacement is experienced by surface F atoms or atoms of the first monolayer. The mode projection analysis shows that they have a roughly equal contributions from all TO phonons in the whole Brillouin zone. Modes with frequencies of 107 and 335 cm-1, which have very similar displacement patterns, differ in frequency by more than three times. In the first of these modes, the displacements of F occur perpendicularly to their chemical bonds with Cd (the bending mode), whereas in the second of them the displacement of fluorine causes an elongation of one and shortening of the other of these bonds (the stretching mode). This explains the difference in their frequencies. The frequencies of these two modes significantly decrease (by 30–50%) when replacing F atoms by Cl atoms.
As concerns the mode with a frequency of 213 cm-1, we associate it with a so-called surface optical (SO) mode. According to the theory, Ruppin and Englman (1970) for a thin slab, the frequency of this mode should exactly coincide with the frequency of bulk TO phonon.444Surface modes with frequencies intermediate between those of TO and LO phonons can be observed only on curved surfaces: in quantum dots and quantum wires. Our calculations do indeed find such a surface mode (Fig. 5). In the nanoplatelet with a thickness of MLs, this mode always appears as the highest-energy optical mode whose eigenvector qualitatively differs from that of other optical modes. There are two reasons for the observed upward shift of the frequency of the SO mode as compared to that of TO phonon: (1) according to the mode projection analysis, TO phonons from the whole Brillouin zone contribute almost equally to this mode; (2) there is a large contribution from the terminating F atom into this mode (the replacement of F by Cl decreases the SO mode frequency by 13–15 cm-1). In contrast to quantum dots, Fu et al. (1999) in nanoplatelets the SO mode has not a mixed LO+TO character, but is a purely transverse mode.
We note that a similar picture with strong displacements of surface F atoms typical of surface modes can be seen for two highest-frequency quasi-Lamb modes (, ) in Fig. 3. In the mode projection analysis, these modes display a behavior that is different from the behavior of both F surface modes and other quasi-Lamb modes. On the other hand, the arguments against their surface character are: (1) the frequencies of these modes exhibit very little change (2–4 cm-1) upon replacing the terminating F atoms by Cl atoms and (2) a sufficiently high displacement amplitude is retained in the bulk of a nanoplatelet even for the thickest of them. Nevertheless, we tend to classify these modes as surface modes, whose displacements are strongly coupled with the LO-type displacements of atoms in the bulk of the nanoplatelet due to the long-range dipole-dipole interaction. This assumption let us propose the following simple picture that describes the phonon spectrum of all nanoplatelets.
The unit cell of a CdSe nanoplatelet with a thickness of MLs contains atoms and produces vibrational modes. Three of them, the flexural mode, one LA, and one TA phonons polarized in the plane are acoustic ones, the other modes are optical. The first modes are produced by CdSe monolayers. These are: symmetric quasi-Lamb modes (), antisymmetric modes (), and doubly degenerate optical modes, half of which are acoustic-like, and the other half are optic-like (the TO-like mode with the highest energy produces the so-called SO mode). The remaining six modes, two doubly-degenerate surface modes, , and modes, are associated with vibrations of two terminating F(Cl) atoms.
IV Interpretation of Raman and IR spectra
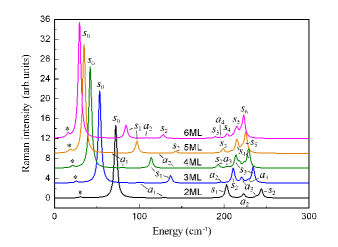
The Raman spectra of CdSe nanoplatelets in the back-scattering geometry calculated for non-resonant excitation conditions are shown in Fig. 6. In modeling the spectra, we intentionally used a small parameter of the Lorentz broadening for a fine structure in the spectra could be seen; in the experiment, these details can be less visible because of stronger damping of the vibrations. It is seen that the largest contribution to the spectra is provided by the fully symmetric quasi-Lamb modes and—to a much lesser degree—by the high-order modes , which are analogs of the LO modes. The relative contribution of the modes to the Raman scattering weakens as the nanoplatelet thickness increases. From the modes with the symmetry, a weak contribution to the Raman spectra is provided by the mode with the lowest frequency (asterisks in Fig. 6); the intensity of other modes (including LO() mode) is by 1–2 orders of magnitude smaller. In spite of a large spread in positions and intensities of individual lines near 210 cm-1, the center of gravity of these lines is a rather smooth function of the nanoplatelet thickness. It locates slightly above the LO phonon frequency in bulk CdSe and slowly decreases with increasing nanoplatelet thickness.555As follows from the calculation of Raman spectra in biaxially compressed bulk CdSe, this energy shift can be explained by the in-plane compression of the modeled nanoplatelets, which decreases with increasing nanoplatelet thickness. Vasiliev et al. (2017)
The difference in intensities of the and Raman lines results from the different symmetry of their corresponding Raman tensors,
Since the values are usually two times larger than the values and , the isotropic invariant produced by the first of these tensors results in much higher intensity of Raman lines than the symmetric anisotropic invariant produced by the second tensor (for details see the Supplemental Material Sup ).
The difference between the and modes is of fundamental character. Although both of these modes can be expanded in a series of normal modes of bulk CdSe, their properties are very different: only one of polar modes transforms to the bulk polar LO phonon when increasing nanoplatelet thickness. The modes, which can be considered as standing waves formed from two LO phonons with , can appear only in the restricted geometry. The main feature of the mode—it is non-polar and does not produce a long-range electric field—has no corresponding solution in bulk systems. So, the mode is a new type of vibration specific to quasi-two-dimensional structures. Breathing modes in quasi-0D systems and radial breathing modes in quasi-1D systems are other examples of such modes. Thus, our calculations do not confirm the commonly accepted interpretation of the main peak in Raman spectra of CdSe nanoplatelets as a manifestation of LO phonon.
The results of our calculations show that the explanation of the observed differences between non-resonant and resonant Raman spectra Cherevkov et al. (2013a, b) may be incorrect, too. In order for two lines of approximately equal amplitude to appear in the resonant Raman spectrum, the intensity of the mode should be increased by three orders of magnitude with respect to the intensity of the mode with close frequency, which seems unlikely. A more natural explanation is the change in the intensity of different modes, which form a fine structure in the spectra, under resonant conditions. An experimental confirmation of the existence of the fine structure in Raman spectra is its observation in CdSe/CdS nanoheterostructures upon changing the excitation energy. Dzhagan et al. (2016)
We now discuss the interpretation of weak features that are observed on the low-energy side of the main Raman peak and are explained by surface optical (SO) phonon. As was mentioned above, our calculations do indeed find such a surface mode (mode with a frequency of 213 cm-1 in Fig. 5). This mode should obviously be observed in the IR absorption spectra (see below), but according to our calculations, in the Raman spectra its intensity is three orders of magnitude smaller than the intensity of the nearest strong line. This means that the features which have been explained by SO phonon have a different origin. We believe that these features actually result from other lines in the fine structure of the calculated Raman spectra, first of all from the fully symmetric quasi-Lamb modes of lower order. The fine structure of SO mode revealed in Ref. Dzhagan et al., 2016 supports this interpretation. Obviously, the peaks attributed to the combination LO+SO in Ref. Dzhagan et al., 2016 should be interpreted as a second-order scattering on the combination of the modes.
Long-wavelength shifts of Raman lines observed in the NPOM geometry, Sigle et al. (2014) in our opinion, indicate the modes that, in finite-size systems, create an electric field outside the sample and therefore depend on the geometry of measurements and the dielectric constant of surrounding medium. Among the modes existing in CdSe nanoplatelets only the modes have such a property.
In order to verify the correctness of our reasoning, we calculated the mode frequencies in several nanoplatelets with the same positions of atoms, but with an increased thickness of the vacuum gap. It is obvious that the frequency of the modes, for which the electric field is non-zero outside the sample, should depend on the size of this gap because the electric field energy in the gap is proportional to its thickness. It turned out that upon an increase in the thickness of the vacuum gap by 6 Å for the 3 ML nanoplatelet, the frequencies of only two modes changed more than 0.01 cm-1: these were the modes—the mode (the frequency increment was 0.32 cm-1) and the mode (the frequency increment was 1.29 cm-1). These are the modes whose frequencies can change significantly when the environment of a nanoplatelet changes. For the 5 ML nanoplatelet, a noticeable increase in the frequency was also observed for two modes—the mode (the frequency increment was 1.17 cm-1) and the mode (the frequency increment was 0.51 cm-1) for the same increase in the thickness of the vacuum gap. Therefore, it is not surprising that when the gap in the NPOM geometry was reduced, a decrease in the frequency of the mode was observed. Sigle et al. (2014) The “plasmonic amplification” of the intensity of this mode in the NPOM geometry is the reason for the appearance of the second line in the Raman spectrum in addition to the line. Our interpretation of the observed changes in the spectra differs from that proposed in Ref. Sigle et al., 2014. In addition, the authors are not correct when considering the modes inactive in the standard Raman geometry.
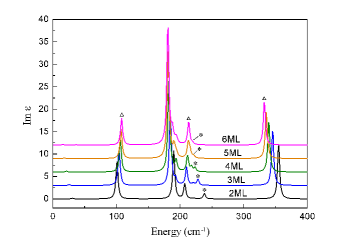
Calculations of the infrared absorption spectra (Fig. 7) show that the largest contribution to them is provided by the mode with the highest effective charge and the displacement pattern closest to that of TO phonon in bulk CdSe. As the thickness of the nanoplatelet increases, the frequency of this mode tends to the frequency of TO phonon in bulk CdSe. On the high-energy side of this peak one can see a structure resulting from the modes corresponding to TO phonons with . Three peaks of medium intensity (triangles in Fig. 7) are related to the surface modes whose eigenvectors are shown on the right panel in Fig. 5. The true SO mode, which was discussed above, can be clearly seen as a separate feature in the IR reflection spectra. Dzhagan et al. (2016) Finally, a very small contribution to the spectra is provided by the quasi-Lamb modes (asterisks in Fig. 7). Although the dipole moments arising from the latter vibrations are directed out-of-plane, we can observe them because nanoplatelets have a random orientation with respect to the direction of light propagation. In summary, we see that the IR spectra can provide important information on the TO-like modes and the surface vibrations in nanoplatelets.
Lastly, a comment about the phonon confinement model Arora et al. (2007) should be added. This model can indeed be regarded as a way for estimating the shifts of LO and TO phonon frequencies in Raman spectra of nanostructured materials. However, the phonon confinement model is usually concentrated on the analysis of only these modes, whereas in this paper we have revealed much more complex behavior resulting in the appearance of new vibrational modes which are missing in the phonon confinement model, but are observable in optical spectra. The frequencies of twenty-five Raman-active modes for the 6 ML CdSe nanoplatelet are compared with the phonon spectrum of bulk CdSe in Fig. 8. It is seen that the frequencies of these modes are qualitatively consistent with the frequencies of phonon modes of bulk CdSe taken at vectors which provide the largest contribution to the eigenvector of the corresponding mode. Nevertheless, in some cases the frequencies can differ by 10–15 cm-1, as for the highest-energy mode which corresponds to the strongest line in the Raman spectrum. We note that both the phonon dispersion curves and the mode frequencies presented in the figure were calculated using the same technique. The origin of this difference is that in our lattice dynamics calculations of nanoplatelets, we used relaxed structures and calculated the force constants from first principles individually for each atom, thus avoiding the question of how to define “the nanoplatelet thickness”. The difference between our approach and the phonon confinement model may be especially big when calculating Raman and IR spectra of nanoheterostructures, in which the thickness the the outer layer can be as small as 1 ML and where the phonon confinement model becomes inapplicable.
V Conclusions
The first-principles calculations of the lattice dynamics of CdSe nanoplatelets have shown that the Lamb modes in them are in fact optical, not acoustic vibrations. In the spectra of optical vibrations of nanoplatelets, there appears a large number of low-frequency modes inherited from TA phonons in bulk CdSe. Calculations of the Raman spectra show that the largest contribution to them is provided by the fully symmetric quasi-Lamb modes with the symmetry. Antisymmetric quasi-Lamb modes with the symmetry, whose frequencies depend on the environment of a nanoplatelet and whose properties are closest to the properties of LO phonons, enable to explain the results of Raman studies in the NPOM geometry. It is shown that weak lines in Raman spectra previously attributed to surface optical (SO) phonons should be interpreted as a manifestation of lower-order quasi-Lamb modes. Calculations of the infrared spectra find, in addition to the TO phonon line, the appearance of intense lines of surface modes originating from the atoms on the nanoplatelet surface and from true SO modes. The results obtained in this work can be used for a deeper understanding of the vibrational spectra of more complex nanoobjects—nanoheterostructures and quantum dots. In quantum dots, for example, the Raman lines may be associated with the breathing modes rather than LO phonons, because the most intensive lines in the spectra are usually the full-symmetry modes.
Acknowledgements.
The author is deeply grateful to R. B. Vasiliev for stimulating the author’s interest to nanoplatelets and fruitful discussions. This work was supported by the Russian Foundation for Basic Research (Grant No. 16-29-11694).References
- Lamb (1917) H. Lamb, Proc. Roy. Soc. London A 93, 114 (1917).
- Fuchs and Kliewer (1965) R. Fuchs and K. L. Kliewer, Phys. Rev. 140, A2076 (1965).
- Ruppin and Englman (1970) R. Ruppin and R. Englman, Rep. Progr. Phys. 33, 149 (1970).
- Ithurria and Dubertret (2008) S. Ithurria and B. Dubertret, J. Am. Chem. Soc. 130, 16504 (2008).
- Ithurria et al. (2011) S. Ithurria, M. D. Tessier, B. Mahler, R. P. S. M. Lobo, B. Dubertret, and A. L. Efros, Nat. Mater. 10, 936 (2011).
- Feldmann et al. (1987) J. Feldmann, G. Peter, E. O. Göbel, P. Dawson, K. Moore, C. Foxon, and R. J. Elliott, Phys. Rev. Lett. 59, 2337 (1987).
- Tessier et al. (2012) M. D. Tessier, C. Javaux, I. Maksimovic, V. Loriette, and B. Dubertret, ACS Nano 6, 6751 (2012).
- Tessier et al. (2013) M. D. Tessier, B. Mahler, B. Nadal, H. Heuclin, S. Pedetti, and B. Dubertret, Nano Lett. 13, 3321 (2013).
- Achtstein et al. (2015) A. W. Achtstein, A. Antanovich, A. Prudnikau, R. Scott, U. Woggon, and M. Artemyev, J. Phys. Chem. C 119, 20156 (2015).
- Chen et al. (2014) Z. Chen, B. Nadal, B. Mahler, H. Aubin, and B. Dubertret, Adv. Funct. Mater. 24, 295 (2014).
- Fan et al. (2015) F. Fan, P. Kanjanaboos, M. Saravanapavanantham, E. Beauregard, G. Ingram, E. Yassitepe, M. M. Adachi, O. Voznyy, A. K. Johnston, G. Walters, G.-H. Kim, Z.-H. Lu, and E. H. Sargent, Nano Lett. 15, 4611 (2015).
- Vitukhnovsky et al. (2015) A. G. Vitukhnovsky, V. S. Lebedev, A. S. Selyukov, A. A. Vashchenko, R. B. Vasiliev, and M. S. Sokolikova, Chem. Phys. Lett. 619, 185 (2015).
- Grim et al. (2014) J. Q. Grim, S. Christodoulou, F. Di Stasio, R. Krahne, R. Cingolani, L. Manna, and I. Moreels, Nat. Nanotech. 9, 891 (2014).
- She et al. (2014) C. She, I. Fedin, D. S. Dolzhnikov, A. Demortière, R. D. Schaller, M. Pelton, and D. V. Talapin, Nano Lett. 14, 2772 (2014).
- Li et al. (2015) M. Li, M. Zhi, H. Zhu, W.-Y. Wu, Q.-H. Xu, M. H. Jhon, and Y. Chan, Nat. Commun. 6, 8513 (2015).
- Lhuillier et al. (2015) E. Lhuillier, J.-F. Dayen, D. O. Thomas, A. Robin, B. Doudin, and B. Dubertret, Nano Lett. 15, 1736 (2015).
- Cherevkov et al. (2013a) S. A. Cherevkov, A. V. Baranov, A. V. Fedorov, A. P. Litvin, M. V. Artemyev, and A. V. Prudnikau, Proc. SPIE 8807, 88070A (2013a).
- Cherevkov et al. (2013b) S. A. Cherevkov, A. V. Fedorov, M. V. Artemyev, A. V. Prudnikau, and A. V. Baranov, Phys. Rev. B 88, 041303 (2013b).
- Sigle et al. (2014) D. O. Sigle, J. T. Hugall, S. Ithurria, B. Dubertret, and J. J. Baumberg, Phys. Rev. Lett. 113, 087402 (2014).
- Girard et al. (2016) A. Girard, L. Saviot, S. Pedetti, M. D. Tessier, J. Margueritat, H. Gehan, B. Mahler, B. Dubertret, and A. Mermet, Nanoscale 8, 13251 (2016).
- Dzhagan et al. (2016) V. Dzhagan, A. G. Milekhin, M. Y. Valakh, S. Pedetti, M. Tessier, B. Dubertret, and D. R. T. Zahn, Nanoscale 8, 17204 (2016).
- Vasiliev et al. (2017) R. B. Vasiliev, A. I. Lebedev, E. P. Lazareva, N. N. Shlenskaya, V. B. Zaytsev, A. G. Vitukhnovsky, Y. Yao, and K. Sakoda, Phys. Rev. B 95, 165414 (2017).
- Gonze and Lee (1997) X. Gonze and C. Lee, Phys. Rev. B 55, 10355 (1997).
- Veithen et al. (2005) M. Veithen, X. Gonze, and P. Ghosez, Phys. Rev. B 71, 125107 (2005).
- Prosandeev et al. (2005) S. A. Prosandeev, U. Waghmare, I. Levin, and J. Maslar, Phys. Rev. B 71, 214307 (2005).
- Note (1) To denote symmetric and antisymmetric Lamb modes, we use the notations and , where indicates the order of the mode. The displacements of the atoms in these modes resemble the cosine function, with the wave periods for symmetric modes, and full periods for antisymmetric modes.
- Note (2) In Lamb’s original work, the waves in a thin plate were considered as purely acoustic waves in continuous media with zero-stress boundary conditions at the surfaces of the plate.
- Fu et al. (1999) H. Fu, V. Ozoliņš, and A. Zunger, Phys. Rev. B 59, 2881 (1999).
- (29) See Supplemental Material at http://link.aps.org/supplemental/10.1103/PhysRevB.96.184306 for details and results of mode projection analysis and explanation of Raman lines intensity calculations.
- Note (3) To identify nanoplatelets, it is convenient to use the wavelength of the first exciton peak in their absorption spectra. The authors of Ref. \rev@citealpnumNanoscale.8.13251 assumed the thickness to be 3 ML for nanoplatelets with nm, 4 ML for those with nm, and 5 ML for those with nm.
- Nayfeh and Nagy (1997) A. H. Nayfeh and P. B. Nagy, J. Acoust. Soc. Am. 101, 2649 (1997).
- Note (4) Surface modes with frequencies intermediate between those of TO and LO phonons can be observed only on curved surfaces: in quantum dots and quantum wires.
- Note (5) As follows from the calculation of Raman spectra in biaxially compressed bulk CdSe, this energy shift can be explained by the in-plane compression of the modeled nanoplatelets, which decreases with increasing nanoplatelet thickness. Vasiliev et al. (2017).
- Arora et al. (2007) A. K. Arora, M. Rajalakshmi, T. R. Ravindran, and V. Sivasubramanian, J. Raman Spectrosc. 38, 604 (2007).