Ionized Gas Kinematics around an Ultra-luminous X-ray Source in NGC 5252 : Additional Evidence for an Off-nuclear AGN
Abstract
The Seyfert 2 galaxy NGC 5252 contains a recently identified ultra-luminous X-ray (ULX) source that has been suggested to be a possible candidate off-nuclear low-mass active galactic nucleus. We present follow-up optical integral-field unit observations obtained using GMOS on the Gemini-North telescope. In addition to confirming that the ionized gas in the vicinity of the ULX is kinematically associated with NGC 5252, the new observations reveal ordered motions consistent with rotation around the ULX. The close coincidence of the excitation source of the line-emitting gas with the position of the ULX further suggests that ULX itself is directly responsible for the ionization of the gas. The spatially resolved measurements of [N II] 6584/H surrounding the ULX indicate a low gas-phase metallicity, consistent with those of other known low-mass active galaxies but not that of its more massive host galaxy. These findings strengthen the proposition that the ULX is not a background source, but rather that it is the nucleus of a small, low-mass galaxy accreted by NGC 5252.
Subject headings:
galaxies: active — galaxies: individual (NGC 5252) — galaxies: Seyfert — X-rays: ULX — black hole physics1. Introduction
Most massive galaxies harbor central supermassive black holes (BHs) with . BHs with have even been discovered in high redshift () quasars (e.g., Mortlock et al. 2011; Jun et al. 2015; Wu et al. 2015). This finding suggests that the seeds of supermassive BHs were probably not ordinary stellar-mass BHs ( ). Instead, theoretical studies suggest that more likely candidates for quasar seeds may be intermediate-mass BHs (IMBHs; ), which grow into supermassive BHs through rapid accretion and cosmological merging (Volonteri et al. 2003). Despite their importance, IMBHs are surprisingly rare in present-day galaxies (e.g., Greene & Ho 2004). Thus, the systematic study of the demography of IMBHs is crucial to understand the link between stellar-mass BHs and supermassive BHs (Volonteri 2010).
In this regard, ultraluminous X-ray sources (ULXs) are intriguing because some ULXs may contain IMBHs. ULXs are defined as bright, off-nuclear point sources with X-ray luminosities erg s-1. Because their X-ray luminosities substantially exceed the Eddington luminosity of stellar-mass BHs, and they are off-nuclear, the X-rays are thought to originate from IMBHs (Colbert & Mushotzky 1999). However, due to the fact that the optical counterparts of ULXs are usually unknown or very faint, little is known about the true nature of ULXs (e.g., Roberts et al. 2008; Gladstone et al. 2013).
Kim et al. (2015) newly discovered a candidate IMBH associated with a ULX. This ULX is seen at a projected separation of 22′′ ( kpc) from the nucleus of the type 2 Seyfert S0 galaxy NGC 5252. Its X-ray luminosity of erg s-1 exceeds the upper limit of stellar-mass BHs (e.g., high-mass X-ray binaries; Swartz et al. 2011). A longslit optical spectrum of the ULX obtained with the Magellan/Baade 6.5 meter telescope reveals strong emission lines with relatively small systematic velocity offset ( km s-1) with respect to the nucleus of the galaxy. In conjunction with multiwavelength spectral energy distribution from X-ray to radio energies, Kim et et al. suggest that the ULX in NGC 5252 can be explained by an IMBH with . While the BH mass estimate is highly uncertain, this object constitutes one of the unique examples of an “off-nucleus” active galactic nucleus (AGN) with an IMBH.
This paper presents an optical integral-field spectrum of the ULX to further explore the nature of the ULX in NGC 5252. We find that the ionized gas surrounding the ULX is not only associated with NGC 5252, but that its velocity field exhibits signs of rotation centered on the ULX. If the gas velocities arise from virial motions, the ULX is plausibly associated with a nuclear BH of an accreted dwarf galaxy.
Adopting the cosmological parameters km s-1 Mpc-1, , and (Planck Collaboration et al. 2016), the luminosity distance of NGC 5252 is 103 Mpc.
2. Observations and Data Reduction
We obtained integral-field unit spectra using the Gemini Multi-Object Spectrographs (GMOS) on the Gemini-north telescope on 2015 March 18. The data were taken with an R600 grating using a one-slit mode to cover H and H simultaneously, resulting in a field-of-view of 5035 sampled by 500 elements. The spectrum covers 4900–7700 Å with a FWHM spectral resolution of 3700, as determined from the widths of the sky emission lines. The total on-source integration time was 3.75 hours. The sky conditions were clear, and the seeing inferred from the guide camera was between 01 and 03.
We reduced the data using the Gemini package in IRAF. The flat-fielding was done using a twilight flat and flats taken with quartz halogen lamps, and wavelength calibration was performed using CuAr arc images. We used the sky images taken from a blank region located 1′ away from the science object for sky subtraction. We extracted the spectra in 01 spatial elements and combined the spectra for each element. Finally, flux calibration was done using B9.6V star HR 5501 observed during the same night.
Although the signal-to-noise ratio () of the continuum in each spaxel is on average, strong emission lines (e.g., [O III]5007 and H) are detected with in the majority of the spaxels (Fig. 1). To investigate the properties of various emission lines (e.g., line width, flux, central wavelength), we fit the strong emission lines with a single Gaussian component. If the of the line is less than 3, we set upper limits based on 3 times the RMS noise in the associated continuum and using the line width measured from detected emission lines (H or [O III]).
3. Spectral Properties
3.1. Rotational Feature
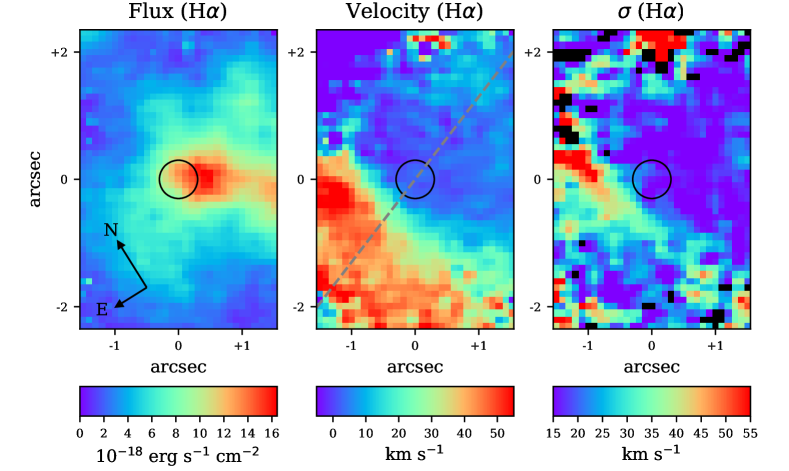
Figure 1 presents distributions of line flux, velocity measured from the peak of the H emission line, and its associated velocity dispersion (), corrected for instrumental resolution. The distribution of H flux clearly shows that the ULX is coincident with the ionized gas (Kim et al. 2015). While the structure of the ionized gas appears to be somewhat asymmetric relative to the ULX, the X-ray position111The uncertainty of the position is . of the ULX agrees well with one of the peak positions of the H flux (see also Fig. 4 in Kim et al. 2015). Note that the kinematical and morphological distributions of [O III] emission are very similar to those of H.
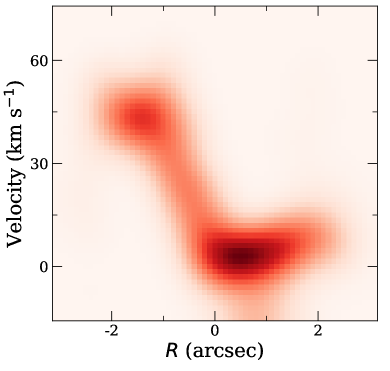
More interstingly, the spatial distribution of the peak velocity of H exhibits rotational motion. This is more clearly seen in the position-velocity diagram along the axis denoted by the dashed line in Figure 1 (§4). One can argue that shocks may be responsible for the velocity gradient. If this were the case, the velocity dispersion should increase substantially at the shock front. Although, the distribution of (H) shows a very mild increase near the position of the velocity gradient, such a pattern is not present in [O III], which should be even more sensitive to shocks than H (Fig. 2). In addition, if shocks contribute to the ionization, we expect relatively low values of [O III]/H () and [N II]/H () compared to AGNs, and relatively high velocity dispersions (often larger than 100 km s-1; Ho et al. 2014). In our case, however, [O III]/H tends to be greater than 3 and the velocity dispersions of H are less than 55 km s-1 (Figs. 1 and 2). Thus, shocks seem unlikely to be important. And while [O III] can effectively trace outflows, the lakc of excess velocity dispersion in the vicinity of the ULX suggests that outflows are not significant.
It is worth noting that the center of rotation is offset by 05 ( pc) with respect to position of the ULX. This indicates that either the surrounding gas might be gravitationally unbound to the ULX or the gas was decoupled from the nucleus, possibly during the merger, if the ULX was associated with a merging galaxy (see §4). The spatial distribution of H shows that the ionized gas extends up to 3′′ in diameter ( kpc) and is highly disturbed.
3.2. Source of the Ionization
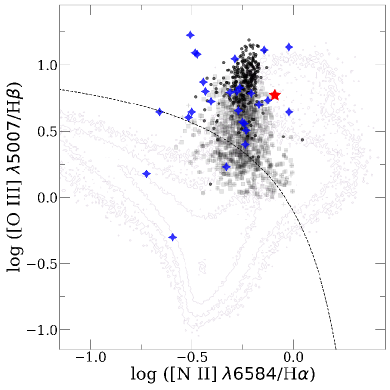
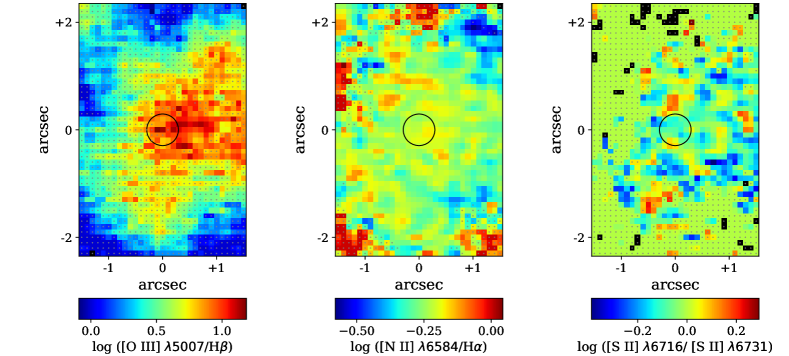
The [O III] /H versus [N II] /H diagnostic diagram (Baldwin et al. 1981) clearly shows that the gas ionization is mostly dominated by an AGN rather than by star formation (Fig. 2). [O III]/H reaches a maximum at the position of the ULX (Fig. 3). This flux ratio increases mainly with increasing ionization parameter, metallicity, or electron density (e.g., Ferland & Netzer 1983). However, [S II] 6716/[S II] 6731 shows no evidence of a rise in electron density in the vicinity of the ULX, nor is there any sign for a higher metallicity from [N II] /H (e.g., Storchi Bergmann & Pastoriza 1989). Altogether, it appears that the elevated [O III]/H associated with the ULX arises from an increase in ionization parameter, and hence that the ULX itself is the main source of ionization.
4. The Physical Association of the ULX with NGC 5252
In view of the complexity of the gas distribution in the host galaxy NGC 5252 (Prieto & Freudling 1996), we cannot completely rule out the possibility that the ULX is a background AGN interloper. Kim et al. (2015) argued against this interpretation due to the lack of emission lines that should be associated with such a background source, a result reaffirmed in the current set of GMOS observations. They also rejected the possibility that the source is a background BL Lac object (a class of AGNs with very weak or no emission lines) based on the broad-band spectral energy distribution of the source and the absence of X-ray and radio variability.
The observations presented here further strengthen the proposal that the ULX resides within NGC 5252. First, the position-velocity diagram indicates that the ionized gas projected toward the immediate vicinity of the ULX shows systematic motions plausibly indicative of rotation. The rotational velocity reaches a maximum of km s-1, but it is offset by (230 pc; Fig. 4) from the position of the ULX. With an assumed inclination angle of 45∘, the dynamical mass is . Although this mass resembles that of the most massive giant molecular clouds, its relatively large size and rotation-dominated kinematics place it apart from typical giant molecular clouds (e.g., Hughes et al. 2010). Instead, the velocity gradient more closely resembles that of the circumnuclear region of a dwarf galaxy (e.g., Oh et al. 2015).
Furthermore, as discussed in §3, the excitation source for the line emission seems to coincide closely with the position of the ULX, strongly suggesting that the source of ionization for the gas is the ULX itself. This causally ties the ULX to the gas physically residing within NGC 5252. Moreover, can be regarded as a strict upper limit on the mass of the ULX. This value of falls within the (admittedly poorly constrained) range of previously estimated by Kim et al. (2015) based on the [O III] luminosity and the so-called BH fundamental plane (e.g., Merloni et al. 2003). Taken at face value, the upper limit on indicates that this ULX can still be regarded as a possible candidate for an IMBH, although it depends on the (unknown) inclination angle.
Nevertheless, we must exercise caution in interpreting the gas kinematics, since the velocity structure surrounding the ULX might be associated with the circumnuclear region of a merging dwarf galaxy. The positional offset of the ULX with respect to the center of rotation may be a manifestation of tidal distortion during the infall of the progenitor galaxy. If so, the true BH mass associated with the ULX may be much smaller than . An even more extreme possibility is that, even if the ULX does reside within NGC 5252, it may just be passing by coincidentally and ionizing the gas in the cloud (Krolik 2004). In this case, the gas kinematics give no constraints on the mass of the ULX. However, we note that the positional uncertainty of the Chandra data can be as large as 07 (90 percent confidence) calculated from the direct comparison between Chandra X-ray positions and those of optical counterparts222http://cxc.cfa.harvard.edu/cal/ASPECT/celmon/. Thus, it is possible that the apparent positional offset is not significant.
If the ULX and its surrounding nebula indeed originate from the accretion of a dwarf galaxy by NGC 5252, then we expect the metallicity of the gas to be rather low, reflecting its origin in the low-mass progenitor (Tremonti et al. 2004). The gas-phase metallicity can be estimated from the line-intensity ratio [N II]/H (e.g., Pettini & Pagel 2004; Groves et al. 2006). Consistent with this expectation, Figure 2 illustrates that the ionized gas around the ULX has significantly lower [N II]/H than the main body of the more massive host galaxy NGC 5252. The spatially resolved emission surrounding the ULX overlaps with the locus of low-mass active galaxies having (Greene & Ho 2007; Ludwig et al. 2012). This result strongly supports our hypothesis that a merging dwarf galaxy delivered the ULX to NGC 5252, and, indirectly, that the BH associated with the ULX has a low BH mass.
and Space Science Institute (KASI). LCH was supported by the National Key Program for Science and Technology Research and Development (2016YFA0400702) and the National Science Foundation of China (11473002). MI was supported by NRF grant No. 2017R1A3A3001362, funded by the Korea government (MSIP).
References
- Baldwin et al. (1981) Baldwin, J. A., Phillips, M. M., & Terlevich, R. 1981, PASP, 93, 5
- Colbert & Mushotzky (1999) Colbert, E. J. M., & Mushotzky, R. F. 1999, ApJ, 519, 89
- Ferland & Netzer (1983) Ferland, G. J., & Netzer, H. 1983, ApJ, 264, 105
- Gladstone et al. (2013) Gladstone, J. C., Copperwheat, C., Heinke, C. O., et al. 2013, ApJS, 206, 14
- Greene & Ho (2004) Greene, J. E., & Ho, L. C. 2004, ApJ, 610, 722
- Greene & Ho (2007) —. 2007, ApJ, 670, 92
- Groves et al. (2006) Groves, B. A., Heckman, T. M., & Kauffmann, G. 2006, MNRAS, 371, 1559
- Hughes et al. (2010) Hughes, A., Wong, T., Ott, J., et al. 2010, MNRAS, 406, 2065
- Jun et al. (2015) Jun, H. D., Im, M., Lee, H. M., et al. 2015, ApJ, 806, 109
- Kauffmann et al. (2003) Kauffmann, G., Heckman, T. M., Tremonti, C., et al. 2003, MNRAS, 346, 1055
- Kewley et al. (2001) Kewley, L. J., Dopita, M. A., Sutherland, R. S., Heisler, C. A., & Trevena, J. 2001, ApJ, 556, 121
- Kim et al. (2015) Kim, M., Ho, L. C., Wang, J., et al. 2015, ApJ, 814, 8
- Krolik (2004) Krolik, J. H. 2004, ApJ, 615, 383
- Ludwig et al. (2012) Ludwig, R. R., Greene, J. E., Barth, A. J., & Ho, L. C. 2012, ApJ, 756, 51
- Merloni et al. (2003) Merloni, A., Heinz, S., & Di Matteo, T. 2003, MNRAS, 345, 1057
- Mortlock et al. (2011) Mortlock, D. J., Warren, S. J., Venemans, B. P., et al. 2011, Nature, 474, 616
- Oh et al. (2015) Oh, S.-H., Hunter, D. A., Brinks, E., et al. 2015, AJ, 149, 180
- Pettini & Pagel (2004) Pettini, M., & Pagel, B. E. J. 2004, MNRAS, 348, L59
- Planck Collaboration et al. (2016) Planck Collaboration, Ade, P. A. R., Aghanim, N., et al. 2016, A&A, 594, A13
- Prieto & Freudling (1996) Prieto, M. A., & Freudling, W. 1996, MNRAS, 279, 63
- Roberts et al. (2008) Roberts, T. P., Levan, A. J., & Goad, M. R. 2008, MNRAS, 387, 73
- Storchi Bergmann & Pastoriza (1989) Storchi Bergmann, T., & Pastoriza, M. G. 1989, ApJ, 347, 195
- Swartz et al. (2011) Swartz, D. A., Soria, R., Tennant, A. F., & Yukita, M. 2011, ApJ, 741, 49
- Tremonti et al. (2004) Tremonti, C. A., Heckman, T. M., Kauffmann, G., et al. 2004, ApJ, 613, 898
- Volonteri (2010) Volonteri, M. 2010, A&A Rev., 18, 279
- Volonteri et al. (2003) Volonteri, M., Haardt, F., & Madau, P. 2003, ApJ, 582, 559
- Wu et al. (2015) Wu, X.-B., Wang, F., Fan, X., et al. 2015, Nature, 518, 512