JVLA 1.5GHz continuum observation of CLASH clusters I:
radio properties of the BCGs
Abstract
We present high-resolution (), 1.5 GHz continuum observations of the brightest cluster galaxies (BCGs) of 13 CLASH (Cluster Lensing And Supernova survey with Hubble) clusters at with the Karl G. Jansky Very Large Array (JVLA). Radio emission is clearly detected and characterized for 11 BCGs, while for two of them we obtain only upper limits to their radio flux ( mJy at 5 confidence level). We also consider five additional clusters whose BCG is detected in FIRST or NVSS. We find radio powers in the range from to and radio spectral indices (defined as the slope between 1.5 and 30 GHz) distributed from to around the central value . The radio emission from the BCGs is resolved in three cases (Abell 383, MACS J1931, and RX J2129), and unresolved or marginally resolved in the remaining eight cases observed with JVLA. In all the cases the BCGs are consistent with being powered by active galactic nuclei (AGN). The radio power shows a positive correlation with the BCG star formation rate, and a negative correlation with the central entropy of the surrounding intracluster medium (ICM) except in two cases (MACS J1206 and CL J1226). Finally, over the restricted range in radio power sampled by the CLASH BCGs, we observe a significant scatter between the radio power and the average mechanical power stored in the ICM cavities.
Subject headings:
radio continuum: galaxies; galaxies: clusters: intracluster medium; X-rays: galaxies: clusters1. Introduction
Brightest cluster galaxies (BCGs) are among the most massive galaxies in the universe, and their formation and evolution are intimately linked to the evolution of the host cluster (see Lauer et al., 2014; Hogan et al., 2015a, for a recent overview of properties of local BCGs). They usually live in the most active central cluster regions, show a small peculiar velocity with respect to other cluster members, and are often surrounded by a cool core. However, in a few cases, significant offset from the X-ray center and relatively large peculiar velocity may be observed (see Lauer et al., 2014). Their star formation history and nuclear activity are reflected in the chemical and thermodynamic properties of the X-ray emitting intracluster medium (ICM). In relaxed clusters, where the BCG is close to the X-ray center, the ICM is heavily affected by the feedback from the central active galactic nucleus (AGN), which prevents runaway cooling of the ICM and provides a direct explanation for the cooling-flow problem (Fabian, 1994, 2012). The signature of such feedback can be investigated in the X-ray band in terms of gas entropy structure, radio plasma-filled cavities in the ICM, and distribution of heavy elements in the ICM. Despite the sense that physical mechanisms contributing to the feedback are now well established, the detailed physics of the energy balance between the different baryonic components (stars, hot gas, and cold gas) and the regulation of nuclear activity and its duty cycle in the BCG are still under investigation.
In fact, the largest contribution to the feedback in terms of energy budget is associated with the ”mechanical-mode” nuclear activity, which consists in the production of extremely energetic radio jets or AGN outflows and winds created during accretion onto the supermassive black hole hosted by the BCGs. The accretion mechanism and the AGN feeding in massive halos have been modeled recently by several studies (see Gaspari et al., 2012, 2013; Voit et al., 2015). In addition, radiative cooling appears to be efficiently quenched by AGN activity in cool cores (e.g. Mittal et al., 2009). Mechanical-mode feedback from supermassive black holes is invoked to explain the quenching of the potential massive cooling flow and the non-detection of cold gas below keV in the cluster cores, despite the inferred cooling time being much shorter than the cluster lifetime in a subset of cluster cores (Peterson & Fabian, 2006). Star formation is also observed to be quenched or significantly suppressed, although with a significant time delay (e.g. Molendi et al., 2016). This picture is reinforced by the large fraction of radio-luminous galaxies among BCGs, which has been well established for many years (Burns, 1990), and by the fact that virtually every strong cool core cluster hosts a radio-loud BCG (Sun, 2009; Hogan et al., 2015a). It is found that BCGs are 10 times more likely to host an AGN than any other cluster galaxy, and about 3 times more likely than other cluster galaxies with comparable K-band luminosity (Lin & Mohr, 2007).
In more detail, the relativistic jets and/or outflows inject mechanical energy into the ICM, creating buoyantly rising bubbles or cavities filled by radio lobes (e.g. McNamara et al., 2000; Hlavacek-Larrondo et al., 2012). A significant fraction of this mechanical energy is expected to be transformed into internal energy of the ICM in the form of shock heating, turbulent motions, dissipation of sound waves, and turbulent mixing (e.g. Lau et al., 2017). The total mechanical energy associated with the cavities can be roughly estimated as the enthalpy where and are the ICM pressure and the cavity volume, respectively, and it appears to be of the same order as that needed to stop the cooling (see also Blanton et al., 2001; Bîrzan et al., 2004; Dunn & Fabian, 2006; Wise et al., 2007; Sanders & Fabian, 2007; Sanders et al., 2009). These studies have been possible thanks to the unambiguous detection of cavities in the ICM observed as round-shaped depressions in the X-ray emission, spatially overlapping with AGN lobes. The energetics of the mechanical feedback have been systematically investigated at low and medium redshifts (Jetha et al., 2007; Bîrzan et al., 2008; Dunn & Fabian, 2008; Blanton et al., 2010; Dunn et al., 2010; O’Sullivan et al., 2011; Hlavacek-Larrondo et al., 2012; Shin et al., 2016) and pushed to the limits of detectability of X-ray cavities up to thanks to the Chandra follow-up of a sample of SZ-selected clusters (Hlavacek-Larrondo et al., 2015). Cool cores are expected to be present from an early epoch (see Santos et al., 2010; McDonald et al., 2017) and a gentle feedback should be in place since then. However, while the average mechanical energy associated with feedback is sufficient to offset cooling, the process is expected to be intermittent. For example, the multiphase condensation and rain toward the central AGN as envisaged in the chaotic cold accretion scenario (see Gaspari et al., 2017) predicts a flicker noise variability with a logarithmic slope of the power spectrum of , characteristic of fractal and chaotic phenomena. The mechanical mode of AGN feedback is expected to be tightly self-regulated in most - if not all - BCGs, with frequent but not destructive outbursts, which appear to have a duty cycle close to unity (Mittal et al., 2009; Hogan et al., 2015a; Lau et al., 2017). In this picture, feedback can probably always be tracked by radio emission, but the detailed mechanism that is responsible for the transfer of the mechanical energy to the ICM is still not fully understood, and the evolution of the feedback with cosmic time is poorly constrained. Both aspects are of paramount importance in the framework of galaxy formation and evolution of the large scale structures of the universe.
In this respect, in-depth studies of BCGs and their complex environment using vastly different wavelengths are crucial to reach a comprehensive picture of the feedback phenomena. A unique opportunity for studying BCG properties and their evolution is provided by the Cluster Lensing And Supernovae survey with Hubble (CLASH Postman et al., 2012). CLASH is a Hubble Space Telescope (HST) 524-orbit Multi-Cycle Treasury program to use the gravitational lensing properties of 25 galaxy clusters to accurately constrain the baryonic mass and dark matter distributions in the cluster core and in the outskirts, to exploit their lensing properties to find highly magnified high-z galaxies, and to search for Type Ia supernovae at to improve constraints on the time dependence of the dark energy equation of state and the evolution of supernovae. A total of 16 broadband filters, spanning the near-UV to near-IR, are employed for a 20-orbit campaign on each cluster. In addition, CLASH clusters are observed in the X-ray band with Chandra and XMM-Newton. In particular, all the CLASH clusters have Chandra imaging with medium-deep exposures (from 20 to 130 ks, with an average of 60 ks). We already know that X–ray Chandra data of CLASH clusters often show structures in the inner 30 kpc, which corresponds to 10 arcsec at and to 5 arcsec at . The detection of X-ray cavities has already been reported in the literature for some of them individually: RXJ1532 by Dunn & Fabian (2008), MACSJ1931 by Ehlert et al. (2011), and MACSJ1423 by Bîrzan et al. (2008). A recent systematic investigation by Shin et al. (2016) reported cavity detection from beta-model subtracted images for seven CLASH clusters (MACSJ1720, Abell 383, MACSJ0329, MACSJ0744 in addition to those already mentioned). All the clusters are also observed in the mid-infrared (MIR) with Herschel, in the near-infrared (NIR) with Spitzer, and in the optical with Subaru/Superime-Cam, and are also intensively followed-up in the optical band to obtain detailed spectra and securely confirm member galaxies thanks to a VLT large program (PI P. Rosati) in addition to spectroscopy on 5 northern clusters with the Large Binocular Telescope. CLASH is the first large and representative sample of X-ray-selected clusters consistently observed with HST in 16 optical and NIR bands, and therefore stands out as one of the most ambitious observational projects on galaxy clusters ever attempted, with a strong legacy value. Similar efforts are currently underway with the HST follow-up of 41 massive clusters X-ray-selected from the RELICS survey (PI D. Coe) and of a similar number of X-ray selected clusters from the MACS survey (the SNAPshot survey, Repp & Ebeling, 2017).
Given the unprecedented combination of space- and ground-based data of the CLASH project, radio observations are a key ingredient toward a comprehensive investigation of the feedback processes. In this paper, we present the first part of an observational campaign in the 1-2 GHz radio continuum with the Karl G. Jansky Very Large Array (JVLA). Our goal is to characterize the radio properties of member galaxies in CLASH clusters, with a strong emphasis on the radio properties of the BCG and the connection with the surrounding ICM, to pave the way for a detailed investigation of the feedback processes in massive clusters. The paper is organized as follows. In Section 2 we describe the sample. In Section 3 we describe the observations and the data reduction. We present our results in Section 4, and our conclusions are summarized in Section 5. Throughout this paper we adopt the 7 yr WMAP cosmology, with = 0.272, = 0.728 and = 70.4 km (Komatsu et al., 2011). Quoted error bars always correspond to the 1 confidence level.
2. Sample selection
The sample of CLASH clusters, originally selected on the basis of their large mass and magnification power of gravitational lensing, populate the intermediate redshift range , corresponding to a look-back time interval of 2.4-5.7 Gyr, a period that has been poorly investigated so far. This is also the epoch when most of the effects of the feedback are visible in terms of evolution of the cluster X-ray luminosity-temperature relation of the cluster (Branchesi et al., 2007).
Among the 25 clusters of the CLASH sample, only 20 clusters appear dynamically relaxed. The other 5 CLASH clusters are, in fact, dynamically disturbed, and were selected because of their higher lensing magnification factor. Therefore, they do not show well defined cluster cores centered on a dominant BCG. A deep JVLA observation of the merging cluster MACSJ0717 is presented in van Weeren et al. (2017). In this work we focus on the 20 relaxed CLASH clusters that have a well-defined dominant BCG coincident with or very close to the peak of the X-ray cluster emission. Since our primary science goal is to investigate the relation between the BCG and core properties in massive clusters, we postpone the observation of merging clusters. All the 20 relaxed CLASH clusters are observable from the VLA except one (RXJ2248). Also, the cluster CLJ1226, with the highest redshift , was not in our accepted VLA sample because of a conflict with another program. Therefore, we proposed to observe 18 clusters in L band (20 cm) and A configuration (JVLA proposal VLA-14A-040, AT441, PI P. Tozzi) with the aim of reaching a noise level of mJy/beam. Therefore, assuming a nominal detection threshold corresponding to a , we aim at fluxes fainter and times deeper than the NRAO VLA Sky Survey (NVSS 111NVSS is complete above mJy at 1.5 GHz for (see http://www.cv.nrao.edu/nvss/)., Condon et al., 1998) and than the Faint Images of the Radio Sky at Twenty-cm (FIRST222The FIRST catalog released in 2014 December covers about 10,575 square degrees of sky both in the northern and southern hemispheres, with a detection threshold of mJy at 1.5 GHz (see http://sundog.stsci.edu/). Helfand et al., 2015) for point-like sources, respectively. The requirement to achieve this sensitivity corresponds roughly to an observation time of about minutes per field with the JVLA, including overheads. We choose the A configuration to achieve the maximum angular resolution of arcsec in the L band.
| Name | R.A. | Decl. | z | Optical | NVSS match | FIRST match |
| Abell 383 | 02:48:03.36 | -03:31:44.7 | 0.18871 | 6dF J0248034-033145 | J024803-033143 | J024803.3-033144 |
| Abell 209 | 01:31:52.57 | -13:36:38.8 | 0.20982 | 2MASX J01315250-1336409 | J013152-133659 | no coverage |
| Abell 1423 | 11:57:17.35 | +33:36:39.6 | 0.21403 | 2MASX J11571737+3336399 | J115716+333644 | J115716.8+333629 |
| RXJ2129 | 21:29:39.94 | +00:05:18.8 | 0.23393 | WISE J212939.98+000521.9 | J212940+000522 | J212939.9+000521 |
| Abell 611 | 08:00:56.83 | +36:03:24.1 | 0.28734 | 2MASX J08005684+3603234 | no detection | no detection |
| MS2137 | 21:40:15.18 | -23:39:40.7 | 0.31305 | 2MASX J21401517-2339398 | J214014-233939 | no coverage |
| RXJ1532 | 15:32:53.78 | +30:20:58.7 | 0.36206 | SDSS J153253.78+302059.3 | J153253+302059 | J153253.7+302059 |
| MACSJ1931 | 19:31:49.66 | -26:34:34.0 | 0.35210 | WISE J193149.63-263433.0 | no detection | no coverage |
| MACSJ1720 | 17:20:16.95 | +35:36:23.6 | 0.3877 | WISE J172016.75+353626.1 | J172016+353628 | J172016.7+353625 |
| MACSJ0429 | 04:29:36.10 | -02:53:08.0 | 0.39911 | 2MASX J04293604-0253073 | J042936-025306 | no coverage |
| MACSJ0329 | 03:29:41.68 | -02:11:47.7 | 0.45011 | WISE J032941.57-021146.6 | J032941-021152 | no coverage |
| MACSJ1423 | 14:23:47.76 | +24:04:40.5 | 0.54576 | SDSS J142347.87+240442.4 | J142347+240439 | J142347.9+240442 |
| MACSJ0744 | 07:44:52.80 | +39:27:24.4 | 0.69866,7 | SDSS J074452.81+392726.7 | no detection | no detection |
| Abell 2261 | 17:22:27.25 | +32:07:58.6 | 0.22293 | SDSS J172227.18+320757.2 | J172227+320757 | J172227.0+320758 |
| RXJ2248 | 22:48:44.29 | -44:31:48.4 | 0.347112 | WISE J224844.05-443150.7 | no coverage | no coverage |
| MACSJ1115 | 11:15:52.05 | +01:29:56.6 | 0.35206 | SDSS J111551.90+012955.0 | J111551+012955 | J111551.8+012955 |
| MACSJ1206 | 12:06:12.28 | -08:48:02.4 | 0.43989 | WISE J120612.16-084803.1 | J120612–084802 | no coverage |
| RXJ1347 | 13:47:30.59 | -11:45:10.1 | 0.449512 | WISE J134730.61-114509.5 | J134730–114508 | no coverage |
| MACSJ1311 | 13:11:01.67 | -03:10:39.5 | 0.49176 | SDSS J131101.79-031039.7 | no detection | no detection |
| ClJ1226 | 12:26:58.37 | +33:32:47.4 | 0.89088 | SDSS J122658.24+333248.5 | J122658+333244 | J122658.1+333248 |
In 2014 we obtained data for only 14 out of 18 clusters. One of these targets (Abell 2261) was seriously affected by radio frequency interference (RFI). As a result, no useful image was obtained. Therefore, we will present new data for 13 targets only333MACSJ1720 is partially affected by the same type of interference; however, we were able to obtain useful data, despite this field shows the largest noise.. The observed targets are listed in Table 1, together with the other CLASH clusters included in the relaxed sample. We plan to complete the observation of the entire CLASH sample with a future proposal, including the 5 merging CLASH clusters observable from the JVLA site. In Table 1 we also identify the optical counterparts of each cluster BCG found in optical or IR surveys among 6dFGS (Jones et al., 2004), 2MASS (Skrutskie et al., 2006), SDSS (York et al., 2000), and WISE (Wright et al., 2010). All our clusters have a well-defined BCG with no ambiguous cases (e.g., a cluster with two comparable galaxies). In the fourth column of Table 1 we list the cluster redshift published in the literature. In the sixth and seventh columns of Table 1 we list the radio counterpart candidates from NVSS and FIRST, respectively, that would be associated with the BCG by assuming a simple matching criterion based on the optical and radio position. In detail, we select the NVSS and FIRST source closest to the position of the optical counterpart within a radius of 20 arcsec and 2 arcsec for NVSS and FIRST, respectively. A large matching radius is suggested also for very bright sources in NVSS, where the FWHM is 45 arcsec444See discussion by R. L. White on the NRAO Science Forum https://science.nrao.edu/forums.. Since FIRST resolution is 5 arcsec on average, a matching radius of 2 arcsec is chosen for consistency with the radius of 20 arcsec used for NVSS sources. With this conservative choice, among the sources observed with the JVLA, 10 out of 13 BCGs in our sample have a radio counterpart either in the NVSS or FIRST survey or both, while five fields do not have FIRST coverage. Among the seven sources not observed in our program, five and three have radio counterparts in NVSS and FIRST, respectively.
| Central frequency | 1.5 GHz |
| Configuration | A |
| No. of antennas | 27 |
| No. of spectral windows | 16 |
| Total bandwidth (GHz) | 1.0 |
| No. of channels/spw | 64 |
| Total no. of channels | 1024 |
| Spectral window bandwidth (MHz) | 64 |
| Channel bandwidth (MHz) | 1.0 |
| Channel separation (MHz) | 0.5 |
3. Observations and Data Reduction
We present here new data on 13 clusters observed with the JVLA in A configuration from February 24th to April 24th, 2014. The A configuration has a maximum baseline of 36.4 km. We used a bandwidth of 1 GHz centered at 1.5 GHz (L band). The largest angular size of a radio source detectable at 1.5 GHz with the A configuration is about 36 arcsec. The full-width half-maximum of the primary beam is arcmin. The observing setup is summarized in Table 2. Total exposure time, useful spectral windows, phase and gain calibrators, beam size and noise level for each target are listed in Table 3. Each cluster in our sample was observed for about 1 hour or slightly more. The typical angular resolution (synthesized beam size) is arcsec. We note that the noise level reached in our images at the aimpoint is on average mJy, about twice as large as the value of mJy that was the goal of the proposal. The main reason for this noise level is the geostationary satellite belt (which is around DEC= 0 deg) which introduces a significant amount of extra RFI for five of our targets not accounted for in the proposal. Moreover, for the two fields with the highest noise, RXJ1532 and MACSJ1720, where the noise level at the aimpoint is of the order of and mJy, respectively, the flux calibrator used for the observations was not optimal, and this causes an uncertain bandpass calibration. In addition, half of the observation of MACSJ1720 was carried out with 6 spectral windows (spws), and most of them had to be omitted from the analysis. Finally, RXJ2129 and again MACSJ1720, have very bright and complex off-axis sources, which are difficult to clean. Overall, the average noise level achieved in the 13 fields is low enough to reach our science goals, despite being a factor of larger than expected, and two fields having exceptionally high noise (more than five times the goal rms).
| Cluster | Calibrator | rms | Beam size | |||
|---|---|---|---|---|---|---|
| (min) | flux | phase | (Jy) | arcsec arcsec | degree | |
| Abell 383 | 62.4 | 3C48 | J0241-0815 | 19 | 1.11 1.01 | -11 |
| Abell 209 | 62.4 | 3C48 | J0132-1654 | 22 | 1.64 1.13 | 27 |
| Abell 1423 | 63.5 | 3C286 | J1215+3448 | 18 | 1.58 1.07 | 39 |
| RXJ2129 | 61.2 | 3C48 | J2136+0041 | 42 | 1.12 1.07 | -11 |
| Abell 611 | 63.0 | 3C147 | J0751+3313 | 14 | 1.03 0.95 | -68 |
| MS2137-2353 | 58.8 | 3C48 | J2138-2439 | 19 | 1.76 0.86 | -3 |
| RXJ1532 | 62.4 | 3C295∗ | J1602+3326 | 47 | 1.67 1.11 | 52 |
| MACSJ1931 | 61.2 | 3C48 | J1924-2914 | 29 | 2.05 0.94 | -169 |
| MACSJ1720 | 57.9 | 3C295∗ | J1721+3542 | 69 | 1.34 1.09 | 28 |
| MACSJ0429 | 57.7 | 3C48 | J0423-0120 | 29 | 1.06 1.02 | -14 |
| MACSJ0329 | 61.3 | 3C48 | J0339-0146 | 17 | 1.10 1.04 | -28 |
| MACSJ1423 | 62.4 | 3C286 | J1436+2321 | 29 | 1.17 1.11 | 72 |
| MACSJ0744 | 61.8 | 3C147 | J0753+4231 | 15 | 1.03 0.97 | 25 |
* Because 3C295 is not a suitable flux calibrator for VLA configuration A, we adopt the phase calibrator for RXJ1532 and MACSJ1720. The flux of the phase calibrator J1602 is set to 2.9 Jy with an index of 0.15, while flux of J1721 is 0.3 Jy with an index of 0. Both indexes are fitted with VLA measurements in bands less than 2GHz.
Data calibration is performed with the reduction package Common Astronomy Software Applications (CASA, version 4.7.0) following standard JVLA procedures for low frequency wide-band, wide-field imaging data. After applying the standard antenna position correction and the gain curve and opacity correction, the original data are processed with the Hanning smoothing. Then we apply the rflag algorithm to remove strong RFI. The RFI at the spectral window 8 is mostly caused by satellite communication, and is always stronger than the signal from calibrators. Therefore, we mask spectral window 8 in all our observations. After the bandpass correction and the gain correction, the resulting images employ natural weighting of the visibility data. We consider a square field of view (FOV) of 30 arcmin on a side. The size of each pixel is set to 0.3 arcsec. With these choices, the FOV fully covers the X-ray emission in Chandra ACIS-I and the resolution is comparable to that of Chandra at the aimpoint.
After at least 3 self-calibrations, the final images are generated with the wide-field multi-frequency synthesis algorithm and are cleaned by interactive deconvolution. In Figures 1 we show the central fields, centered on the optical position of the BCGs, shown as a cross. The color scale varies logarithmically from 3 to the maximum flux density of each field. X-ray surface brightness contours from Chandra are also shown with solid blue lines. A direct visual inspection shows that in 11 out of 13 cases the peak of the X-ray emission overlaps with the position of the radio emission within the positional errors, while in 2 cases (Abell 209 and Abell 1423) no radio emission is detected at the optical position of the BCG. In both clusters a strong radio source is found nearby, but clearly displaced from the X-ray peak (as also noticed by Hogan et al., 2015a). The full-field images will be presented and discussed in a future paper focused on the member galaxy population (H. Yu et al. 2018, in preparation).


4. Results
In this section we present the results of our data analysis. We start from the identification of the counterparts of the central radio sources, then we measure flux, source extent, spectral slope, and luminosity for each BCG. Finally, the average radio properties of our BCG sample are compared with other quantities derived from the literature, such as star formation rate (SFR) in the BCG, and free enthalpy measured from the cavity size in the X-ray images.
4.1. Identification of the BCG
Our observations are all centered at the position of the peak of the X-ray emission. As previously mentioned, in each of the relaxed CLASH clusters the X-ray emission is centered on the position of the optical BCG. Donahue et al. (2016) also show that offsets are usually within a couple of arcseconds or less. In Section 2 we already identified radio sources in NVSS and FIRST catalogs as potential candidate counterparts of the BCG and listed them in Table 1.
We now reconsider the potential candidate counterparts of Table 1 on the basis of our radio images. First, we cross-correlate the position of the radio sources at the pointing centers with the position of the optical BCG using HST data. Given the subarcsecond positional error of our radio data and of the HST images, we are able to unambiguously associate the central radio source of our images to the nucleus of the BCG. There are 11 clusters containing radio galaxies in their center. The typical offset between the radio and optical positions of the center of the BCG is 0.2 arcsec, consistent with the positional error. For Abell 383, RXJ2129, MS2137, RXJ1532, MACSJ1729, MACSJ0429, MACSJ0329, and MACSJ1423, we confirm the unique counterpart found in the NVSS and/or FIRST catalogs and listed in Table 1.
Only two clusters (Abell 209 and Abell 1423) do not show any radio counterpart for the BCG, and we were able to put only upper limits on the flux and luminosity of these BCGs. In both cases we find two bright radio sources with head-tail morphologies at a distance of few arcsec from the BCG. Each source can be easily identified with satellite galaxies in the HST images. Both of them are cluster members, confirmed by spectroscopic data. In particular, in Abell 1423, the head-tail galaxy is at a projected distance of ” (corresponding to 41.2 kpc), while in Abell 209, it is found at a projected distance of ” (corresponding to 59.5 kpc). These radio sources would have been mistakenly assumed to be the radio counterpart of the BCG in NVSS data without a careful screening of each single case and a refined analysis, as shown by our preliminary search for radio counterparts (see Table 1). Bright head-tail, or wide-angle tail radio galaxies have been found in relaxed clusters, for example in the case of Abell 194 (Sakelliou et al., 2008), although they are thought to be more frequent in merging clusters (see Abell 562 and Abell 2634, Douglass et al., 2011; Hardcastle et al., 2005). The presence of head-tail radio galaxies may be a tracer of an unrelaxed dynamical state, as already suggested by Bliton et al. (1998). We plan to investigate the nature of these galaxies on a forthcoming paper on the member galaxy population.
Finally, in the case of MACSJ1931 we find that an NVSS source at a distance of (corresponding to 205.4 kpc and therefore not included as a preliminary candidate counterpart) is actually the sum of the BCG radio emission and another nearby, bright head-tail galaxy. In this case the use of NVSS data would have assigned an incorrect flux for the BCG. Overall, we find % wrong or partially misidentified associations would be made if based on a direct cross-correlation with the NVSS. Studies on radio properties of BCGs at medium and high redshift may be significantly improved by the use of high resolution data, because of the possible contamination by bright radio sources in the inner regions of the clusters.
4.2. Centroid offset
We compute the projected distance of the optical center of the BCG from the radio source associated with the BCG nucleus, and the distance of the optical center from the X-ray peak in the soft band (0.5-2 keV). Uncertainties in the X-ray peak and radio centroids are almost constant and equal to arcsec and arcsec, respectively. Errors on the optical positions are always below arcsec and therefore negligible. Due to the relaxed status of our cluster sample, the X-ray peak is coincident within less than 1 arcsec with the 10 kpc X-ray centroid, defined as the center of the highest S/N circle with a fixed radius of 10 kpc. In Table 4 we list the equatorial coordinates (epoch J2000.0) of BCGs (optical and radio bands) and of the cluster X-ray centroids. In Figure 2 we show the distribution of the displacement between the optical position and the radio position (blue circles), and between the optical position and the X-ray centroid (red squares).
The narrow distribution of the optical-radio displacements (less than 0.5 arcsec) is consistent with the radio positional error and confirms the unambiguous identification of the radio source with the BCG nucleus. On the other hand, the distribution of the optical-X-ray displacements is slightly wider than expected from the positional errors. Donahue et al. (2016) have shown a similar result with the whole CLASH sample. Offsets are known to be the signature of an unrelaxed dynamics, and are often found in clusters with no or weak cool cores and a radio-silent BCG (Sanderson et al., 2009). On the other hand, the X-ray centroid and the line emission region are tightly linked, sometimes despite an offset between the X-ray centroid and the BCG (Hamer et al., 2012), showing that the cooling process is not immediately switched off when the dynamics in the core is disturbed.
We note that larger cluster samples (several hundreds) show an average projected spatial offset between the optical position of the BCG and the X-ray center of about 10 kpc, with only 15% of the BCGs lying more than 100 kpc from the X-ray center of their host cluster (see Lauer et al., 2014). In addition, the BCG position relative to the cluster center is correlated with the degree of concentration of X-ray morphology (Hashimoto et al., 2014). However, the offset of the optical position of the BCGs with respect to the X-ray peaks in our sample is consistent with the measurement uncertainties in most cases, so that we do not draw any conclusion on the dynamical state of the cluster from this measurement. The largest offset is observed in Abell 209, where the distance of the optical/radio position from the X-ray centroid is , corresponding to 14.3 projected kpc. A deeper X-ray observation of Abell 209, which has so far been observed only for 20 ks with Chandra, is needed to further investigate this aspect and possibly identify the origin of the offset555The XMM observation of Abell 209, carried out by the EPIC pn and MOS detector, can also be used to investigate the ICM dynamics, but with a poor angular resolution corresponding to an Half Energy Width ”.. However, the optical study in Annunziatella et al. (2016) already shows that Abell 209 is not fully relaxed. This interpretation is also supported by the observation of a radio halo in Abell 209, which may be regarded as the signature of a strong ongoing merger (Giovannini et al., 2009; Kale et al., 2015). Overall, the CLASH clusters discussed in this work are expected to be dynamically relaxed, while we expect to find much larger BCG-X-ray peak displacements in the five CLASH clusters in the high-magnification subsample, not included in this study.
| cluster | RAHST | DECHST | RAJVLA | DECJVLA | RAChandra | DECChandra |
|---|---|---|---|---|---|---|
| Abell 383 | 2:48:03.38 | -3:31:45.27 | 2:48:03.4 | -3:31:45.1 | 2:48:03.4 | -3:31:46.7 |
| Abell 209 | 1:31:52.55 | -13:36:40.49 | - | - | 1:31:52.9 | -13:36:41.7 |
| Abell 1423 | 11:57:17.36 | +33:36:39.57 | - | - | 11:57:17.3 | +33:36:38.8 |
| RXJ2129 | 21:29:39.96 | +0:05:21.19 | 21:29:40.0 | +0:05:21.1 | 21:29:40.0 | +0:05:21.8 |
| Abell 611 | 8:00:56.82 | +36:03:23.63 | 8:00:56.8 | +36:03:23.5 | 8:00:56.8 | +36:03:23.6 |
| MS2137 | 21:40:15.16 | -23:39:40.12 | 21:40:15.2 | -23:39:40.4 | 21:40:15.2 | -23:39:40.2 |
| RXJ1532 | 15:32:53.78 | +30:20:59.45 | 15:32:53.8 | +30:20:59.6 | 15:32:53.7 | +30:20:58.8 |
| MACSJ1931 | 19:31:49.63 | -26:34:33.16 | 19:31:49.6 | -26:34:33.5 | 19:31:49.6 | -26:34:33.8 |
| MACSJ1720 | 17:20:16.75 | +35:36:26.22 | 17:20:16.8 | +35:36:26.4 | 17:20:16.8 | +35:36:26.9 |
| MACSJ0429 | 4:29:36.01 | -2:53:06.72 | 4:29:36.0 | -2:53:06.8 | 4:29:36.0 | -2:53:08.2 |
| MACSJ0329 | 3:29:41.57 | -2:11:46.45 | 3:29:41.6 | -2:11:46.7 | 03:29:41.6 | -2:11:46.7 |
| MACSJ1423 | 14:23:47.88 | +24:04:42.44 | 14:23:47.9 | +24:04:42.6 | 14:23:47.9 | +24:04:42.4 |
| MACSJ0744 | 7:44:52.80 | +39:27:26.65 | 7:44:52.8 | +39:27:26.6 | 7:44:52.8 | +39:27:26.4 |

| cluster | JVLA (mJy, 1.5 GHz) | (mJy, 1.4 GHz) | ||
| NVSS | FIRST | |||
| Abell 383 | 27.52 0.02 | 36.75 0.07 | 40.9 1.3 | 41.37 0.12 |
| Abell 209 | 0.10 | 0.08 | no detection | no coverage |
| Abell 1423 | 0.04 | 0.05 | no detection | no detection |
| RXJ2129 | 14.94 0.04 | 22.52 0.12 | 25.4 1.2 | 24.27 0.10 |
| Abell 611 | 0.80 0.01 | 0.85 0.02 | no detection | no detection |
| MS2137 | 1.24 0.02 | 1.39 0.03 | 3.8 0.5 | no coverage |
| RXJ1532∗ | 15.33 0.05 | 16.19 0.11 | 22.8 0.8 | 17.11 0.14 |
| MACSJ1931 | 11.57 0.03 | 19.38 0.05 | no detection | no coverage |
| MACSJ1720∗ | 21.14 0.07 | 24.08 0.17 | 18.0 1.0 | 16.75 0.24 |
| MACSJ0429 | 124.27 0.03 | 126.16 0.07 | 138.8 4.2 | no coverage |
| MACSJ0329 | 2.92 0.02 | 3.33 0.03 | 6.9 0.6 | no coverage |
| MACSJ1423 | 3.55 0.03 | 4.28 0.05 | 8.0 1.1 | 5.22 0.15 |
| MACSJ0744 | 0.27 0.01 | 0.27 0.03 | no detection | no detection |
| Abell 2261 | 5.3 0.5 | 3.40 0.15 | ||
| RXJ2248 | no coverage | no coverage | ||
| MACSJ1115 | 16.2 1.0 | 8.27 0.15 | ||
| MACSJ1206 | 160.9 6.3 | no coverage | ||
| RXJ1347 | 45.9 1.5 | no coverage | ||
| MACSJ1311 | no detection | no detection | ||
| ClJ1226 | 4.3 0.5 | 3.61 0.13 | ||
*: MACSJ1720 and RXJ1532 may have errors in the flux larger than quoted, due to the use of the phase calibrator also as a flux calibrator. We plan to refine the estimate of the errors when investigating the full source sample in the two fields.

4.3. Radio fluxes
The redshifts, coordinates, peak fluxes, and integrated fluxes for the radio counterparts of the BCGs observed in our program are listed in Table 5. All peak fluxes and integrated fluxes are measured with the software PyBDSF (the Python Blob Detector and Source Finder666Also named PyBDSM, see http://www.astron.nl/citt/pybdsm/., Mohan & Rafferty, 2015).
As a first step, we compare the radio fluxes of the BCGs in our data with data from NVSS and FIRST, whenever a clear counterpart is identified in one of these two surveys and confirmed by our data777For the sake of comparison, fluxes computed at GHz are corrected by the factor , where the spectral index is discussed in Section 4.5. This correction amounts to a maximum of 5%.. By comparing Table 5 with Table 1, we find that three NVSS counterparts are dropped completely or partially (Abell 209, Abell 1423 and MACSJ1931), and in all the cases this is due to contamination by radio galaxies close to the BCG, which are unambiguously identified as cluster members in our data. In Figure 3, we plot the JVLA integrated fluxes of the BCG versus the NVSS and FIRST integrated fluxes. We find overall a good agreement for the 5 sources in FIRST, with some discrepancy that can be ascribed to variability (see Hogan et al., 2015b, for a discussion on the variability at high frequencies). On the other hand, fluxes from NVSS are systematically higher, particularly at low fluxes. This excess may be explained with the presence of extended radio emission that is not detected in our data. At bright fluxes the emission is likely to be dominated by the nucleus, so that measured fluxes do not depend significantly on the angular resolution. In addition, despite the limited statistics, this result is consistent with the comparison of NVSS and FIRST fluxes with previous VLA data (see Wold et al., 2012). Therefore, we conclude that radio fluxes measured in our data show no obvious discrepancy with previous measurements. This also allows us to consider FIRST and NVSS fluxes for the CLASH targets not included in this work. In particular, Abell 2261, CLJ1226 and MACSJ1115 are in FIRST, while MACSJ1206 and RXJ1347 have only NVSS data, but are bright enough (20 mJy) to be considered dominated by the nuclear emission. Although the angular resolution of NVSS data does not allow a secure identification by itself, we refer to Ebeling et al. (2009) and Hogan et al. (2015a) for a detailed discussion on the likely association of the radio emission with the BCG in both cases. Recently, high resolution JVLA 5GHz observations of MACSJ1206 confirmed the presence of a compact double source associated with the BCG (A. Edge 2017, private communication). Therefore we consider NVSS and FIRST counterparts as reliable for the sources not observed in our JVLA program.
| Cluster | FWHM size | Deconvolved size | |
| , ∘ | , ∘ | ||
| Abell 383 | 1.28 1.21, 115 | 0.75 0.51, 94 | 1.34 0.01 |
| Abell 209 | - | - | - |
| Abell 1423 | - | - | - |
| RXJ2129 | 1.64 1.01, 150 | 1.20 0.22 , 148 | 1.51 0.01 |
| Abell 611 | 1.08 0.97, 102 | unresolved | 1.06 0.05 |
| MS2137-2353 | 1.88 0.91, 175 | 0.660.24 , 165 | 1.12 0.04 |
| RXJ1532 | 1.72 1.13, 55 | unresolved | 1.06 0.01 |
| MACSJ1931† | 7.38 5.58, 76 | 7.28 5.24, 79 | 1.68 0.04 |
| MACSJ1720 | 1.39 1.20, 60 | unresolved | 1.14 0.01 |
| MACSJ0429 | 1.05 1.03, 160 | unresolved | 1.02 0.01 |
| MACSJ0329 | 1.20 1.09, 145 | 0.48 0.32, 139 | 1.14 0.02 |
| MACSJ1423 | 1.31 1.20, 90 | 0.61 0.42, 103 | 1.21 0.02 |
| MACSJ0744 | 1.03 0.96, 73 | unresolved | 1.00 0.15 |
: In the case of MACSJ1931 the deconvolution algorithm includes also the minihalo, while the flux ratio refers only to the nuclear fluxes listed in Table 5. The integral flux including the minihalo would be F mJy.
4.4. Extent of BCG radio emission
In our radio images, we are not able to identify clear extended emission, despite the fact that jets and radio lobes are expected in any cool core, independently of the detection of X-ray cavities. Our peak and integrated fluxes are representative of the nuclear power, with the inclusion, if any, of some extended emission corresponding to the base of the jets, or to compact extended radio emission not directly associated with the nuclear BCG emission such as minihalos. In a systematic study based on the VLA archive (Giacintucci et al., 2014), minihalos have been detected in two clusters of our sample: RXJ1532 (see also Hlavacek-Larrondo et al., 2013) and MACSJ1931, with an additional candidate found in MACSJ0329. Despite the A configuration of JVLA being less sensitive to extended sources, we present here a very preliminary investigation of the source sizes based on our high resolution data.
The existence of extended structures can be estimated by comparing the beam size with the deconvolved size of our sources, obtained by PyBDSF. The deconvolved (DC) sizes and the ratio are listed in Table 6. Roughly we find that the deconvolved size correlates with the ratio , as expected. Formally, the measurement errors on the deconvolved size are negligible (of the order of %) but they do not include possible smearing of the image due to small errors in the phase calibration. Therefore, we should use a conservative criterion to asses the extent of a source.
We notice that the highest values (above 1.3) are associated with deconvolved sizes typically larger than half the beam size. Based on this criterion, we classify three sources (Abell 383, RXJ2129 and MACSJ1931) to be clearly resolved888For Abell 383 and RXJ2129 the presence of a non core component has already been shown in Hogan et al. (2015a). MACSJ1931 has the largest size and flux ratio, mostly because of its minihalo, which lies 2.8 arcsec offset from the BCG and with a peak flux of 2.1 mJy, as shown in Giacintucci et al. (2014). The deconvolved size of MACSJ1931 also includes the minihalo.
There are three other sources with , whose deconvolved sizes are about half of the beam. We classify these sources (MS2137, MACSJ0329, MACSJ1423) as tentatively resolved. Finally, the remaining 5 sources (Abell 611, RXJ1532, MACSJ1720, MACSJ0429 and MACSJ0744) are unresolved with present data. A discussion on the presence of non core emission for some of the sources not observed in our program (namely MACSJ1115, Abell 2261, MACSJ1347 and MACSJ1206) can be found in the Appendix of Hogan et al. (2015a).
4.5. BCG Spectral properties
| Cluster | |||||||||
| (mJy) | (mJy) | (mJy) | (mJy) | (mJy) | (mJy) | ||||
| Abell 383 | 224.8 | 23.0 | - | - | - | 4.40 0.50 | 4.3 0.2 | -0.72 0.01 | -0.72 0.02 |
| Abell 209 | - | - | - | - | - | - | - | - | |
| Abell 1423 | - | - | - | - | - | - | - | ||
| RXJ2129 | 114.8 | 12.4 | - | 9.05 0.07 | 4.2 0.1 | 2.33 0.14 | 2.6 0.2 | -0.79 0.03 | -0.72 0.03 |
| Abell 611 | - | - | - | - | - | - | - | ||
| MS2137 | - | - | - | - | - | - | - | ||
| RXJ1532 | 52.2 | 7.1 | 71 3.6 | 8.82 0.08 | 6.30 0.1 | 3.25 0.228 | 3.2 0.3 | -0.52 0.03 | -0.54 0.02 |
| MACSJ1931 | 6315.0 | 631.7 | - | - | - | - | - | -0.725 | - |
| MACSJ1720 | 119.7 | 13.9 | 103 3.0 | - | - | - | 1.8 0.4 | -0.89 0.07 | -0.87 0.08 |
| MACSJ0429 | 106.2 | 12.1 | - | - | - | - | 18.2 0.2 | -0.61 0.11 | -0.65 0.01 |
| MACSJ0329 | - | - | - | - | - | 0.3 0.44 | - | -0.80 0.45 | |
| MACSJ1423 | 78.5 | 12.7 | 27 2 6 | - | - | 1.49 0.13 | 2.0 0.2 | -0.37 0.10 | -0.25 0.04 |
| MACSJ0744 | - | - | - | - | - | - | - | - | |
| Abell 2261 | 33.0 | 5.9 | 36 3.4 | 0.59 0.05 | - | 0.20 0.30 | - | -1.24 0.13 | -0.95 0.52 |
| RXJ2248 | - | - | - | - | - | - | - | - | |
| MACSJ1115 | 138.1 | 14.4 | - | - | - | 1.4 0.4 | -1.21 0.14 | -0.59 0.03 | |
| MACSJ1206 | 2154.3 | 215.7 | - | - | - | - | - | - | - |
| RXJ1347 | 215.2 | 22.3 | - | - | 10.38 0.47 | 8.7 0.2 | -0.56 0.02 | -0.56 0.02 | |
| MACSJ1311 | - | - | - | - | - | - | - | - | |
| ClJ1226 | - | - | - | - | - | - | -0.83 0.23 | ||
The spectral energy distribution (SED) of a BCG in the radio band is usually decomposed into a nuclear component and an extended one. The nuclear component is directly linked to the AGN and shows a rather flat spectral energy distribution with an energy index (see Hogan et al., 2015a). The core component may show synchrotron self-absorption, or, in some cases, free-free absorption, at around few GHz, but usually it remains flat to frequencies up to several GHz. The extended component, on the other hand, is mostly associated with lobe emission, and therefore is generated by an older, relativistic electron population accelerated during past nuclear activity. Other forms of emission surrounding the BCG may be due to processes not related to the nuclear activity, as in the case of minihalos, appearing as spherically symmetric, small scale (a few 102 kpc), with a steep radio spectrum, probably originating from electrons accelerated in-situ by the turbulent motion of the ICM in the core (hence, indirectly due to the nuclear activity, see Giacintucci et al., 2014). In general, this steeper component is less prominent at 1.5 GHz.
Usually, the SED of BCGs can be modeled with two components corresponding to the different central activities. However, modeling two components goes beyond our capability given the present data, and therefore that effort is postponed to a future work, which will include also our 2-4 GHz data. To achieve a preliminary characterization, we model the spectra of our BCGs with a single power law defined as , where is the flux energy density as a function of the frequency . Our goal is to derive an effective spectral index that can be used to apply the k-correction when computing the radio power at different redshifts. Therefore, we collect all the radio measurements in the frequency range 150 MHz to 30 GHz from the literature (the data coverage above 30 GHz is too sparse to be useful). The radio SED of our BCGs are shown in Table 7, where the flux densities are sparsely sampled at six different frequencies to complement the 1.5 GHz flux densities measured in this work.
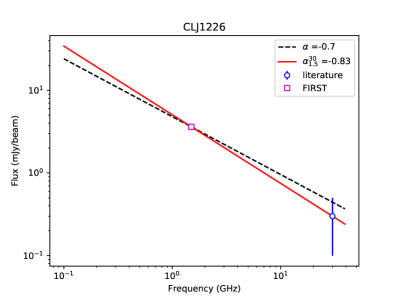
We fit the SED with a single power law when at least three points are present, deriving an average spectral slope when the is acceptable. Then we compute the index as a proxy of the average spectral slope. We note that the values of and are always consistent when is available (see Table 7). In the few cases where we have no means to compute a proxy for the spectral index, we simply assume to compute the k-correction. In the Appendix we show the SED in the 150 MHz-30 GHz range for 7 BCGs observed in our JVLA program and for 4 with FIRST counterparts for which we are able to measure . We also show the lines corresponding to the index , the reference slope , and when possible, the best-fit power law with slope .
Despite the broad agreement among the three spectral indices, we can still identify some sources whose spectra are clearly not well fitted by a single power law. In particular, MACSJ1423 shows a hint of a steep component at low frequencies; MACSJ0429 shows a GHz-peaked SED, possibly due to a self-absorbed core; finally, we are not able to distinguish the core and the minihalo emission in MACSJ1931 in the flux measurement at low frequencies (the TGSS counterpart J193149.6-263432 has a size of ). For these sources we are not able to derive a meaningful . For MACSJ1931, in Table 7 we report the value of the spectral slope measured by Sayers et al. (2013). The histogram of the spectral index for the sources observed with JVLA or with FIRST counterpart is shown in Figure 4. Values of range from -0.25 to , with an average . We find that the distribution of is consistent with results obtained for the spectral shape of BCGs in NVSS (Lin & Mohr, 2007) and in the more recent work by Hogan et al. (2015a).
As discussed in the previous section, our high-resolution data are not sensitive to extended, low surface brightness emission and therefore mainly sample the nuclear emission, with no possibility of separately identifying and analyzing an extended component. Therefore our average estimate of the spectral slope may be somehow affected by diffuse emission. Despite this, the distribution of our measured average spectral slope is consistent with radio emission dominated by nuclear emission. Therefore, for the sake of computing radio power, we assume as the default choice when we are not able to derive a value for the spectral index, or rely on measurements presented in Sayers et al. (2013) in the case of MACSJ1931. We are aware that these results on the spectral shape are merely an approximation of the real spectral shape in the relevant frequency range, given the significant variety in the spectral shape of BCGs. However, we conclude that is still a useful quantity for estimating the k-correction, also considering the low redshift leverage of our sample. We will improve our measurements of spectral slope when the 2-4 GHz data are fully analyzed.

| Cluster | K0 | UV-IR | SFR | Pcav | |
|---|---|---|---|---|---|
| () | (keV cm2) | (mag) | () | (1044 erg/s) | |
| Abell383 | 3.62 0.02 | 13.0 1.6 | 4.36 0.04 | 3.29 0.40 | 19 7 |
| Abell209 | 0.010 | 105.5 26.9 | 5.5 0.1 | 1.2 1.1 | - |
| Abell1423 | 0.005 | 68.3 12.9 | 4.96 0.13 | 2.2 0.4 | - |
| RXJ2129 | 3.55 0.04 | 21.1 3.7 | 4.98 0.09 | 2.9 0.4 | - |
| Abell611 | 0.211 0.005 | 124.9 18.6 | 5.69 0.14 | 0.90 1.7 | - |
| MS2137 | 0.418 0.009 | 14.7 1.9 | 4.07 0.03 | 5.6 0.7 | - |
| RXJ1532 | 6.44 0.08 | 16.9 1.8 | 2.83 0.04 | 48.6 2.6 | 54 22 |
| MACSJ1931 | 7.65 0.02 | 14.6 3.6 | 2.04 0.04 | 83.1 2.3 | 5 2 |
| MACSJ1720 | 12.4 0.4 | 24.0 3.4 | 4.54 0.05 | 6.1 0.7 | 16 7 |
| MACSJ0429 | 64.7 0.3 | 17.2 4.3 | 3.75 0.05 | 20.1 2.1 | - |
| MACSJ0329 | 2.37 0.42 | 11.1 2.5 | 3.3 0.03 | 31.0 2.4 | 52 20 |
| MACSJ1423 | 3.77 0.11 | 10.2 5.1 | 3.14 0.02 | 16.7 1.2 | 15 6 |
| MACSJ0744 | 0.51 0.06 | 42.4 10.9 | 4.6 0.13 | 8.5 3.1 | 85 39 |
| Abell 2261 | 0.48 0.07 | 61.1 8.1 | 5.47 0.07 | 3.3 2.8 | - |
| RXJ2248 | - | - | |||
| MACSJ1115 | 3.01 0.08 | 14.8 3.1 | 3.38 0.02 | 6.4 0.5 | - |
| MACSJ1206 | 99.9 3.9 | 69.0 10.1 | 4.5 0.05 | 6.8 3.0 | - |
| RXJ1347 | 28.72 1.8 | 12.5 20.7 | 3.81 0.03 | 16.5 1.8 | - |
| MACSJ1311 | - | - | - | - | - |
| ClJ1226 | 12.43 2.27 | 166.0 45.0 | 5.37 0.17 | 2.7 1.5 | - |
4.6. Radio luminosity and correlation with SFR and ICM entropy
The emitted power density at 1.5 GHz in the rest frame of a source is derived from its flux density and spectral slope. We compute the radio power at 1.5 GHz as
| (1) |
where the k-correction is computed as and is the luminosity distance assuming the cosmological parameters quoted in Section 1. The distribution of radio power of the 11 BCGs whose radio emission is detected in our data is shown in Figure 5, where we also include the five BCGs with FIRST and NVSS fluxes. The range of radio luminosities of our BCGs spans more than two and a half orders of magnitude. We have for 11 BCGs, and (therefore above the knee of the BCG radio luminosity function) for 3 BCGs, with MACSJ1226 reaching the highest luminosity of . We note that the detection of a few very bright sources in a small sample of cool core clusters is consistent with the radio luminosity function of BCGs in a comparable X-ray sample. In particular, cool-core clusters have a frequency of BCGs with radio power W Hz-1 at least times larger than non-cool-core clusters (see Hogan et al., 2015a).

We present a preliminary comparison of radio luminosity with properties of the surrounding ICM and star formation rate (SFR) measured in the BCGs (see Donahue et al., 2015). We also obtain the central X-ray gas entropy of our clusters from the cluster sample in the Archive of Chandra Cluster Entropy Profile Tables (ACCEPT) (Cavagnolo et al., 2009), updated with the revised values in Donahue et al. (2015) when needed. All these quantities are listed in Table 8. We expect to find a clear difference in the radio properties of BCGs depending on the cluster core properties, as already shown in the literature. As Cavagnolo et al. (2008) already pointed out on the basis of a lower redshift sample, and also confirmed by Rafferty et al. (2008), high-power BCG radio sources only inhabit clusters with low central gas entropy, with a threshold at keV cm2, roughly corresponding to a cooling time of yr. Also, star formation activity appears to be ubiquitous in BCG hosted by a cool core with keV cm2 (Fogarty et al., 2015). More comprehensive studies also showed that all BCGs with a low central entropy (with emission lines linked to ongoing star-formation events) are detected as radio sources (Hogan et al., 2015a) and as star forming galaxies (Fogarty et al., 2017), pointing toward a common fueling source from the hot ICM for both nuclear activity and star formation.
The relation between the central ICM entropy and the radio luminosity of BCGs in our sample is shown in Figure 6. In particular, the threshold keV cm2 efficiently identifies the radio-luminous BCGs. For values keV cm2 we find luminosities mostly in the range W Hz-1, with three sources equal to or above W Hz-1. Five of the seven BCGs above keV cm2 have radio power density of a few W Hz-1 or lower. However, two of them (MACSJ1206 at and CLJ1226 at , with fluxes from NVSS and FIRST, respectively) are in strong contrast with this picture. To better quantify the presence of high radio power sources in high entropy cores, we consider the cumulative luminosity function presented in Hogan et al. (2015a), where line-emitting BCGs can be associated with low entropy ( keV cm2) cores, and non-line-emitters with high entropy cores. The fraction of sources with radio power larger than W Hz-1 at keV cm2 is 20-30%, in line with our value of 3/11. On the other hand, the fraction of luminous sources at keV cm2 is 5-10%, lower than our value 2/7. Clearly our results, based only on two sources, and on a limited sample (we do not consider the five dynamically disturbed CLASH clusters in this work) do not allow to draw any conclusions. If this is due to some evolution with redshift in the ICM properties in the core or in the radio properties of BCG, is a topic that must be investigated with a refined analysis of the Chandra X-ray data and high resolution JVLA data. In particular, MACSJ1206 is the target of an approved Chandra proposal in AO19 for a deep exposure of 180 ks (PI S. Ettori).
Finally, the radio emission in Abell 2261 has been discussed extensively in Burke-Spolaor et al. (2017), where it has been found to be associated with a compact radio relic, with a steep spectrum, and with a significant offset from the BCG nucleus. Although this relic is most probably associated with nuclear activity recently switched off, this source is definitely different from that expected from a radio active nucleus, and therefore it may not share the same properties of our sample.

Below the keV cm2 threshold, BCGs are observed to have ongoing star formation and multiphase gas, as already pointed out by Donahue et al. (2015). The UV-NIR color is a reliable proxy of the instantaneous star formation activity of a galaxy, by comparing the rest-frame 280 nm UV emission contributed by young hot stars to the 1 m peak of the stellar-light spectrum from evolved stars. Note that the excess UV luminosity does not take into account obscured star formation. So the quoted SFRs should be considered lower limits to the total star formation rate for these galaxies. The relation between the UV-NIR colors and the SFRs in CLASH cluster BCGs is discussed in Donahue et al. (2015). In Figure 7 we plot the radio luminosities of our BCGs vs the UV-NIR colors. The average color of quiescent BCGs in CLASH sample is 5.13 0.35 (Donahue et al., 2015) and it is shown as a vertical dashed line. We note a trend of higher radio luminosities associated with bluer UV-NIR colors, showing a significant presence of star formation activity in radio luminous BCGs. As for the two outliers in the radio power-entropy plot, CLJ1226 stands out in the upper right corner of the plot, with UV-NIR color larger than 5.2, while MACSJ1206 has a UV-NIR color.
An estimate of the SFR based on the UV luminosity is provided by Donahue et al. (2015), where they used the conversion from the excess UV luminosity to an unobscured SFR following Kennicutt (1998). This estimate has several sources of uncertainty: the initial mass function of stars in BCGs may be different from that of the star forming galaxies used by Kennicutt (1998); in addition, the star formation events in the BCGs may be shorter and thus the BCGs younger than expected; finally, they applied no correction for dust-obscured star formation, for which IR-based measurements are required. With these uncertainties in mind, we use these values to compare the radio power with the estimated SFR, finding that the measured radio power is always more than one order of magnitude larger than that expected from star formation alone. This confirms the general assumption that the radio emission in BCGs is dominated by nuclear emission, as also shown by Cooke et al. (2016). Only in two cases (Abell 611 and MACSJ0744) the contribution of the SFR at the 1.5 GHz flux density can be as high as 10%. This is clearly shown in Figure 8 where we compare the radio power versus star formation rate of our BCGs with the average radio luminosity-SFR relation found by Bell (2003):
| (2) |
The same conclusion is reached if we use a SFR measurement based on IR luminosity, and therefore not significantly affected by obscuration. For example, in the case of our strongest star forming BCG (in MACSJ1931) the SFR derived from Herschel data is (Santos et al., 2016), as opposed to the value of from Donahue et al. (2015). Even in this case, the expected contribution of the SFR to the radio emission is not larger than 5% of the total flux. We remark that the association of higher star forming rates with the largest radio power, while the weakest radio sources appear in BCGs with no detectable star formation in the UV (Donahue et al., 2015), does not imply that quenching is not happening. In fact, if these radio sources were not dumping energy into the surrounding gas, the star formation rates would be much higher, as seen in simulations that do not include AGN feedback. In addition, mechanical feedback is better traced by the extended emission from jets, while the nuclear radio emission is linked to the feeding of the SMBH, which, together with star formation events, is due to the cooling and condensation of the surrounding gas, as expected in top-down multiphase condensation models (see Gaspari et al., 2017).
The two sources with the faintest radio power density, Abell 611 and MACSJ0744, are both above the entropy threshold kev cm2, but are too faint to qualify as counter-examples to the pattern we see at low z. Being hosted by a weak cool core, they may not be accreting efficiently enough to be bright radio sources. Still, it would be important to understand whether they are fading AGN or burgeoning AGN. In any case, we can guess that they may be accreting at the Bondi rate from the hot gas, while the more luminous radio sources are fueled by cold gas, ultimately supplied via thermal instabilities in the hot gas (on this issue see Russell et al., 2013; Allen et al., 2006). Abell 611 show a clear unresolved X-ray emission in the hard band, and the BCG of MACSJ0744 is also a candidate X-ray AGN. These are the only two detections of unresolved X-ray emission in our sample together with MACSJ1931, which hosts a bright obscured AGN (see Santos et al., 2016). This may suggest different modes of accretion marked by the presence of nuclear X-ray emission, as discussed in a forthcoming paper by our team (Li-Lan Yang et al. 2018, in preparation).


by Bell (2003).
4.7. Radio power and energetics of X-ray cavities
A significant fraction of the feedback energy budget is stored in mechanical energy associated with large cavities carved into the ICM. These cavities can be detected as circular or ellipsoidal-shaped depressions in the projected X-ray surface brightness. The energetics required to inflate the X-ray cavities may be approximated with a standard technique (see Bîrzan et al., 2004; Hlavacek-Larrondo et al., 2015) which consists in computing the enthalpy of each bubble as , where is the thermal electron (only) pressure of the ICM at the radius of the bubble, and the electron density and the ICM temperature are derived from spatially-resolved spectral analysis. Here, is the volume of the cavity, computed as , where and are the semi-major axes projected along directions parallel and perpendicular, respectively, to the the jet (i.e., the direction connecting the BCG nucleus with the center of the cavity).
Several CLASH clusters have already been searched for cavities. We consider the measurements of the cavity sizes presented in Shin et al. (2016) for a sample of 133 clusters with sufficient X-ray photons for their analyses. Ten of the clusters in our sample are included in the list of Shin et al. (2016). The missing three are Abell 209, Abell 1423, and Abell 611. Interestingly, the first two show no radio emission from the BCG nucleus, and Abell 611 is the second least luminous among our BCGs. Abell 611 has only an upper limit to the cavity power from Hlavacek-Larrondo et al. (2013). Among the ten clusters in Shin et al. (2016), three have no cavities in their analysis (RXJ2129, MS2137, MACSJ0429), while there is at least one cavity for the remaining 7 clusters. We measure using the projected values of and from the ACCEPT cluster sample (Cavagnolo et al., 2009) and Donahue et al. (2015). Clearly this is an approximation to the actual enthalpy of the bubble; however, the largest source of uncertainty is associated with the size of the bubbles (typically 20% of the linear size). In the case of multiple bubbles, the total value is obtained simply by summing the values of for each cavity. A more meaningful quantity is the average mechanical power, which is obtained by dividing the mechanical energy in each cavity by the age of the cavity itself, approximated by the buoyancy time (see Bîrzan et al., 2004). Here, is the distance between the cluster core and the center of the bubble, is a drag coefficient, usually assumed to be , is the acceleration , where is the total mass within (taken from Donahue et al., 2014), and is the bubble size with uncertainties of 20%. However, the uncertainty in these diagnostics may be severely underestimated, since the total mechanical power depends on the number of detected cavities, and therefore depends also on the depth of the X-ray data or specific properties of the surface brightness distribution of the clusters.
Despite these uncertainties, we compare the radio nuclear emission with the energy and the mechanical power stored in the ICM as observed in current X-ray data. In the upper panel of Figure 9 we plot the mechanical energy of the seven clusters in which cavities have been detected versus the nuclear radio luminosity of their BCG. In the lower panel of Figure 9 we also plot nuclear radio power versus the mechanical power obtained from the cavity size and position, for the same seven clusters. At first glance, our sources are not described by the average relations found in the literature (see, e.g., Bîrzan et al., 2008; Cavagnolo et al., 2010), shown in the second panel. We observe a large intrinsic scatter between the average mechanical energy injected into the ICM and the instantaneous nuclear power of the BCG, and an average mechanical power higher than in local clusters hosting BCGs with comparable radio power. However, we are not able to draw any conclusions mainly because of the small size and the limited luminosity range of our sample. In addition, the sensitivity of X-ray observations of the CLASH sample does not guarantee a uniform sampling of cavities, particularly at low power (therefore smaller size) and medium-high redshift. In fact, a large component of the observed scatter may be due to the difficulty in identifying and measuring ICM cavities in current data. For example, the most discrepant cluster in Figure 9 is MACSJ0744, which is not listed by Hlavacek-Larrondo et al. (2013) among the MACS clusters with cavities, but turns out to be the one with the largest mechanical power in our sample according to Shin et al. (2016), despite the large errors. The cluster MACSJ0744 does not host an extremely strong cool core on the basis of its central entropy value keV cm2, so it can be interpreted as a case in which the cooling in the core has been recently quenched, while the outer halo still retain the imprint of the past mechanical-feedback activity. On the other hand, a positive correlation between the radio power and the average mechanical power is found in a much larger sample across four orders of magnitude in luminosity, despite the large scatter (see Bîrzan et al., 2008; Hogan et al., 2015a). In general, we conclude that the nuclear power should be considered only an approximation of the past history of the central radio source within at least an order of magnitude, which possibly indicates that feedback may occur also as outflows and winds not associated with energetic radio jets.


5. Conclusions
In this work we present new high-resolution, medium-deep 1.5 GHz continuum JVLA observations of the BCGs of 13 CLASH clusters of galaxies at . Our results can be summarized as follows:
-
•
We are able to characterize the radio properties of the nucleus in 11 BCGs, while 2 BCGs do not show radio emission in our data.
-
•
We find a head-tail galaxy close to the BCG in the two non-detections (Abell 209 and Abell 1423). The fact that at least one of the clusters (Abell209) appears to be unrelaxed, as discussed in Section 4.2, suggests that the presence of head-tail radio galaxies may be a tracer of an unrelaxed dynamical state.
-
•
We find nuclear luminosities for the CLASH BCGs in the range from to ; all our sources are consistent with being powered by an AGN, since their radio power is significantly larger than the value associated with the measured star formation rate in the BCG.
-
•
Average radio spectral slopes are estimated with the index , defined as the flux density ratio between 1.5 and 30 GHz, and are found in the range from to , with an average , therefore consistent with synchrotron radiation from relativistic electrons in the nucleus.
-
•
Most of our sources are consistent with being unresolved in our high-resolution data. Only for three cases (Abell 383, RXJ2129, and MACSJ1931), the radio emission from the BCG is resolved with a high confidence level, suggesting a contribution from the base of jets. The remaining sources are unresolved (5 sources) or marginally resolved (3 sources).
-
•
BCGs with high radio power in JVLA data are associated with low-entropy hot gas and higher SFR, indicating that stronger AGN activity may be correlated with more intense star formation. This correlation is consistent with the standard scenario in which the nuclear activity of the BCG is fueled by cooling of gas from the hot ICM, which also provides the reservoir for star formation.
-
•
We also investigate five sources in the CLASH sample not yet observed with JVLA, but with reliable counterparts in FIRST and NVSS. Two of these sources (MACSJ1026 at and CLJ1226 at ) are unexpectedly found to have high nuclear radio power associated with a high-entropy core. This calls for a more in-depth multiwavelength analysis to investigate the nature of these sources.
-
•
We confirm a significant scatter between nuclear radio luminosity and average mechanical power derived from the cavity size and ICM pressure. However, we do not have the dynamic range nor the statistics to further investigate this correlation.
Further progress in understanding the complex scenario of the baryon cycle in and around BCGs requires a massive and multiwavelength analysis, from the radio to the X-ray band. In our effort to provide a radio coverage of one of the best studied cluster samples such as CLASH, we are planning to extend our observations in the A configuration, L band, to the CLASH clusters not included in this work and to use the 2-4 GHz data already acquired in a previous program by our group (VLA/13B-038, PI M. Aravena). We also plan to propose for JVLA in the B and C configurations to search for extended radio emission like jets and lobes or cavity-filling, relativistic plasma. In the meantime, we are currently mapping the entire field of view for our observations (30 arcmin on a side) to investigate the radio properties of CLASH member galaxies, exploiting the extensive spectroscopic follow-up of CLASH fields.
References
- Alam et al. (2015) Alam, S., Albareti, F. D., Allende Prieto, C., et al. 2015, ApJS, 219, 12
- Allen et al. (2006) Allen, S. W., Dunn, R. J. H., Fabian, A. C., Taylor, G. B., & Reynolds, C. S. 2006, MNRAS, 372, 21
- Allen et al. (2004) Allen, S. W., Schmidt, R. W., Ebeling, H., Fabian, A. C., & van Speybroeck, L. 2004, MNRAS, 353, 457
- Annunziatella et al. (2016) Annunziatella, M., Mercurio, A., Biviano, A., et al. 2016, A&A, 585, A160
- Bauer et al. (2000) Bauer, F. E., Condon, J. J., Thuan, T. X., & Broderick, J. J. 2000, ApJS, 129, 547
- Bell (2003) Bell, E. F. 2003, ApJ, 586, 794
- Bîrzan et al. (2008) Bîrzan, L., McNamara, B. R., Nulsen, P. E. J., Carilli, C. L., & Wise, M. W. 2008, ApJ, 686, 859
- Bîrzan et al. (2004) Bîrzan, L., Rafferty, D. A., McNamara, B. R., Wise, M. W., & Nulsen, P. E. J. 2004, ApJ, 607, 800
- Blanton et al. (2010) Blanton, E. L., Clarke, T. E., Sarazin, C. L., Randall, S. W., & McNamara, B. R. 2010, Proceedings of the National Academy of Science, 107, 7174
- Blanton et al. (2001) Blanton, E. L., Sarazin, C. L., McNamara, B. R., & Wise, M. W. 2001, ApJ, 558, L15
- Bliton et al. (1998) Bliton, M., Rizza, E., Burns, J. O., Owen, F. N., & Ledlow, M. J. 1998, MNRAS, 301, 609
- Bonamente et al. (2012) Bonamente, M., Hasler, N., Bulbul, E., et al. 2012, New Journal of Physics, 14, 025010
- Branchesi et al. (2007) Branchesi, M., Gioia, I. M., Fanti, C., & Fanti, R. 2007, A&A, 472, 739
- Burke-Spolaor et al. (2017) Burke-Spolaor, S., Gültekin, K., Postman, M., et al. 2017, ApJ, 849, 59
- Burns (1990) Burns, J. O. 1990, AJ, 99, 14
- Cavagnolo et al. (2008) Cavagnolo, K. W., Donahue, M., Voit, G. M., & Sun, M. 2008, ApJ, 683, L107
- Cavagnolo et al. (2009) —. 2009, ApJS, 182, 12
- Cavagnolo et al. (2010) Cavagnolo, K. W., McNamara, B. R., Nulsen, P. E. J., et al. 2010, ApJ, 720, 1066
- Coble et al. (2007) Coble, K., Bonamente, M., Carlstrom, J. E., et al. 2007, AJ, 134, 897
- Condon et al. (1998) Condon, J. J., Cotton, W. D., Greisen, E. W., et al. 1998, AJ, 115, 1693
- Cooke et al. (2016) Cooke, K. C., O’Dea, C. P., Baum, S. A., et al. 2016, ApJ, 833, 224
- Donahue et al. (2014) Donahue, M., Voit, G. M., Mahdavi, A., et al. 2014, ApJ, 794, 136
- Donahue et al. (2015) Donahue, M., Connor, T., Fogarty, K., et al. 2015, ApJ, 805, 177
- Donahue et al. (2016) Donahue, M., Ettori, S., Rasia, E., et al. 2016, ApJ, 819, 36
- Douglass et al. (2011) Douglass, E. M., Blanton, E. L., Clarke, T. E., Randall, S. W., & Wing, J. D. 2011, ApJ, 743, 199
- Dunn et al. (2010) Dunn, R. J. H., Allen, S. W., Taylor, G. B., et al. 2010, MNRAS, 404, 180
- Dunn & Fabian (2006) Dunn, R. J. H., & Fabian, A. C. 2006, MNRAS, 373, 959
- Dunn & Fabian (2008) —. 2008, MNRAS, 385, 757
- Ebeling et al. (2009) Ebeling, H., Ma, C. J., Kneib, J.-P., et al. 2009, MNRAS, 395, 1213
- Ehlert et al. (2011) Ehlert, S., Allen, S. W., von der Linden, A., et al. 2011, MNRAS, 411, 1641
- Fabian (1994) Fabian, A. C. 1994, ARA&A, 32, 277
- Fabian (2012) —. 2012, ARA&A, 50, 455
- Fogarty et al. (2015) Fogarty, K., Postman, M., Connor, T., Donahue, M., & Moustakas, J. 2015, ApJ, 813, 117
- Fogarty et al. (2017) Fogarty, K., Postman, M., Larson, R., Donahue, M., & Moustakas, J. 2017, ApJ, 846, 103
- Gaspari et al. (2013) Gaspari, M., Brighenti, F., & Ruszkowski, M. 2013, Astronomische Nachrichten, 334, 394
- Gaspari et al. (2012) Gaspari, M., Ruszkowski, M., & Sharma, P. 2012, ApJ, 746, 94
- Gaspari et al. (2017) Gaspari, M., Temi, P., & Brighenti, F. 2017, MNRAS, 466, 677
- Geller et al. (2014) Geller, M. J., Hwang, H. S., Diaferio, A., et al. 2014, ApJ, 783, 52
- Giacintucci et al. (2014) Giacintucci, S., Markevitch, M., Venturi, T., et al. 2014, ApJ, 781, 9
- Gioia & Luppino (1994) Gioia, I. M., & Luppino, G. A. 1994, ApJS, 94, 583
- Giovannini et al. (2009) Giovannini, G., Bonafede, A., Feretti, L., et al. 2009, A&A, 507, 1257
- Girardi et al. (2015) Girardi, M., Mercurio, A., Balestra, I., et al. 2015, A&A, 579, A4
- Guzzo et al. (2009) Guzzo, L., Schuecker, P., Böhringer, H., et al. 2009, A&A, 499, 357
- Hamer et al. (2012) Hamer, S. L., Edge, A. C., Swinbank, A. M., et al. 2012, MNRAS, 421, 3409
- Hardcastle et al. (2005) Hardcastle, M. J., Sakelliou, I., & Worrall, D. M. 2005, MNRAS, 359, 1007
- Hashimoto et al. (2014) Hashimoto, Y., Henry, J. P., & Boehringer, H. 2014, MNRAS, 440, 588
- Helfand et al. (2015) Helfand, D. J., White, R. L., & Becker, R. H. 2015, ApJ, 801, 26
- Hlavacek-Larrondo et al. (2012) Hlavacek-Larrondo, J., Fabian, A. C., Edge, A. C., et al. 2012, MNRAS, 421, 1360
- Hlavacek-Larrondo et al. (2013) Hlavacek-Larrondo, J., Allen, S. W., Taylor, G. B., et al. 2013, ApJ, 777, 163
- Hlavacek-Larrondo et al. (2015) Hlavacek-Larrondo, J., McDonald, M., Benson, B. A., et al. 2015, ApJ, 805, 35
- Hogan et al. (2015a) Hogan, M. T., Edge, A. C., Hlavacek-Larrondo, J., et al. 2015a, MNRAS, 453, 1201
- Hogan et al. (2015b) Hogan, M. T., Edge, A. C., Geach, J. E., et al. 2015b, MNRAS, 453, 1223
- Intema et al. (2017) Intema, H. T., Jagannathan, P., Mooley, K. P., & Frail, D. A. 2017, A&A, 598, A78
- Jetha et al. (2007) Jetha, N. N., Ponman, T. J., Hardcastle, M. J., & Croston, J. H. 2007, MNRAS, 376, 193
- Jones et al. (2004) Jones, D. H., Saunders, W., Colless, M., et al. 2004, MNRAS, 355, 747
- Jørgensen & Chiboucas (2013) Jørgensen, I., & Chiboucas, K. 2013, AJ, 145, 77
- Kale et al. (2015) Kale, R., Venturi, T., Cassano, R., et al. 2015, A&A, 581, A23
- Kennicutt (1998) Kennicutt, Jr., R. C. 1998, ARA&A, 36, 189
- Komatsu et al. (2011) Komatsu, E., Smith, K. M., Dunkley, J., et al. 2011, ApJS, 192, 18
- Lau et al. (2017) Lau, E. T., Gaspari, M., Nagai, D., & Coppi, P. 2017, ApJ, 849, 54
- Lauer et al. (2014) Lauer, T. R., Postman, M., Strauss, M. A., Graves, G. J., & Chisari, N. E. 2014, ApJ, 797, 82
- Lemze et al. (2013) Lemze, D., Postman, M., Genel, S., et al. 2013, ApJ, 776, 91
- Lin & Mohr (2007) Lin, Y.-T., & Mohr, J. J. 2007, ApJS, 170, 71
- McDonald et al. (2017) McDonald, M., Allen, S. W., Bayliss, M., et al. 2017, ApJ, 843, 28
- McNamara et al. (2000) McNamara, B. R., Wise, M., Nulsen, P. E. J., et al. 2000, ApJ, 534, L135
- Mittal et al. (2009) Mittal, R., Hudson, D. S., Reiprich, T. H., & Clarke, T. 2009, A&A, 501, 835
- Mohan & Rafferty (2015) Mohan, N., & Rafferty, D. 2015, PyBDSM: Python Blob Detection and Source Measurement, Astrophysics Source Code Library, ascl:1502.007
- Molendi et al. (2016) Molendi, S., Tozzi, P., Gaspari, M., et al. 2016, A&A, 595, A123
- O’Sullivan et al. (2011) O’Sullivan, E., Giacintucci, S., David, L. P., et al. 2011, ApJ, 735, 11
- Peterson & Fabian (2006) Peterson, J. R., & Fabian, A. C. 2006, Phys. Rep., 427, 1
- Postman et al. (2012) Postman, M., Coe, D., Benítez, N., et al. 2012, ApJS, 199, 25
- Rafferty et al. (2008) Rafferty, D. A., McNamara, B. R., & Nulsen, P. E. J. 2008, ApJ, 687, 899
- Rengelink et al. (1997) Rengelink, R. B., Tang, Y., de Bruyn, A. G., et al. 1997, A&AS, 124, doi:10.1051/aas:1997358
- Repp & Ebeling (2017) Repp, A., & Ebeling, H. 2017, ArXiv e-prints, arXiv:1706.01263
- Rines et al. (2013) Rines, K., Geller, M. J., Diaferio, A., & Kurtz, M. J. 2013, ApJ, 767, 15
- Robitaille & Bressert (2012) Robitaille, T., & Bressert, E. 2012, APLpy: Astronomical Plotting Library in Python, Astrophysics Source Code Library, ascl:1208.017
- Russell et al. (2013) Russell, H. R., McNamara, B. R., Edge, A. C., et al. 2013, MNRAS, 432, 530
- Sakelliou et al. (2008) Sakelliou, I., Hardcastle, M. J., & Jetha, N. N. 2008, MNRAS, 384, 87
- Sanders & Fabian (2007) Sanders, J. S., & Fabian, A. C. 2007, MNRAS, 381, 1381
- Sanders et al. (2009) Sanders, J. S., Fabian, A. C., & Taylor, G. B. 2009, MNRAS, 396, 1449
- Sanderson et al. (2009) Sanderson, A. J. R., Edge, A. C., & Smith, G. P. 2009, MNRAS, 398, 1698
- Santos et al. (2010) Santos, J. S., Tozzi, P., Rosati, P., & Böhringer, H. 2010, A&A, 521, A64
- Santos et al. (2016) Santos, J. S., Balestra, I., Tozzi, P., et al. 2016, MNRAS, 456, L99
- Sayers et al. (2013) Sayers, J., Mroczkowski, T., Czakon, N. G., et al. 2013, ApJ, 764, 152
- Shin et al. (2016) Shin, J., Woo, J.-H., & Mulchaey, J. S. 2016, ApJS, 227, 31
- Skrutskie et al. (2006) Skrutskie, M. F., Cutri, R. M., Stiening, R., et al. 2006, AJ, 131, 1163
- Stern et al. (2010) Stern, D., Jimenez, R., Verde, L., Stanford, S. A., & Kamionkowski, M. 2010, ApJS, 188, 280
- Stott et al. (2008) Stott, J. P., Edge, A. C., Smith, G. P., Swinbank, A. M., & Ebeling, H. 2008, MNRAS, 384, 1502
- Sun (2009) Sun, M. 2009, ApJ, 704, 1586
- van Weeren et al. (2017) van Weeren, R. J., Ogrean, G. A., Jones, C., et al. 2017, ApJ, 835, 197
- Voit et al. (2015) Voit, G. M., Donahue, M., Bryan, G. L., & McDonald, M. 2015, Nature, 519, 203
- Wise et al. (2007) Wise, M. W., McNamara, B. R., Nulsen, P. E. J., Houck, J. C., & David, L. P. 2007, ApJ, 659, 1153
- Wold et al. (2012) Wold, I. G. B., Owen, F. N., Wang, W.-H., Barger, A. J., & Keenan, R. C. 2012, ApJS, 202, 2
- Wright et al. (2010) Wright, E. L., Eisenhardt, P. R. M., Mainzer, A. K., et al. 2010, AJ, 140, 1868
- York et al. (2000) York, D. G., Adelman, J., Anderson, Jr., J. E., et al. 2000, AJ, 120, 1579
Appendix A Spectral energy distribution
In this Appendix we show the radio SED of our BCGs including all the flux density values published in the literature in the 150 MHz-30 GHz range, complementing the 1.5 GHz JVLA measurements presented in this work. We show the comparison of our 1.5 and 30 GHz ratio to the slope of the best-fit power law including all the flux measurements. We do not aim at a comprehensive description of the radio SEDs, given the uneven frequency sampling of the different sources and the lack of a uniform angular resolution at different frequencies. Our goal here is simply to show the level of accuracy of our spectral index as a proxy of the average spectral slope. In Figure 10 we show the radio SEDs of BCGs observed with our JVLA program, while in Figure 11 we show the radio SEDs of BCGs with FIRST or NVSS detection only. Only BCGs with a measured are shown.