Molecular gas in three quasar host galaxies
Abstract
We present ALMA band 3 observations of the CO(6–5), CO(7–6), and [C I] 369 m emission lines in three of the highest redshift quasar host galaxies at . These measurements constitute the highest-redshift CO detections to date. The target quasars have previously been detected in [C II] 158 m emission and the underlying FIR dust continuum. We detect (spatially unresolved, at a resolution of 2″, or 14 kpc) CO emission in all three quasar hosts. In two sources, we detect the continuum emission around 400 m (rest-frame), and in one source we detect [C I] at low significance. We derive molecular gas reservoirs of (1–3)1010 in the quasar hosts, i.e. approximately only 10 times the mass of their central supermassive black holes. The extrapolated [C II]-to–CO(1–0) luminosity ratio is 2500–4200, consistent with measurements in galaxies at lower redshift. The detection of the [C I] line in one quasar host galaxy and the limit on the [C I] emission in the other two hosts enables a first characterization of the physical properties of the interstellar medium in quasar hosts. In the sources, the derived global CO/[C II]/[C I] line ratios are consistent with expectations from photodissociation regions (PDR), but not X–ray dominated regions (XDR). This suggest that quantities derived from the molecular gas and dust emission are related to ongoing star-formation activity in the quasar hosts, providing further evidence that the quasar hosts studied here harbor intense starbursts in addition to their active nucleus.
1 Introduction
Quasars are the most luminous, non-transient objects in the universe, and can be observed out to very high redshift (e.g., Fan et al., 2006; Mortlock et al., 2011; Venemans et al., 2013; Bañados et al., 2016). In the case of quasars at (age of the Universe: 1 Gyr), optical and near-infrared (NIR) observations trace the (rest-frame) UV emission of the quasars. These observations reveal that the quasars host supermassive black holes with masses exceeding in many cases (e.g., Jiang et al., 2007; Kurk et al., 2007; De Rosa et al., 2011, 2014; Wu et al., 2015; Venemans et al., 2015). Likewise, observations in the (sub-)mm regime have the potential to trace the rest-frame far-infrared (FIR) emission in the quasar host, as well as key diagnostic lines of their interstellar medium (ISM, see, e.g., Carilli & Walter, 2013).
Initial studies of the galaxies that host luminous quasars at unveiled that roughly 30% of quasars hosts were bright at mm wavelengths ( mJy), implying FIR luminosities and star-formation rates (SFR) possibly exceeding 1000 yr-1 (e.g., Bertoldi et al., 2003a; Wang et al., 2007, 2008, 2016). Follow-up studies of these FIR-bright quasar hosts targeting the redshifted CO emission line revealed that these galaxies have large reservoirs of cold molecular gas (e.g., Walter et al., 2003; Bertoldi et al., 2003b; Carilli et al., 2007; Wang et al., 2010, 2011a, 2011b, 2016). These early studies of the host galaxies of quasars by nature concentrated on the FIR-bright quasars, and the results from these studies may introduce a biased view on the characteristics of the typical galaxy hosting a quasar. This is supported by studies of lower luminosity quasars, powered by black holes with a mass of ‘only’ , that reveal hosts with significantly fainter FIR luminosities of and SFRs of SFR yr-1 (Willott et al., 2013, 2015).
To extend the study of quasar host galaxies to we initiated a program targeting all quasars discovered at in [C II] line emission and the underlying continuum, independent of their FIR brightness, with the aim of sampling the range of properties of quasar host galaxies and to investigate the star formation – supermassive black hole growth relation at . The first quasar targeted in this project, J1120+0641 at , already displayed a somewhat different characteristics in its FIR properties (a fainter FIR luminosity of and a more compact, 1 kpc host galaxy; Venemans et al., 2012, 2017) from the well-studied quasar hosts. Subsequent imaging of the FIR continuum and the [C II] 158 m emission line of additional quasars showed a range of properties with FIR luminosities from to (Bañados et al., 2015; Venemans et al., 2016, 2017; Decarli et al., 2017, Mazzucchelli et al. in prep).
So far, our sample of quasar hosts have primarily been observed at 1 mm targeting the [C II] line and the underlying FIR continuum at 160m in the rest-frame. To further study the characteristics of the interstellar medium (ISM) in quasar host galaxies, it is imperative to detect the FIR continuum of these galaxies at different frequencies and to observe additional molecular or atomic lines. In this paper, we present ALMA Cycle 2 observations of the CO(6–5), CO(7–6), and [C I](2–1) 369 m (hereafter [C I]) emission line and the underlying dust continuum in three quasar host galaxies at . These quasar host galaxies are VIKING J030516.92–315056.0 (hereafter J0305–3150) at , VIKING J010953.13–304726.3 (hereafter J0109–3040) at , and VIKING J234833.34–305410.0 (hereafter J2348–3054) at , discovered in Venemans et al. (2013). At the time of discovery these three sources were the only quasars known at besides J1120+0641 at (Mortlock et al., 2011). The absolute magnitudes at 1450 Å in the rest-frame of these VIKING quasars are between –26.0 and –25.5, which is 1.4–1.9 mag fainter than PSO J036.5078+03.0498 at , the most luminous quasar currently known (Venemans et al., 2015) and 0.6 mag brighter than the faint quasar J1205–0000 at discovered with the Subaru Hyper Suprime-Cam (Matsuoka et al., 2016). The VIKING quasars are powered by black holes with masses of (Venemans et al., 2013; De Rosa et al., 2014). These black hole masses are comparable to those of other quasars (e.g., Mortlock et al., 2011; De Rosa et al., 2014; Venemans et al., 2015, Mazzucchelli et al. in prep). The three VIKING quasars were previously observed with ALMA in Cycle 1 at 1 mm targeting the redshifted [C II] emission line (presented in Venemans et al., 2016). All three quasar host galaxies were detected with [C II] luminosities ranging between and continuum luminosities at a rest-frame wavelength of 158 m of m erg s-1 (see Table 1). The additional CO and [C I] observations presented here, as well as the measurement of the underlying dust continuum emission at observed wavelengths around 3 mm (rest-frame wavelength around 400 m), allow us, for the first time, to constrain the physical properties of quasar host galaxies at in more detail.
The paper is organized as follows. In Section 2 a description of the ALMA Cycle 2 observations is given. In Section 3 we present our results: in Sections 3.1–3.3 we provide the derived properties for each of the three sources. In Section 4 we discuss our results: in Section 4.1 we compare the dust continuum measurements made at 3 mm (observed) with those at 1 mm to constrain the shape of the dust spectral energy distribution and in Sections 4.2 and 4.3 we estimate the molecular gas and atomic carbon mass from the detected emission lines. In Section 4.4 we provide constraints on the properties of the interstellar medium (ISM), followed by a summary in Section 5.
Throughout this paper, we adopt a concordance cosmology with parameters: km s-1 Mpc-1, , and .
2 ALMA OBSERVATIONS
The three quasar host galaxies were observed in ALMA band-3 with 39–40 antennas in a compact configuration (baselines between 15 and 349 m) between 2014 December 29 and 2015 January 6. A summary of the observations is given in Table 1. On 2014 December 29 J0109–3047 was observed for 47 min (24 min on-source), on 2014 December 30 observations of J2348–3054 were carried out for 60 min of which 34 min on-source, and on 2015 January 6 the host galaxy of J0305–3150 was observed for 31 min (16 min on-source). Our setup consisted of two pairs of two spectral windows, with each spectral window covering a frequency range of 1.875 GHz at a resolution of 3.9 MHz (11–13 km s-1). The two pairs of spectral windows are placed in sidebands that are separated by 12 GHz. By fortuitous coincidence the frequency range that can be covered in this setup allows us to image two CO lines simultaneously for sources at .
For all three quasar hosts the setup was tuned to include the CO(6–5) line in one of the four sidebands and the CO(7–6) and [C I] lines in another sideband, using the redshift from the previous [C II] observations. The two remaining spectral windows were placed between the CO(6–5) and CO(7–6) lines and utilized to increase the signal-to-noise of the continuum measurement. The beam size of 2″ (12 kpc) ensured that the emission was likely unresolved by the ALMA observations as the maximum extent of the [C II] emission in these sources is 06 (Venemans et al., 2016). For bandpass calibration, the sources J2258–2758, J2357–5311, and J0519–4546 were observed, respectively. The amplitude and flux calibration was performed through observations of the source J0334–401 and Mars, and the calibrators J2359–3133, J0120–2701, and J0334–4008, respectively, were observed every 7 minutes for phase calibration. The raw data were reduced following standard reduction steps in the Common Astronomy Software Applications package (CASA; McMullin et al., 2007). The reduced cubes were cleaned with a weighting factor of robust = 2 (equivalent to natural weighting) to obtain the lowest noise maps. The rms noise per 100 MHz bins averaged between 0.10 mJy and 0.24 mJy (Table 1).
| J0305–3150 | J0109–3047 | J2348–3054 | |
| R.A. (J2000) | 03h05m16.91 | 01h09m53.13 | 23h48m33.35 |
| Decl. (J2000) | –31∘50′5594 | –30∘47′2632 | –30∘54′1030 |
| 6.61450.0001 | 6.79090.0004 | 6.90180.0007 | |
| () | |||
| FWHM[CII] (km s-1) | 25512 | 34034 | 40569 |
| ()aa and derived from the continuum detection at 1 mm, taken from Venemans et al. (2016). | |||
| ()aa and derived from the continuum detection at 1 mm, taken from Venemans et al. (2016). | |||
| (GHz) | 90.6–94.4, 102.6–106.5 | 88.4–92.2, 100.4–104.2 | 87.0–90.8, 99.0–102.9 |
| (min) | 16 | 24 | 34 |
| # of antennas | 39 | 40 | 39 |
| RMS noise (per 100 MHz) | 242 Jy | 121 Jy | 102 Jy |
| beam size | 53 22 | 42 25 | 38 23 |
| CO(6–5) flux (Jy km s-1) | |||
| () | |||
| (K km s-1 pc2) | |||
| CO(7–6) flux (Jy km s-1) | |||
| () | |||
| (K km s-1 pc2) | |||
| [C I](2–1) flux (Jy km s-1) | |||
| () | |||
| (K km s-1 pc2) | |||
| (Jy) | |||
| bbA CO excitation ladder similar to that of the quasar J1148+5251 is assumed (see Section 4.2). (K km s-1 pc2) | |||
| /bbA CO excitation ladder similar to that of the quasar J1148+5251 is assumed (see Section 4.2). | 2530130 | 4170350 | 2860450 |
| ()ccMolecular gas mass derived from the CO(1–0) luminosity, assuming a luminosity-to-gas mass conversion factor of (K km s-1 pc2)-1. | |||
| ()ddMolecular gas mass derived from the dust mass, assuming a gas-to-dust mass ratio of 70–100 and a molecular gas mass fraction of 0.75 (see Section 4.2). | |||
| ()eeAssuming an excitation temperature of K (see Section 4.3). |
3 CO and [C I] Spectra
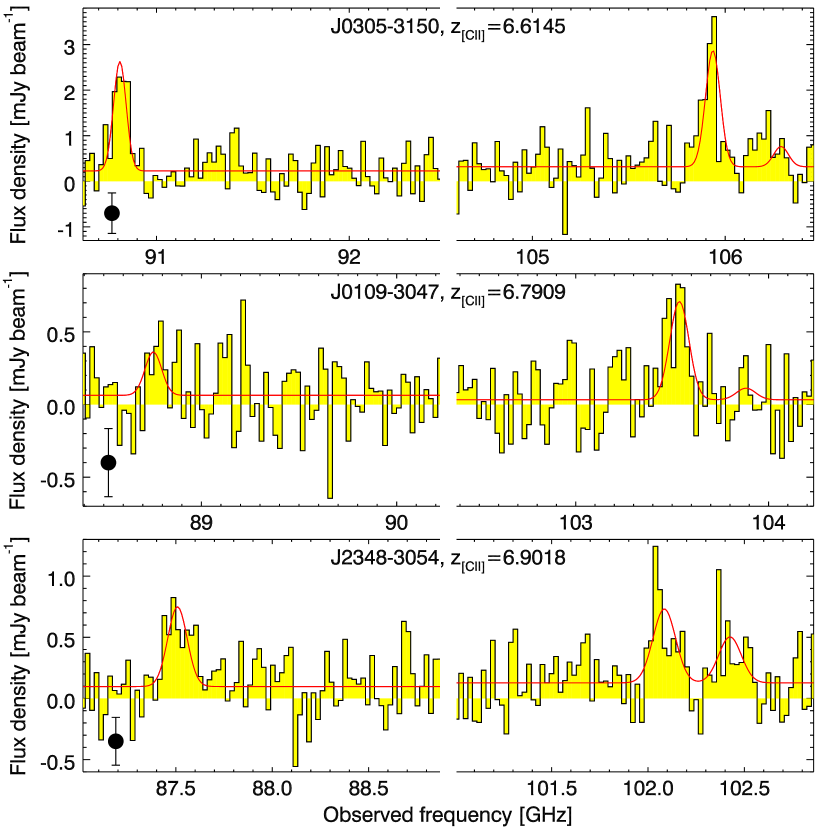
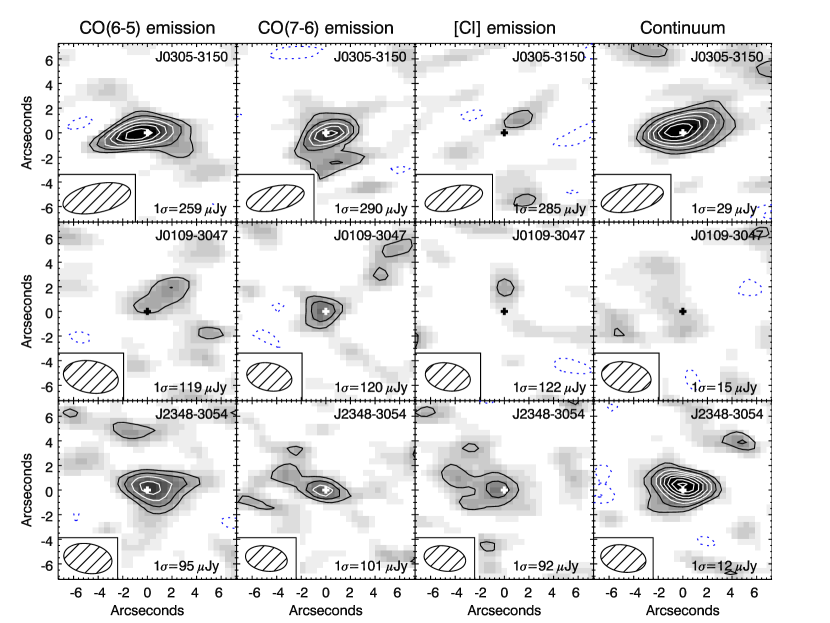
In Figure 1 we show the CO and [C I] spectra of the quasar hosts extracted at the position of the center of the [C II] emission. We fitted a Gaussian function to the lines, fixing the redshift and the width of the lines to those from the significantly higher signal-to-noise (S/N) [C II] line (Venemans et al., 2016). In Figure 2 we averaged the data at the redshift given by the [C II] line over the width of the [C II] line. Channels not belonging to emission lines were averaged to create continuum maps. Below we will describe the results for each of the sources individually.
3.1 J0305–3150 ()
The host galaxy of quasar J0305–3150 shows the brightest [C II] line of the three VIKING quasars presented in Venemans et al. (2016). The [C II] line was detected at a redshift of with a strength of Jy km s-1 and a width of FWHM = km s-1. Fitting a Gaussian with a FWHM of 255 km s-1 centered on the (redshifted) frequency of the CO(6–5) emission line () to the spectrum (Figure 1) resulted in 8 detection (Figure 2) of the CO(6–5) line with a strength of Jy km s-1 and a luminosity of . Allowing the width and center of the Gaussian to vary gives very similar parameters: , FWHM km s-1, and Jy km s-1.
The CO(7–6) emission line was detected at 6 with , FWHM km s-1, and Jy km s-1. Forcing the line to have the same width and redshift as the [C II] line results in a similar line strength as above of Jy km s-1 and a CO(7–6) luminosity of . The width, redshift, and spatial location of the CO(6–5) and CO(7–6) emission are, within the uncertainties, consistent with those of the [C II] line. This indicates that gas components traced by the [C II] and CO emission have, on average, similar kinematics.
The measured CO fluxes of Jy km s-1 and Jy km s-1 make the host of J0305–3150 roughly as bright as the archetypical, luminous SDSS quasar J1148+5251 (which has Jy km s-1 and Jy km s-1, Walter et al. 2003; Bertoldi et al. 2003b; Riechers et al. 2009).
The [C I] emission line has not been significantly detected in both the spectrum and the line map (Figures 1 and 2). At the position and redshift of the [C II] emission we measure a 3 upper limit to the line flux of Jy km s-1 ( )
Averaging the frequency channels not covered by emission lines resulted in a significant, 8 detection of the continuum at an observed frequency of 98.4 GHz (rest-frame frequency of 749 GHz, rest-frame wavelength of 400 m) of Jy. We will discuss the implications of this detection further in Section 4.1.
3.2 J0109–3047 ()
The host galaxy of quasar J0109–3047 was detected in [C II] with , Jy km s-1, and a width of FWHM (Venemans et al., 2016). The continuum of the host was the faintest of the three quasars considered here with mJy at 158 m in the rest-frame.
The CO(6–5) line is only marginally detected in this quasar host with a S/N2.3 (Figures 1 and 2). From a fit to the spectrum, we derive a line flux of Jy km s-1 and a luminosity of . In contrast, the CO(7–6) line was detected with a S/N at the same spatial position as the [C II] line in the line map (Figure 2). Fitting a Gaussian to the spectrum while fixing the width and redshift to that of the [C II] line gives a line strength of Jy km s-1( ). We do not detect the [C I] line and place 3 limits on the line flux of Jy km s-1 ( ).
The host galaxy of J0109–3047 was not detected in the 3 mm continuum image (Figure 2). At the position of the quasar host galaxy we measure a continuum flux density of Jy (corresponding to a rest-frame frequency of 750 GHz). The 3 upper limit for the continuum flux density is 46 Jy.
3.3 J2348–3054 ()
J2348–3054 is the highest redshift quasar in our sample with . It has the faintest [C II] line of our three observed quasars with Jy km s-1, and FWHM km s-1 (Venemans et al., 2016).
Both the CO(6–5) and CO(7–6) lines are detected at S/N5 in the ALMA band 3 data (Figures 1 and 2). The line fluxes measured from the spectrum, using the [C II] redshift and line width, are Jy km s-1 and Jy km s-1. This corresponds to line luminosities of and which is very similar to the CO(7–6) luminosity of J0109–3047.
Intriguingly, the [C I] line in J2348–3054 was also detected albeit with a low significance (S/N3). Both in frequency (Figure 1) and spatially (Figure 2) the [C I] emission coincides with the expectations from the [C II] emission line. We derive a line flux of Jy km s-1 and a luminosity of from the spectrum. We will discuss the implications of the detection of this line in Section 4.3.
The continuum of J2348–3054 was also detected (Figure 2) with Jy (S/N9).
4 DISCUSSION
4.1 Constraints on the Dust Emission
Analysis of the far-infrared emission in luminous, high redshift () quasars revealed that the dust in these objects has typical temperatures between 40 K and 60 K with a mean of K (e.g., Priddey & McMahon, 2001; Beelen et al., 2006; Leipski et al., 2014). A dust temperature of K has subsequently often been assumed for studies of the cold dust emission of quasar hosts (e.g., Willott et al., 2013, 2015; Wang et al., 2013; Bañados et al., 2015; Venemans et al., 2016). In this section we combine the continuum measurements from our ALMA 1 mm data (presented in Venemans et al. 2016) with the continuum detections in the 3 mm data presented here to test whether the dust temperature is consistent with the canonical value. The addition of a continuum point at 3 mm significantly increases the baseline over which we can constrain the dust SED. However, both our continuum points are on the Rayleigh-Jeans tail of the dust emission and we cannot tightly constrain the dust temperature at these relatively long wavelengths. Furthermore, we need to make assumptions about the properties of the dust. Following the literature, we here assume that the dust emission can be described by a modified black body with a dust temperature and a power-law emissivity index (e.g., Priddey & McMahon, 2001; Venemans et al., 2016). With only two continuum detections (at 1 mm and 3 mm), we cannot constrain and at the same time. In the following discussion, we will assume two different values of from the literature: (Beelen et al., 2006) and (Priddey & McMahon, 2001).
As discussed in Venemans et al. (2016), it is important to take the effects of the CMB into account, which has a temperature of K at . The CMB provides both an additional source of heating and a background that reduces the detectability of the emission from the quasar hosts, see da Cunha et al. (2013) for an extensive discussion on these effects. While the heating by the CMB is negligible for our sources if the dust temperature is K, the CMB can significantly reduce the flux density we measure from a source at high redshift, especially at the low frequencies:
| (1) |
with the Planck function at rest-frame frequency (da Cunha et al., 2013). I.e., with a dust temperature of K and a redshift of , we are only measuring 75% and 50% of the intrinsic flux density at rest-frame wavelengths of 158 m and 400 m, respectively.
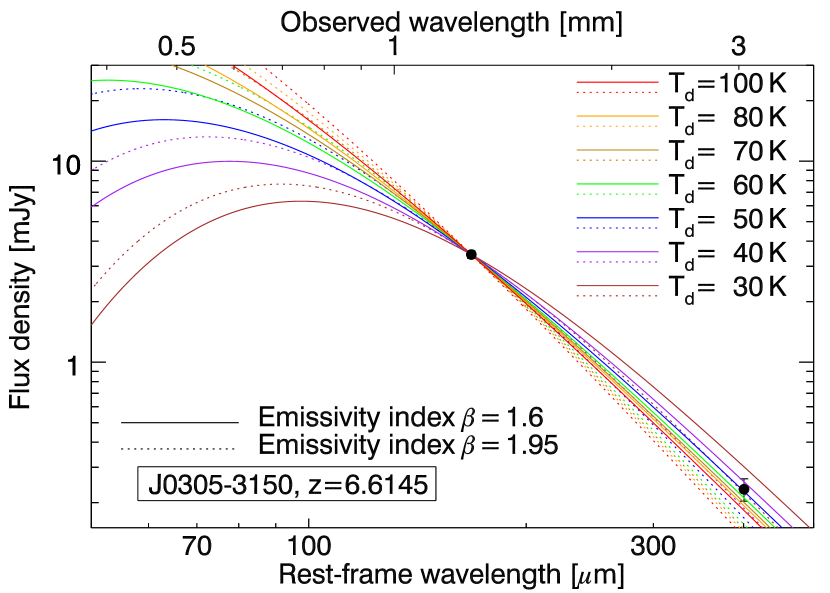
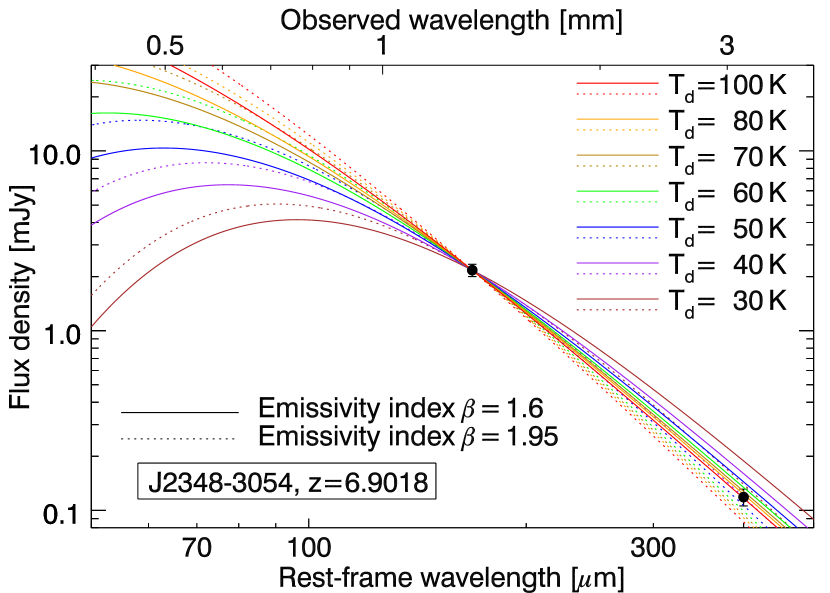
To compare the continuum flux densities at 1 mm with those measured at 3 mm, we first averaged the line-free sidebands at 1 mm and subsequently convolved the resulting image to the same resolution as the 3 mm data. For J0305–3150 we measure mJy. The observed flux ratio in the two ALMA bands is thus . This is very similar to the ratio of measured in the well-studied quasar host J1148+5251 at (Riechers et al., 2009; Gallerani et al., 2014). For J2348–3054 we measure mJy and .
In Figure 3 we show the continuum detections of the host galaxies of J0305–3150 and J2348–3054. We fitted a modified black body to the data points, taking into account the effects of the CMB described above, with a fixed redshift of and respectively and two different dust emissivity indices of and . We added an uncertainty of 10% in quadrature to account for the absolute flux calibration uncertainty. We derive a dust temperature of K ( K) assuming a () for J0305–3150 and K ( K) for J2348–3054. Within the large uncertainties, these values are consistent with the canonical values of K. If instead we fix the dust temperature to K, we derive values for the dust emissivity index of for J0305–3150 and for J2348–3047. As is demonstrated in Figure 3, our observed continuum flux densities at 1 mm and 3 mm do not pose tight constraints on the dust temperature and emissivity index. To better constrain the dust temperature, we need to measure the dust continuum at rest-frame wavelengths 100 m in these quasar hosts. This is feasible with, for example, ALMA band 8 and 9 observations.
The 3 mm continuum was not detected in the host galaxy of quasar J0109–3047, and we therefore could not constrain the dust temperature in this source. By taking the 3 upper limit of mJy, we derived a lower limit on the dust temperature of K. For a dust temperature of K and , we expect, based on the continuum detection at 1 mm, a 3 mm continuum flux density of Jy, which is consistent with our observed limits.
In the remainder of this paper, we will use the FIR luminosities derived from the continuum detection at 1 mm by Venemans et al. (2016). These values are listed in Table 1. The FIR luminosity is obtained by assuming K and , while the error bar includes both the measurement error and the uncertain shape of FIR continuum. The latter is determined by scaling model templates of local star-forming galaxies to the continuum detection, see Venemans et al. (2016) for details.
4.2 Molecular Gas Mass Derived from CO
The mass of the molecular (mostly H2) gas can be estimated using the equation with the molecular gas mass, the CO luminosity-to-gas mass conversion factor, and the CO(1–0) luminosity in units of K km s-1 pc2. The luminosity of an emission line can be derived by
| (2) | |||||
with and the rest-frame and observed frequency of the emission line in GHz, the luminosity distance in Mpc and the line flux in Jy km s-1 (e.g., Carilli & Walter, 2013). Following the literature, we further assume a value of (K km s-1 pc2)-1, derived for local ultra-luminous infrared galaxies (ULIRGs; e.g., Downes & Solomon, 1998). This value is also used to compute molecular gas masses in quasar host galaxies (e.g., Wang et al., 2010).
Since we only measured the CO(6–5) and/or CO(7–6) line flux in our sources, we have to assume a CO spectral line energy distribution (CO SLED) to estimate the CO(1–0) line strength. The CO emission of distant quasars peaks around that of CO(6–5) and CO(7–6) (e.g., Riechers et al., 2009; Carilli & Walter, 2013). To estimate CO(1–0) luminosity in our sources, we here apply the same model that fits the strength of the CO lines of the quasar host galaxy J1148+5251 at (Riechers et al., 2009; Stefan et al., 2015). In J1148+5251 several low-J and high-J CO lines have been detected, including the CO(2–1), CO(3–2), CO(6–5), and CO(7–6) lines (Bertoldi et al., 2003b; Walter et al., 2003; Riechers et al., 2009; Stefan et al., 2015). The large velocity gradient (LVG) model by Riechers et al. (2009) that fits the observed CO line fluxes in J1148+5251 results in observed CO(6–5) and CO(7–6) line fluxes that are of roughly equal strength, , and line flux ratios of and . Following Equation (2), the CO luminosity ratios of the LVG model are and . Note that in the two cases where we detect both CO(6–5) and CO(7–6) lines, the ratio is indeed close to 1 (Table 1): and for J0305–3150 and J2348–3054, respectively.
Using Equation (2), we derive CO(6–5) and CO(7–6) luminosities in our quasar hosts of K km s-1 pc2 and K km s-1 pc2 (see Table 1). Assuming the CO excitation ladder in the VIKING quasar hosts can be described with the one derived for J1148+5251, we can obtain luminosities by applying the / and / luminosity ratios given by the LVG model. For J0305–3150 and J2348–3054, where we detect both CO(6–5) and CO(7–6) lines at S/N , we take the weighted mean of the two estimated CO(1–0) luminosities. For J0109–3047 we only consider the CO(7–6) line as the CO(6–5) line has a low significance (Figures 1 and 2). The CO(1–0) luminosities we derive for the quasar hosts are , , and K km s-1 pc2.
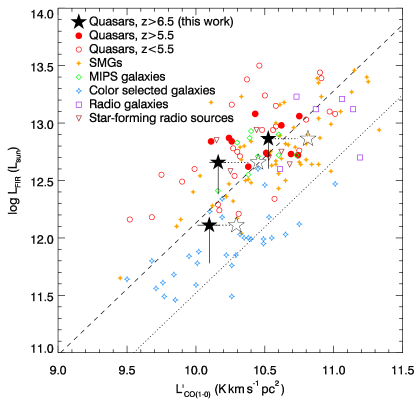
The [C II]/CO(1–0) luminosity ratios derived for three quasar hosts range from 2500 to 4200. These values are within a factor of 2 of the ratio of / measured in local starburst galaxies and star forming regions in the Milky Way (e.g., Stacey et al., 1991) and in dusty star-forming galaxies at (e.g., Gullberg et al., 2015). In Figure 4 we plot the FIR luminosity against CO(1–0) luminosity of our quasar hosts. The CO and FIR luminosities of J0305–3150 and J2348–3054 are very similar to those in quasar host galaxies (e.g., Wang et al., 2010, 2011a, 2011b). The host galaxies discussed here have CO(1–0) over FIR luminosity ratios consistent with those of starburst galaxies at (e.g., Daddi et al., 2010; Genzel et al., 2010), see Figure 4.
Based on the derived CO(1–0) luminosities, we estimate that the quasar host galaxies contain a molecular gas mass of (J0305–3150), (J0109–3047), and (J2348–3054, see Table 1). We can compare these gas masses with the dynamical mass derived from the [C II] emission line for these quasar host galaxies in Venemans et al. (2016). For J0109–3047 and J2348–3054 the dynamical masses are and , and roughly 4%–39% of that dynamical mass is comprised of molecular gas. Assuming dark matter does not significantly contribute to the mass in the centre of these galaxies (e.g., Genzel et al., 2017), this suggests that these host galaxies contain a large stellar mass of (at most) , which is at the high end of the stellar mass function derived for star-forming galaxies at similar redshifts (e.g., Bowler et al., 2014; Grazian et al., 2015; Stefanon et al., 2015). On the other hand, in J0305–3150 as much as 54–81% of the dynamical mass of comprises of molecular gas, which implies a smaller stellar mass of . However, the large uncertainties in the derived molecular gas mass and in the dynamical mass prevents us from putting tight constraints in the stellar mass in these quasar hosts.
It should be noted that the uncertainties quoted in this section only include the uncertainties in the measured high- CO line fluxes and not the uncertainty in the shape of the CO excitation ladder. For example, if we adopt the observed CO SLED of quasars for which high and low CO lines have been measured from Carilli & Walter (2013), who find luminosity ratios of / and /, then the estimated CO(1–0) luminosities (and molecular gas masses) are 57–95% higher compared to the luminosities derived using the J1148+5251 CO SLED (see Figure 4). A future measurement of a low- CO line with the Jansky Very Large Array is essential to obtain a more accurate estimate of the CO(1–0) luminosity in our quasar hosts.
We can verify our CO-based molecular gas mass by computing the gas mass from the amount of dust in the host galaxies presented in Venemans et al. (2016). The quasar hosts have estimated dust masses of , , and , which we can use to derive gas masses by assuming the local gas-to-dust mass ratio of 70–100 (e.g., Draine et al., 2007; Sandstrom et al., 2013). Similar gas-to-dust mass ratios of 70 have also been found in starburst systems at high redshift (e.g., Riechers et al., 2013; Wang et al., 2016). Using the local gas-to-dust mass ratio, we obtain (atomic and molecular) gas masses of , , and , for J0305–3150, J0109–3047, and J2348–3054, respectively. If we further assume that 75% of the dust-derived gas mass is molecular (e.g., Riechers et al., 2013; Wang et al., 2016), then for J0305–3150 and J0109–3047 the lower values of the dust-derived gas mass agree with the CO-based molecular gas mass. For J2348–3054 the dust mass predicts a higher gas mass.
4.3 Atomic Carbon Mass
We can make use of the [C I] line luminosity (or limits thereof) to calculate the mass of atomic carbon in the quasar host galaxies. If we assume that the [C I] emission is optically thin, then we can use the relation between [C I] brightness and the mass in neutral carbon given by Weiß et al. (2003, 2005):
| (3) |
where is the C I partition function and K and K are the energies above the ground state. Following the literature, we set the excitation temperature to K (see, e.g. Walter et al., 2011). Note that if we assume a higher excitation temperature of K, the derived would be 38% lower.
For the host galaxy of J2348–3054, in which we tentatively detect the [C I] emission line, we derive a neutral carbon mass of . The atomic Carbon abundance, relative to H2 is given by X[C I] = ). For a sample of , FIR-bright sources, Walter et al. (2011) derived a carbon abundance of X[C I] . Applying this abundance we obtain an independent molecular gas mass in J2348–3054 of , which is consistent with the molecular gas mass of derived from the CO observations in Section 4.2.
For the other two sources, J0109–3047 and J0305–3150, we can only obtain 3 upper limits of and (Table 1). The upper limits we obtain for the molecular gas mass assuming the neutral carbon abundance from Walter et al. (2011) of (J0109–3047) and (J0305–3150) agree well with our molecular gas masses inferred from the CO luminosities.
4.4 The Characteristics of the ISM
With the detection of various FIR lines in our quasar host galaxies, we can start to constrain the physical properties of the ISM in these high redshift galaxies by comparing the luminosity of the emission lines with each other and with the continuum. The observed lines can arise due to star formation in photodissociation regions (PDRs) where the radiation field is dominated by UV photons from young stars, or in X–ray dominated regions (XDRs), where the X–ray radiation from the accreting black hole dominates the emission (or a combination thereof). Alternatively, a substantial fraction of the [C II] emission could be associated with the diffuse ionized medium. However, observations of local starburst galaxies suggest that only up to 30% of the [C II] emission could be emitted by the diffuse ionized medium (e.g., Carral et al., 1994; Lord et al., 1996; Colbert et al., 1999). Similarly, studies of high redshift, FIR luminous sources have concluded that, based on high observed [C II]/[N II] line ratios, at most a small fraction of the [C II] emission comes from the ionized phase of the gas (e.g., Decarli et al., 2014; Pavesi et al., 2016). In the remainder of this section, we will assume that the majority of the [C II] emission comes from the same region as the CO and [C I] emission.
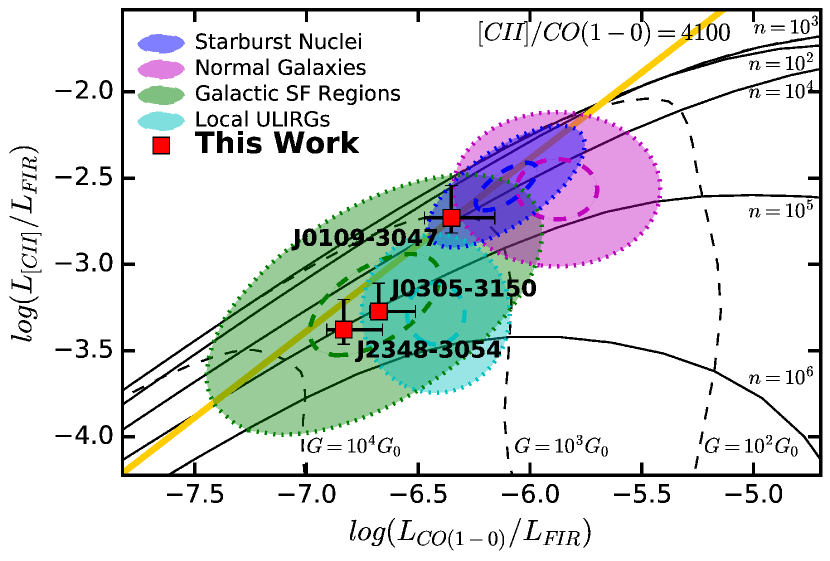
An initial diagnostic plot to test the nature of the emission in our sources is shown in Figure 5, where we plot the luminosity ratio [C II]/FIR as function of CO(1–0)/FIR. Regions occupied by different galaxies in the nearby universe are shown as well as the typical [C II]/CO(1–0) ratio of / (Section 4.2). Additionally, contours for UV field strength and gas density are shown for PDR models from Kaufman et al. (1999). These contours show the phase space where PDRs can describe the observed emission line ratios. Sources falling to the upper left, above the typical [C II]/CO(1–0) ratio of 4100, would require a non-PDR emission mechanism such as XDRs to explain the observed lines and continuum. All three of our quasar host galaxies fall in the phase space that can be described by PDRs and are similar to local starbursts and ULIRGs.
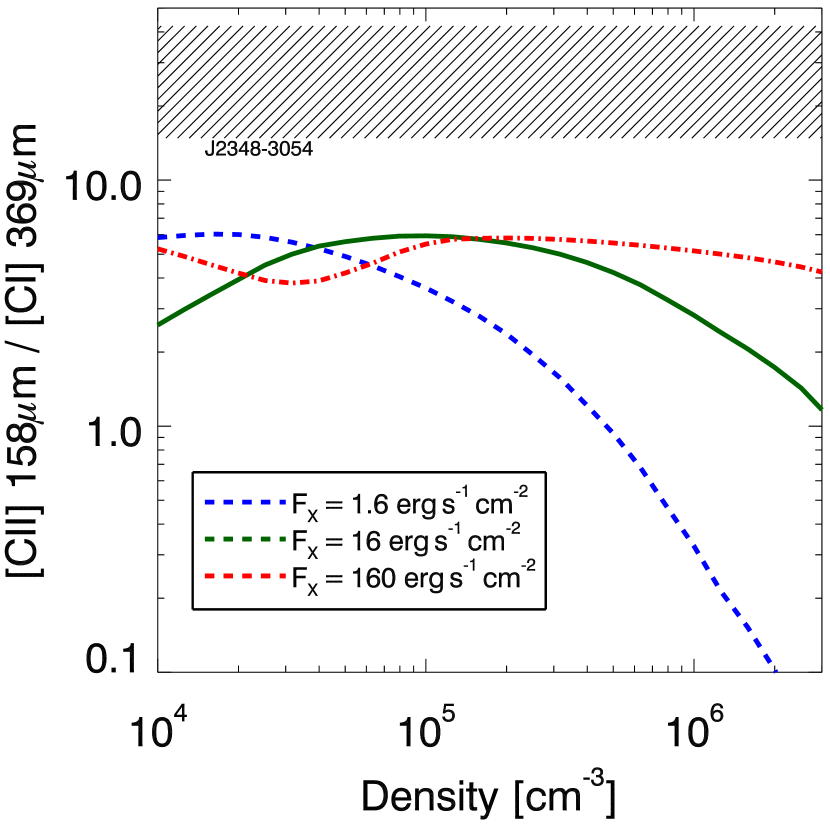
The results from the diagnostic shown in Figure 5 can be confirmed, and ISM properties can be derived by applying the PDR and XDR models from Meijerink & Spaans (2005) and Meijerink et al. (2007). In these models the [C II]/CO(7–6) and [C II]/CO(6–5) line ratios range from 1 to 300, depending on the density and radiation field (UV radiation in case of a PDR and X–ray radiation for XDR models). In contrast, the [C II]/[C I] line ratio is predicted to be significantly different for a PDR and an XDR. While for a PDR the [C II]/[C I] ratio is anticipated to lie between 3–50, the range is predicted to be 6 for XDRs, see Figure 6. We can compare this range with the values measured in our quasar host galaxies. For J2348–3054, we derive a ratio of [C II]/[C I] , while for J0109–3047 and J0305–3150, the non-detection of the [C I] line results in lower limits of 32 and 24, respectively. All these values are significantly higher than the maximum line ratio predicted for X-ray dominated regions in the models of Meijerink et al. (2007). Based on these models we conclude that the heating of the ISM is dominated by star-formation.
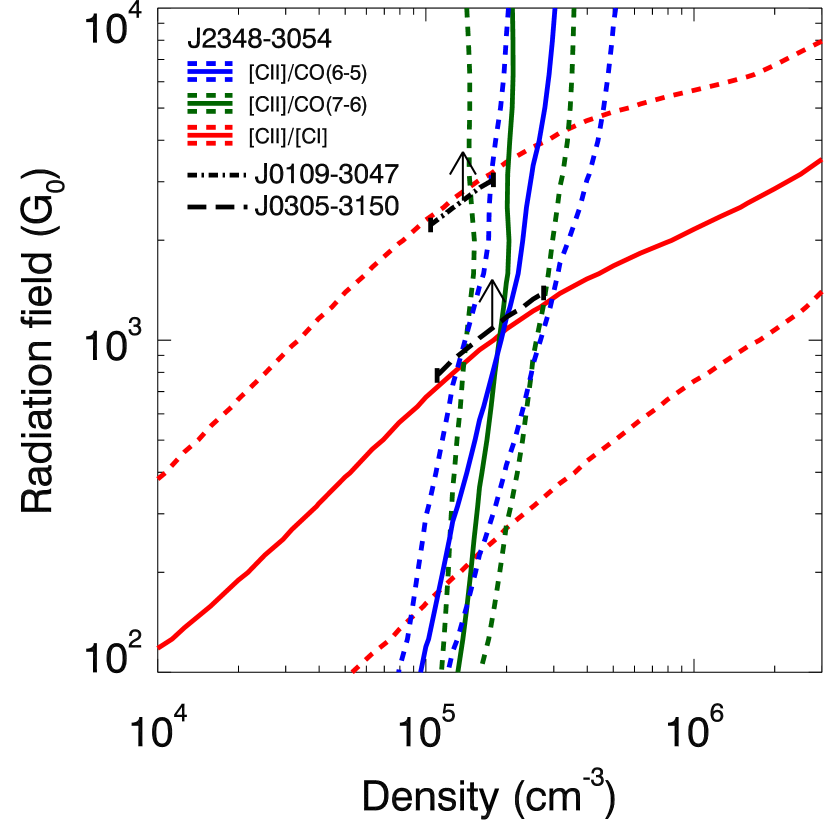
In contrast to the results shown in Figure 5, for J2348–3054 (for which we measured the strength of the [C II] CO(6–5), CO(7–6), and [C I] lines) we can constrain the density and radiation field, without relying on assumptions on the shape of the FIR emission and the CO excitation ladder. The results are shown in Figure 6. From the various line ratios, we derive a density of cm-3 and a radiation field strength of , with the radiation field strength in Habing units, erg s-1 cm-2. Also shown in Figure 6 are the constraints on the ISM properties in J0109–3054 and J0305–3150. From the [C II] to CO line ratios we obtain densities of cm-3 and cm-3. The non-detection of the [C I] line results in a lower limit on the radiation field strength of and .
If we assume that the [C II] flux coming from the PDR is only a factor 0.7 of the observed value (as found in local starbursts, see the discussion above), then from the PDR models we derive for J2348–3054 a slightly higher density of cm-3 and a lower radiation field strength of . To further constrain the properties of the ISM in these quasar host galaxies, observations of additional FIR emission lines are required.
With the derived values for the density and the radiation field from the PDR models, we can compare the properties of the ISM in the VIKING quasar hosts with those in other sources. The host galaxies of the quasar J1148+5251 at has been detected in many emission lines, including [C II] (e.g., Maiolino et al., 2005; Walter et al., 2009), CO (e.g., Bertoldi et al., 2003b; Walter et al., 2003; Riechers et al., 2013; Stefanon et al., 2015), and [C I] (Riechers et al., 2009). The [C II]/CO(7–6) ratio is very similar to that of the VIKING quasar hosts, suggesting that the ISM density is also around cm-3. On the other hand, the [C II]/[C I] ratio in J1148+5251, / (Riechers et al., 2013), is higher than we measured in J2348–3054. Based on the PDR models of (Meijerink & Spaans, 2005, Figure 6), this would require a radiation field strength of a . Wang et al. (2016) found very comparable values for the density and radiation field in the host of quasar J0100+2802 at based on the strength of the [C II] CO(6–5), and CO(2–1) emission lines and the FIR luminosity: cm-3 and . Although both the quasar luminosity and the derived values for are higher for J1148+5251 and J0100+2802 compared to the VIKING quasars and may point to a relation between the quasar luminosity and , there is no evidence for such a relation among our VIKING sources: the faintest quasar in our sample is J0109–3047, both in quasar luminosity (Venemans et al., 2013) and in FIR luminosity (Venemans et al., 2016), and has the highest (limit on) . This is confirmed when analyzing the emission line ratios in the starburst HFLS3 at (Riechers et al., 2013), a very massive galaxy without a luminous AGN. Again, the [C II]/CO(7–6) ratio in HFLS3 is very similar to those in the quasar hosts, while the [C II]/[C I] line ratio is 51 which implies a very high radiation field (Figure 6).
5 SUMMARY
In this paper, we present ALMA band 3 observations of the CO(6–5), CO(7–6), and [C I] 369 m emission lines in three of the highest redshift quasar host galaxies at . The sample has been previously detected in [C II] 158 m emission and the underlying FIR dust continuum (Venemans et al., 2016). CO is detected at high significance in all sources, making these measurements the highest-redshift CO detections to date. Given the resolution of our observations (25, or 12 kpc), all quasar hosts are spatially unresolved in the current data.
In two of our sources, we detect the continuum emission around the CO emission lines (around 400 m rest-frame). A comparison with the previously measured dust continuum at higher frequency (close to the [C II] line) gives dust temperatures that are broadly consistent with the canonical value of 47 K, albeit the current uncertainties are very large. Future observations of multi–frequency continuum emission clearly have the potential to derive more accurate dust temperatures, and possibly spatially resolved temperature gradients.
Assuming a CO SLED similar to that observed in the quasar J1148+5251, we derive molecular gas reservoirs of in the quasar hosts. For J2348–3054 and J0109–3047 we estimate high stellar masses of . For J0305–3150 as much as 54–81% of the dynamical mass is in the form of the molecular gas, indicating that the stellar mass is , less than 22 the mass of the central black hole ( ; De Rosa et al., 2014). Possibly we overestimated the molecular gas mass in this quasar host (if, for example, the CO(6–5)/CO(1–0) and CO(7–6)/CO(1–0) luminosity ratios are larger in J0305–3150 than that measured in J1148+5251), or the dynamical mass is significantly larger than the mass traced by the [C II] emission. The extrapolated [C II]-to–CO(1–0) luminosity ratio is 2500–4200, consistent with measurements in galaxies at lower redshift.
The (marginal) detection of [C I] emission in one quasar host galaxy (at ) and the limit on the [C I] emission in the other two galaxies enables us to characterize the physical properties of the interstellar medium in quasar hosts for the first time. In this case, the derived global CO/[C II]/[C I] line ratios are consistent with them emerging from photodissociation regions (PDRs), but inconsistent with an excitation from X–ray dominated regions (XDR). This implies that if the central supermassive black hole gives rise to an XDR, it does not dominate the excitation of the overall gas reservoir. This finding provides further evidence that the quasar host galaxies studied in this paper harbor intense starbursts, and provides justification to link quantities derived for the molecular gas and dust content to ongoing star formation in these quasar hosts.
The observations presented here represent only a modest investment of ALMA time (with typical on-source integration times between 15 and 35 minutes). This implies that future observations have the potential to resolve the molecular gas emission, which eventually could lead to spatially resolved excitation measurements within the quasar host galaxies at the highest redshift. Furthermore, by targeting other FIR emission lines, such as [O I] 146 m, [N II] 122 m, and [O III] 88 m, we will be able to put additional constraints on the properties and metallicity of the ISM in these forming massive galaxies in the early Universe.
References
- Bañados et al. (2015) Bañados, E., Decarli, R., Walter, F., et al. 2015, ApJL, 805, L8
- Bañados et al. (2016) Bañados, E., Venemans, B. P., Decarli, R., et al. 2016, ApJS, 227, 11
- Beelen et al. (2006) Beelen, A., Cox, P., Benford, D. J., et al. 2006, ApJ, 642, 694
- Bertoldi et al. (2003a) Bertoldi, F., Carilli, C. L., Cox, P., et al. 2003a, A&A, 406, L55
- Bertoldi et al. (2003b) Bertoldi, F., Cox, P., Neri, R., et al. 2003b, A&A, 409, L47
- Bowler et al. (2014) Bowler, R. A. A., Dunlop, J. S., McLure, R. J., et al. 2014, MNRAS, 440, 2810
- Carilli & Walter (2013) Carilli, C. L., & Walter, F. 2013, ARA&A, 51, 105
- Carilli et al. (2007) Carilli, C. L., Neri, R., Wang, R., et al. 2007, ApJ, 666, L9
- Carral et al. (1994) Carral, P., Hollenbach, D. J., Lord, S. D., et al. 1994, ApJ, 423, 223
- Colbert et al. (1999) Colbert, J. W., Malkan, M. A., Clegg, P. E., et al. 1999, ApJ, 511, 721
- da Cunha et al. (2013) da Cunha, E., Groves, B., Walter, F., et al. 2013, ApJ, 766, 13
- Daddi et al. (2010) Daddi, E., Bournaud, F., Walter, F., et al. 2010, ApJ, 713, 686
- De Rosa et al. (2011) De Rosa, G., Decarli, R., Walter, F., et al. 2011, ApJ, 739, 56
- De Rosa et al. (2014) De Rosa, G., Venemans, B. P., Decarli, R., et al. 2014, ApJ, 790, 145
- Decarli et al. (2014) Decarli, R., Walter, F., Carilli, C., et al. 2014, ApJL, 782, L17
- Decarli et al. (2017) Decarli, R., Walter, F., Venemans, B. P., et al. 2017, Natur, 545, 457
- Downes & Solomon (1998) Downes, D., & Solomon, P. M. 1998, ApJ, 507, 615
- Draine et al. (2007) Draine, B. T., Dale, D. A., Bendo, G., et al. 2007, ApJ, 663, 866
- Fan et al. (2006) Fan, X., Strauss, M. A., Becker, R. H., et al. 2006, AJ, 132, 117
- Ferkinhoff et al. (2014) Ferkinhoff, C., Brisbin, D., Parshley, S., et al. 2014, ApJ, 780, 142
- Gallerani et al. (2014) Gallerani, S., Ferrara, A., Neri, R., & Maiolino, R. 2014, MNRAS, 445, 2848
- Genzel et al. (2017) Genzel, R., Schreiber, N. M. F., Übler, H., et al. 2017, Natur, 543, 397
- Genzel et al. (2010) Genzel, R., Tacconi, L. J., Gracia-Carpio, J., et al. 2010, MNRAS, 407, 2091
- Grazian et al. (2015) Grazian, A., Fontana, A., Santini, P., et al. 2015, A&A, 575, A96
- Gullberg et al. (2015) Gullberg, B., De Breuck, C., Vieira, J. D., et al. 2015, MNRAS, 449, 2883
- Jiang et al. (2007) Jiang, L., Fan, X., Vestergaard, M., et al. 2007, AJ, 134, 1150
- Kaufman et al. (2006) Kaufman, M. J., Wolfire, M. G., & Hollenbach, D. J. 2006, ApJ, 644, 283
- Kaufman et al. (1999) Kaufman, M. J., Wolfire, M. G., Hollenbach, D. J., & Luhman, M. L. 1999, ApJ, 527, 795
- Kurk et al. (2007) Kurk, J. D., Walter, F., Fan, X., et al. 2007, ApJ, 669, 32
- Leipski et al. (2014) Leipski, C., Meisenheimer, K., Walter, F., et al. 2014, ApJ, 785, 154
- Lord et al. (1996) Lord, S. D., Hollenbach, D. J., Haas, M. R., et al. 1996, ApJ, 465, 703
- Maiolino et al. (2005) Maiolino, R., Cox, P., Caselli, P., et al. 2005, A&A, 440, L51
- Matsuoka et al. (2016) Matsuoka, Y., Onoue, M., Kashikawa, N., et al. 2016, ApJ, 828, 26
- McMullin et al. (2007) McMullin, J. P., Waters, B., Schiebel, D., Young, W., & Golap, K. 2007, in Astronomical Society of the Pacific Conference Series, Vol. 376, Astronomical Data Analysis Software and Systems XVI, ed. R. A. Shaw, F. Hill, & D. J. Bell, 127
- Meijerink & Spaans (2005) Meijerink, R., & Spaans, M. 2005, A&A, 436, 397
- Meijerink et al. (2007) Meijerink, R., Spaans, M., & Israel, F. P. 2007, A&A, 461, 793
- Mortlock et al. (2011) Mortlock, D. J., Warren, S. J., Venemans, B. P., et al. 2011, Natur, 474, 616
- Pavesi et al. (2016) Pavesi, R., Riechers, D. A., Capak, P. L., et al. 2016, ApJ, 832, 151
- Priddey & McMahon (2001) Priddey, R. S., & McMahon, R. G. 2001, MNRAS, 324, L17
- Riechers et al. (2013) Riechers, D. A., Bradford, C. M., Clements, D. L., et al. 2013, Natur, 496, 329
- Riechers et al. (2009) Riechers, D. A., Walter, F., Bertoldi, F., et al. 2009, ApJ, 703, 1338
- Sandstrom et al. (2013) Sandstrom, K. M., Leroy, A. K., Walter, F., et al. 2013, ApJ, 777, 5
- Stacey et al. (1991) Stacey, G. J., Geis, N., Genzel, R., et al. 1991, ApJ, 373, 423
- Stefan et al. (2015) Stefan, I. I., Carilli, C. L., Wagg, J., et al. 2015, MNRAS, 451, 1713
- Stefanon et al. (2015) Stefanon, M., Marchesini, D., Muzzin, A., et al. 2015, ApJ, 803, 11
- Venemans et al. (2015) Venemans, B. P., Bañados, E., Decarli, R., et al. 2015, ApJL, 801, L11
- Venemans et al. (2013) Venemans, B. P., Findlay, J. R., Sutherland, W. J., et al. 2013, ApJ, 779, 24
- Venemans et al. (2012) Venemans, B. P., McMahon, R. G., Walter, F., et al. 2012, ApJL, 751, L25
- Venemans et al. (2017) Venemans, B. P., Walter, F., Decarli, R., et al. 2017, ApJ, 837, 146
- Venemans et al. (2016) Venemans, B. P., Walter, F., Zschaechner, L., et al. 2016, ApJ, 816, 37
- Walter et al. (2003) Walter, F., Bertoldi, F., Carilli, C., et al. 2003, Natur, 424, 406
- Walter et al. (2009) Walter, F., Riechers, D., Cox, P., et al. 2009, Natur, 457, 699
- Walter et al. (2011) Walter, F., Weiß, A., Downes, D., Decarli, R., & Henkel, C. 2011, ApJ, 730, 18
- Wang et al. (2007) Wang, R., Carilli, C. L., Beelen, A., et al. 2007, AJ, 134, 617
- Wang et al. (2010) Wang, R., Carilli, C. L., Neri, R., et al. 2010, ApJ, 714, 699
- Wang et al. (2008) Wang, R., Carilli, C. L., Wagg, J., et al. 2008, ApJ, 687, 848
- Wang et al. (2011a) Wang, R., Wagg, J., Carilli, C. L., et al. 2011a, ApJ, 739, L34
- Wang et al. (2011b) —. 2011b, AJ, 142, 101
- Wang et al. (2013) —. 2013, ApJ, 773, 44
- Wang et al. (2016) Wang, R., Wu, X.-B., Neri, R., et al. 2016, ApJ, 830, 53
- Weiß et al. (2005) Weiß, A., Downes, D., Henkel, C., & Walter, F. 2005, A&A, 429, L25
- Weiß et al. (2003) Weiß, A., Henkel, C., Downes, D., & Walter, F. 2003, A&A, 409, L41
- Willott et al. (2015) Willott, C. J., Bergeron, J., & Omont, A. 2015, ApJ, 801, 123
- Willott et al. (2013) Willott, C. J., Omont, A., & Bergeron, J. 2013, ApJ, 770, 13
- Wu et al. (2015) Wu, X.-B., Wang, F., Fan, X., et al. 2015, Natur, 518, 512