IRIS Burst Spectra Co-Spatial To A Quiet-Sun Ellerman-Like Brightening
Abstract
Ellerman bombs (EBs) have been widely studied over the past two decades; however, only recently have counterparts of these events been observed in the quiet-Sun. The aim of this article is to further understand small-scale quiet-Sun Ellerman-like brightenings (QSEBs) through research into their spectral signatures, including investigating whether the hot signatures associated with some EBs are also visible co-spatial to any QSEBs. We combine H and Ca II Å line scans at the solar limb with spectral and imaging data sampled by the Interface Region Imaging Spectrograph (IRIS). Twenty one QSEBs were identified with average lifetimes, lengths, and widths measured to be around s, ″, and ″, respectively. Three of these QSEBs displayed clear repetitive flaring through their lifetimes, comparable to the behaviour of EBs in Active Regions (ARs). Two QSEBs in this sample occurred co-spatial with increased emission in SDO/AIA Å and IRIS slit-jaw imager Å data, however, these intensity increases were smaller than reported co-spatial to EBs. One QSEB was also sampled by the IRIS slit during its lifetime, displaying increases in intensity in the Si IV Å and Si IV Å cores as well as the C II and Mg II line wings, analogous to IRIS bursts (IBs). Using RADYN simulations, we are unable to reproduce the observed QSEB H and Ca II Å line profiles leaving the question of the temperature stratification of QSEBs open. Our results imply that some QSEBs could be heated to Transition Region temperatures, suggesting that IB profiles should be observed throughout the quiet-Sun.
Subject headings:
Sun: atmosphere - Sun: photosphere - Sun: magnetic fields - Sun: chromosphere1. Introduction
Ellerman bombs (hereafter referred to as EBs) are small-scale (lengths often below ″), short-lived (lifetimes below minutes) events which were originally identified by Ellerman (1917) as regions of intense brightness in the wings of the H line profile. These features were named ‘petit points’ by Lyot (1944) and ‘moustaches’ by Severny (1956), before the term ‘EBs’ was coined by McMath et al. (1960). EBs have been widely observed co-spatial to regions of opposite polarity magnetic field (see, for example, Pariat et al. 2004; Watanabe et al. 2011; Reid et al. 2016) and have been interpreted as the signatures of magnetic reconnection in the photosphere (e.g., Watanabe et al. 2008; Archontis & Hood 2009; Yang et al. 2016). Until recently, these events had been exclusively observed within Active Regions (ARs), however, new research by Rouppe van der Voort et al. (2016) has indicated the presence of EB-like events in the quiet-Sun, named quiet-Sun Ellerman-like brightenings (QSEBs) to distinguish these events from EBs themselves.
One of the most puzzling aspects of EBs is their appearance, or lack of, in a range of spectral lines. Identified signatures of these events include increased wing emission in the Ca II Å (Socas-Navarro et al. 2006), He I D3, and He I Å (Libbrecht et al. 2016) profiles, as well as enhanced emission in the Å (Qiu et al. 2000) and Å continua (Vissers et al. 2013, 2015). Both Ellerman (1917) and Rutten et al. (2015), however, identified no signatures of EBs in the Na I or Mg I b2 lines. Semi-empirical modelling of a variety of combinations of these lines originally led to estimates of heating within the local photospheric plasma ranging from - K (see, e.g., Kitai 1983; Fang et al. 2006; Berlicki & Heinzel 2014; Grubecka et al. 2016). Temperature increases of this order were challenged by results obtained through analysis of Interface Region Imaging Spectrograph (IRIS; De Pontieu et al. 2014) data which implied significantly more heating is occurring during the lifetimes of EBs (up to K).
The identification of small-scale brightening events in the IRIS Si IV ‘Transition Region’ (TR) lines was accomplished by Peter et al. (2014) who observed ‘hot explosions’, with estimated temperatures of K. These authors suggested that such IRIS bursts (IBs) could be evidence of heating within photospheric EBs, which could not be directly identified in that work, to temperatures an order of magnitude higher than those predicted by previous semi-empirical modelling. It should be noted, however, that such modelling had, until that point, been conducted under the assumption that EBs occurred in relatively cool photospheric and chromospheric conditions and had not, therefore, attempted to account for the high temperatures of IBs. In an independent analysis, however, Judge (2015) asserted that these IRIS features were, instead, formed in the chromosphere or above. Links between at least a sub-set of EBs and IBs were established by Vissers et al. (2015), Kim et al. (2015), and Tian et al. (2016) appearing to support the assertion that it is photospheric plasma contained within EBs that reaches TR temperatures. It should be noted, though, that recent work by Rutten (2016), who assumed that the visibility of EBs could be explained by LTE modelling, has suggested that temperatures as low as K could account for the observed increased emission in the Si IV line.
With relation to QSEBs, Rouppe van der Voort et al. (2016) found no evidence of emission signatures in Ca II Å data, Si IV images (sampled by IRIS), or the Å and Å continuum, indicating that these events could be formed at lower temperatures or physical heights than their AR cousins. The observed lengths and lifetimes of these events were also smaller than those found for AR EBs in the literature (see, for example, Watanabe et al. 2011; Vissers et al. 2013; Nelson et al. 2015) leading these authors to suggest that QSEBs were a ‘weaker member’ of the small-scale, reconnection driven family of events in the lower solar atmosphere, possibly consistent with the modelling attempts of Nelson et al. (2013). Notably though, Rouppe van der Voort et al. (2016) only studied slit-jaw images from IRIS, and a detailed analysis of the spectra, in order to identify whether typical IB profiles can be observed co-spatial to QSEBs, is still required.
Recently, Reid et al. (2017) used RADYN simulations (Carlsson & Stein 1992, 1995) to model one-dimensional solar atmospheres perturbed by energy deposition at multiple layers. These authors then synthesised H and Ca II Å line profiles finding that impulsive energy releases in the upper photosphere could account for EB signatures. Whether such techniques and models could reproduce QSEB signatures (i.e., H wing emission with no co-temporal Ca II Å response), however, is still unknown and will be discussed here.
In this article, we aim to further understand both QSEBs and IBs, specifically by researching whether IBs are also evident in the quiet-Sun co-spatial to any QSEBs. We structure our work as follows: In Section 2, we introduce the observations analysed here. Section 3 presents our results, including the inference of the basic properties of QSEBs and an analysis of the signatures of one of these events in spectra collected by IRIS. Finally, we draw our conclusions in Section 4.
2. Observations
The ground-based observations analysed in this article were acquired with the CRisp Imaging SpectroPolarimeter (CRISP: Scharmer 2006; Scharmer et al. 2008) at the Swedish -m Solar Telescope (SST: Scharmer et al. 2003) on th June . A quiet-Sun region (co-ordinates of ″, ″) was selected for observation between :: UT and :: UT. The observing sequence applied during this time consisted of a point H line-scan and a -point full-Stokes Ca II Å line scan, both of which sampled Å into the wings of the lines. Wideband images were also acquired for H and Ca II Å at each time-step for alignment purposes. These data were reduced using the multi-object multi-frame blind deconvolution (MOMFBD; van Noort et al. 2005) method, with eight exposures at each wavelength position, and following the CRISPRED pipeline (see de la Cruz Rodríguez et al. 2015). Analysis was conducted, in part, using the CRISPEX package (Vissers & Rouppe van der Voort 2012). The final science-ready cadence and pixel-scale of these data were seconds and ″, respectively.
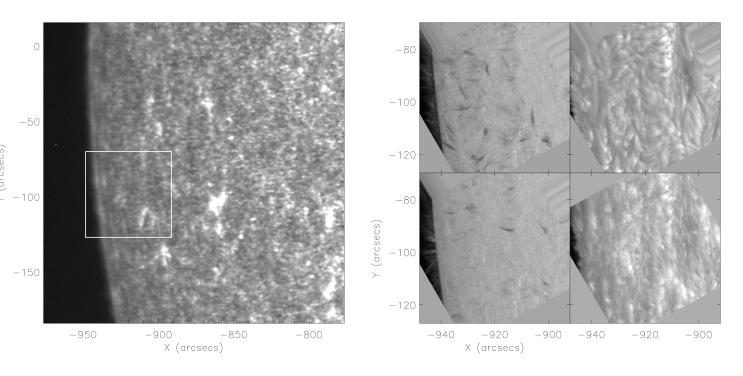
Co-spatial and co-temporal data from three filters ( Å, Å, and Å) of the Solar Dynamics Observatory’s Atmospheric Imaging Assembly (SDO/AIA; Lemen et al. 2012) instrument were also analysed. A ″″ region centred on the CRISP/SST field-of-view (FOV) was downloaded for the entire time-series. The pixel-scale of these data is approximately ″ (corresponding to around km in the horizontal scale). The cadence of these data is wavelength-dependent, being seconds for the Å data and seconds for the Å and Å data. Alignment of the SDO/AIA filters with the SST/CRISP line scans was achieved by matching the solar limb and stable network bright points within the Å and wideband Ca II Å context images through time. The initial FOV of these data is plotted for reference in Fig. 1 including a larger SDO/AIA Å context image (left panel) and (clockwise from the top left in the right panel) SST/CRISP images for the H blue wing ( Å), H line core, Ca II line core, and H red wing ( Å). The white box in the left panel indicates the SST/CRISP FOV.
Finally, data from the IRIS satellite were also analysed. IRIS collected five dense -step rasters between :: UT and :: UT, with the first raster coinciding temporally with the SST/CRISP observations. However, as IRIS began the scan off the solar disk and then progressed across the SST/CRISP FOV, only those data sampled between :: UT and :: UT are co-temporal and co-spatial to the SST/CRISP dataset. Slit-jaw images (SJIs) were sampled by the Å, Å, and Å filters with cadences of s, s (with every fifth frame skipped to collect Å images), and s, respectively. The spatial resolution of these data was ″. Alignment of these data to the SST/CRISP, and hence the SDO/AIA, FOV was completed by correlating the Å channel to wide-band Ca II Å images. The IRIS spectral data had an exposure time of s and a spectral dispersion of approximately Å for both the NUV and FUV windows.
2.1. Feature Identification
Candidate QSEBs were selected by locating small-scale (″), short-lived ( lifetime min) regions of intense brightness (over % of the local background intensity) in the near wings ( Å) of the H line profile. This threshold is lower compared to the % threshold used by, for example, Vissers et al. (2013); Nelson et al. (2015)) and was selected due to the inherent lower line wing intensity enhancements identified co-spatial to QSEBs by Rouppe van der Voort et al. (2016). Next, we specified that the proportional increase in intensity from the background decreased further out in the wings ( Å) in order to differentiate QSEBs from magnetic concentrations (MCs or ‘pseudo-EBs’; see Rutten et al. 2013) which are known to increase the continuum intensity. Once the candidate QSEBs had been detected, the H line core images were examined in order to remove features which corresponded to H micro-flares (features with obvious emission in the H line core). Finally, apparent explosive behaviour (rapid morphological evolutions widely associated with EBs; Nelson et al. 2015; Vissers et al. 2015) was required, allowing us to confidently remove any remaining MCs. Overall, QSEBs were located in this dataset for further study.
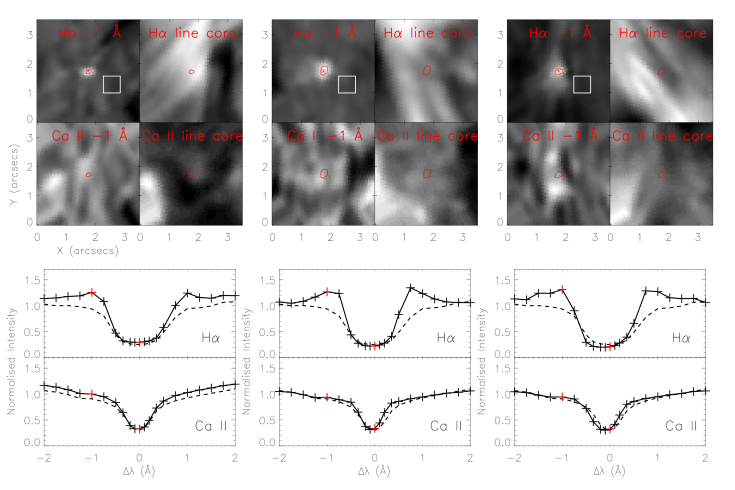
Three of the QSEBs selected for analysis here are presented in Fig. 2 for reference. The frames in the top row plot H blue wing ( Å), line core, Ca II Å blue wing ( Å), and Ca II Å line core images co-spatial and co-temporal to individual QSEBs. A long, thin brightening reminiscent of the events studied by Rouppe van der Voort et al. (2016) can be observed in the H line wing for each example, however, no unambiguous increase in intensity can be observed in any other panel of these plots. Slight Ca II Å wing enhancement similar to one case presented by Rouppe van der Voort et al. (2016) were evident in two QSEBs from our sample; however, inspection of the imaging data revealed blurred patches, dissimilar to the compact H features in both time and space, implying that these co-spatial brightenings may not be linked to the QSEB itself. The red crosses and white boxes in the top left panels of each column indicate the pixel and set of pixels used to construct QSEB (solid line) and time-averaged quiet-Sun reference (dashed line) profiles, respectively. These profiles are plotted in the bottom panels of Fig. 2, where red crosses indicate the wavelength positions plotted in the upper row. Obvious increases in intensity are evident in the wings of the H line profile (peaking at approximately Å) for each of these events confirming their QSEB-like nature. The event plotted in the right-hand column is the feature sampled by the IRIS slit during its lifetime.
3. Results
3.1. Properties of QSEBs derived from imaging data

We begin our analysis by acquiring measurements of the lengths, widths, and lifetimes of the QSEB events studied in this article using CRISPEX. These measurements allow QSEBs to be compared with the EBs discussed in the literature (specifically by Nelson et al. 2015 who used a dataset with an identical spatial resolution thereby obtaining exactly comparable results) and to reaffirm the properties of QSEBs reported by Rouppe van der Voort et al. (2016). In the top panel of Fig. 3, we plot the lengths and widths of the sample of QSEBs measured here [diamonds] and the AR EBs discussed by Nelson et al. (2015) [crosses]. It is immediately evident that the QSEBs are, in general, smaller than their AR counter-parts. The means of the lengths and widths of these QSEBs were found to be ″ (=″) and ″ (=″), respectively. In the bottom frame of Fig. 3, we plot the length against lifetime of these QSEB features and the EBs studied by Nelson et al. (2015). The mean lifetime of these QSEBs is approximately s (= s), around one minute higher than the value reported by Rouppe van der Voort et al. (2016). As the minimum possible lifetime of events in this sample was seconds, it is likely that this difference is due to the relatively low cadence of the data analysed here. Indeed, several events in our sample were observed to live for around minutes, with seemingly repetitive parabolic ‘flaming’ (see Fig. 4) which occurred over the course of one or two frames. For consistency, we did not classify each individual flame as a separate event, thereby increasing the mean. Recalculating the mean to account for repetition within the sample lowers the average lifetime of these QSEBs to s (= s).
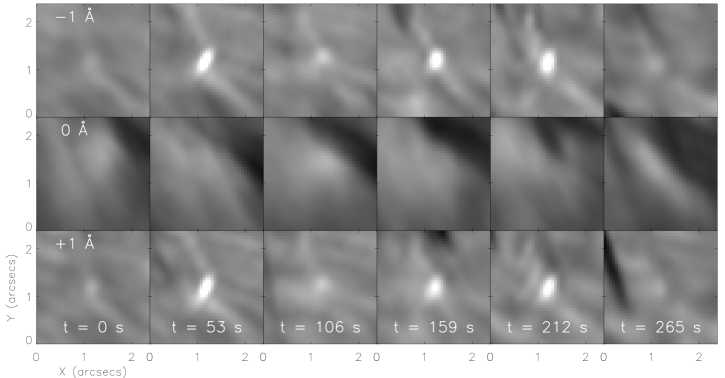
Of the events analysed here, three were observed to display such impulsive repetitive behaviour over short time-scales during their lifetimes. This behaviour was not apparent in the majority of features studied by Rouppe van der Voort et al. (2016). In Fig. 4, we plot the evolution of the left-hand event presented in Fig. 2 at s intervals for three positions within the H line profile, namely Å, the line core, and Å. In the second column, a QSEB is easily observed which then reduces in intensity and length in the 3rd column before appearing to extend once again in the 4th column. Through a close inspection of the imaging data during this time period, it is clear that the apparent fading and contraction of the QSEB is not due to a reduction in seeing quality but is, instead, a real change in morphology of the event through time. Further to such impulsive recurrence, we also found one location where at least three seemingly independent QSEBs occured over the course of minutes. Such recurrence, shown for AR EBs (see, for example: Qiu et al. 2000; Nelson et al. 2015), is thought, in-line with the magnetic reconnection hypothesis, to be indicative of multiple releases of energy from the same spatial location, potentially due to flux build up through time (see, for example, Reid et al. 2016).
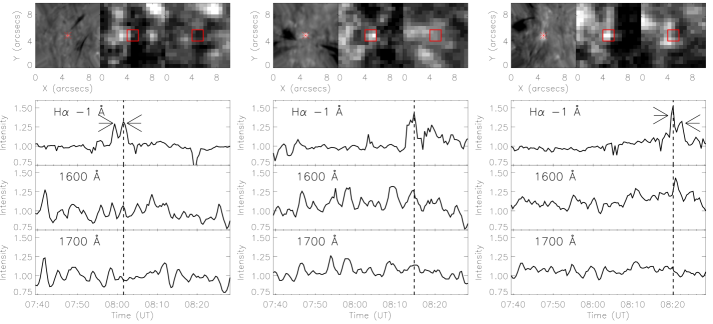
SDO/AIA images co-spatial to these QSEBs were also analysed. As with EBs identified in ARs (see, e.g, Vissers et al. 2013; Nelson et al. 2015), no signature of QSEBs was observed in the SDO/AIA Å filter. In Fig. 5, we plot expanded FOVs around the three QSEBs presented in Fig. 2 for the H blue wing ( Å; left-hand panel), the SDO/AIA Å filter (central panel), and the SDO/AIA Å filter (right-hand panel). The small-scale QSEBs (in the H data) are almost entirely covered by the red crosses, which indicate the pixels selected to construct the lightcurves in the bottom panels. No signature was observed co-spatial to any QSEBs in the SDO/AIA Å channel, however, the events plotted in the central and right-hand columns of Fig. 5 did appear to be linked to burst-like events in the SDO/AIA Å filter. The isolation of the UV intensity enhancement to the SDO/AIA Å data could be due to increased emission of the TR C IV in that filter rather than enhancements in the continuum intensity, potentially indicating that increased Si IV emission would also be expected. The red boxes over-laid on the SDO/AIA images indicate the regions selected to construct lightcurves.
The H line wing lightcurves plotted in the top panels of the bottom row of Fig. 5 depict the short-lived (of the order minutes) intensity increases which are indicative of the presence of the QSEBS. Both QSEBs displayed in the left (plotted through time in Fig. 4) and right-hand columns are repetitive through their lifetimes, with individual peaks highlighted by the arrows. The dashed vertical lines indicate the frames plotted in the top row. The SDO/AIA Å lightcurves (middle row) plotted in the central and right-hand columns display short-lived peaks in intensity co-temporal to the formation of the QSEBs, with the right-hand column exhibiting the clearest example of this behaviour. The intensity for the minutes surrounding the QSEB approaches % of the time-averaged local background intensity. These increases in SDO/AIA Å intensity, co-temporal to only a small fraction of these QSEBs, are comparable to the signatures identified co-spatial to EBs in ARs.
3.2. Links Between QSEBs And IBs
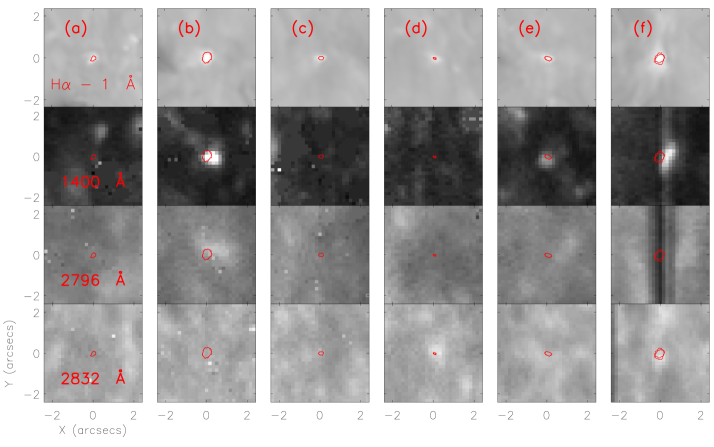
As IRIS was conducting a raster from off the limb to the solar disk, only the six QSEB features which occurred between :: UT and :: UT were studied using data collected by the SJI. This sample included the features plotted in the central and right-hand columns of Fig. 2 and Fig. 5. In Fig. 6 we plot the Å (second row), Å (third row), and Å (bottom row) responses to the QSEBs (plotted in the H blue wing in the top row). Of these events, two (the QSEBs displayed in the second and sixth columns which correspond to the central and right-hand events of Fig. 5, respectively) were identified to form co-spatial to short-lived increases in intensity in the Si IV Å filter, which appeared analogous to IBs (see, for example, Peter et al. 2014; Vissers et al. 2015; Tian et al. 2016). None of the other four events were observed co-spatial to IBs, agreeing with the results of Rouppe van der Voort et al. (2016) that the majority of QSEBs display no TR signature. The two QSEBs which formed co-spatial to obvious IRIS signatures were neither particularly large, intense, or long-lived, appearing to be similar to the majority of QSEBs in this sample.
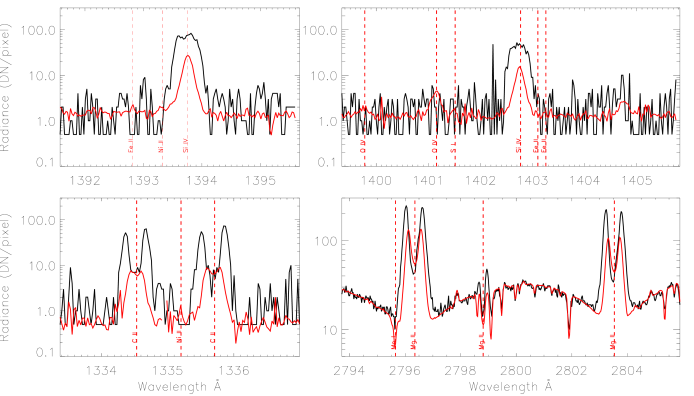
Interestingly, the feature in the right-hand column of Fig. 6 was also sampled by the IRIS slit during its lifetime displaying an IRIS burst-like spectrum. In the top row of Fig. 7, we plot the Si IV Å (left) and Si IV Å (right) spectral profiles sampled at the location of the IB (black line) and averaged over a quieter region close to this feature (red line). The bottom row plots the C II (left) and Mg II (right) spectra. Wavelength calibration was conducted following the method suggested by Tian et al. (2016). The Si IV Å window Doppler shift was estimated using the Ni II Å line (which was assumed to have zero Doppler shift). This shift was then also applied to the Si IV Å window. The C II spectral window was calibrated using the Ni II Å line (which, again, was assumed to have no Doppler shift). The accuracy of the detected shifts were confirmed by the similarity of the shifts in the Ni II Å and Ni II Å lines. The shift in the Mg II window was estimated using the neutral Mn I Å line.
The general shapes of the plotted spectral lines sampled at the location of the QSEB are similar to IBs discussed in the literature (see, for example, Peter et al. 2014; Tian et al. 2016 for a variety of IB spectra), including wider and brighter Si IV profiles, increases in the Mg II and C II line wing intensities, and absorption profiles of some chromospheric lines (for example, Ni II Å, Ni II Å, Fe II Å). The ratio between the intensities of the Si IV Å and Si IV Å lines at the location of the QSEB is , lower than that calculated for the reference profiles of and the optically thin case of . In addition to this, some absorption is observed in the core of the Si IV line, consistent with the self absorption discussed by Yan et al. (2015). These profiles provide the first evidence that certain QSEBs can occur co-spatial to IBs.
Quantitatively, the increases in intensity and line-width measured co-spatial to this QSEB are around an order of magnitude smaller than those previously reported around IBs (although it should be noted they are similar to some examples, including IB discussed by Tian et al. 2016). This could be expected, however, given the reduced sizes and lower H line wing intensities of QSEBs in comparison to AR EBs (as well as the typically lower background intensities in the quiet-Sun). Interestingly, the Si IV line widths measured for this IB are smaller than observed for most IBs in the literature. Potentially, this could be caused by the viewing angle as, if the bi-directional jets associated with the QSEB are predominantly vertical, only the limited line-of-sight component of such motions would be measured; however, this is currently only speculation.
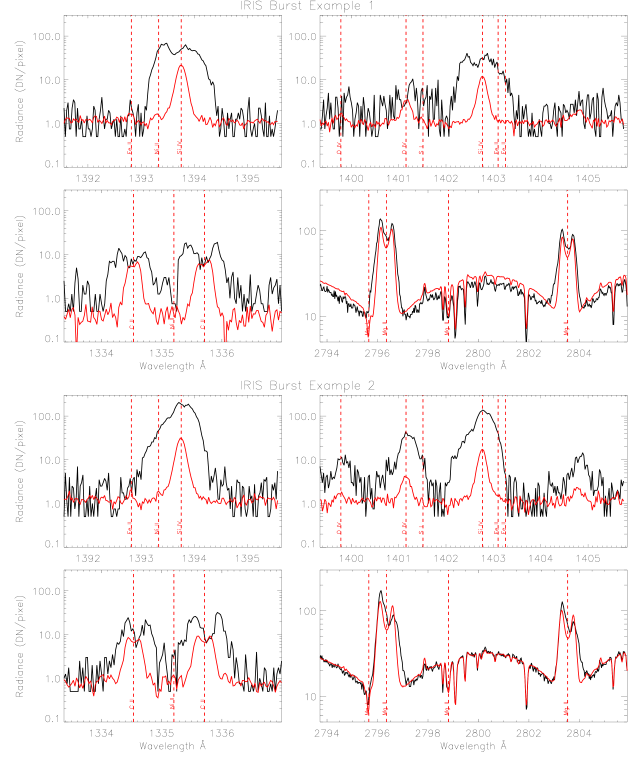
In Fig. 8, we plot spectral data for two further IBs (with the same layout as applied in Fig. 7) which occurred after the SST/CRISP instrument had stopped acquisition. Therefore, these events could not be linked to any QSEB. The Si IV spectra for both of the events plotted in Fig. 8 displayed much larger line widths than the event plotted in Fig. 7 appearing to be analogous to the features discussed by Tian et al. (2016). The ratios between the two Si IV lines are and for Examples and , respectively, and again indicate a departure from the optically thin regime. It should be noted that the intensity enhancement in the Si IV line cores for Example are twice those measured for the QSEB-linked IB and are, therefore, comparable to the intensities measured co-spatial to IBs in ARs by Tian et al. (2016).
The C II data for both IBs display broadened and enhanced line wings. The Mg II h&k peak intensities in Fig.8 are also slightly asymmetric, most likely due to velocity gradients in the atmosphere shifting the wavelength of maximum opacity to the red causing increased emission in the blue peak. This effect has been described in detail in Carlsson & Stein (1997) and observed in flare line profiles presented in Kuridze et al. (2015) (for H) and Kerr et al. (2016) (for Mg II). Both of the events plotted in Fig. 8 also show evidence of self-absorption in the Si IV Å line, with Example displaying clear self-absorption in the Si IV Å line as well. This self-absorption is also consistent with the scenario suggested by Yan et al. (2015), whereby the increased density within the feature causes absorption at the line core.
3.3. H and Ca II Å line synthesis
Finally, we investigate one-dimensional RADYN simulations (Carlsson & Stein 1992, 1995) created by perturbing three quiet solar-like atmospheres by depositing energy at a range of heights (building on the work recently presented by Reid et al. 2017). The motivation of this work is to attempt to explain the profiles displayed in Fig. 2, where the H wing intensities are enhanced but no Ca II Å response is observed. Rouppe van der Voort et al. (2016) suggested that this observational signature is caused by the occurrence of the QSEB at heights which do not influence the Ca II Å line. Whether such layers exist still requires verification. We conducted a large range of simulations where either erg cm-3 s-1, erg cm-3 s-1, or erg cm-3 s-1 of energy was inputted into a static atmospheric model at deposition layers (ranging from the photosphere to the chromosphere) which had heights of either km or km. We allowed the systems to stablise for s, before H and Ca II Å line profiles were constructed after s of solar time using the MULTI package built into RADYN. Overall, more than models were considered.
Before considering the results of these simulations, we briefly discuss the reasons for selecting the parameters introduced in the previous paragraph. Firstly, we considered energy deposition layers of km and km as smaller values would be below the spatial resolution of instruments such as the SST/CRISP and larger layers would be well above the local scale height. Any energy deposition layers larger than km would, therefore, not satisfy the condition that energy is deposited at a preferential location in the solar atmosphere, causing the observed spectral profiles of QSEBs. Secondly, the erg cm-3 s-1 energy deposition rate was found to produce unrealistically high intensity enhancement in the H line profiles. Therefore, we do not consider any energy deposition rates higher than this. Energy deposition rates lower than erg cm-3 s-1 did not provide the required H wing intensity increases and were also not considered. Finally, three different starting atmospheres (one quiet Sun, as well as QS.SL.LT and QS.SL.HT from Allred et al. 2015) were studied although the results obtained for each were comparable and, as such, we only present results from the quiet Sun atmosphere.
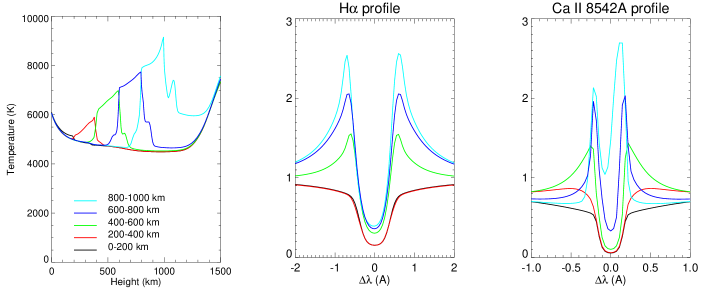
In the left hand panel of Fig. 9, we plot examples of temperature profiles for five km high energy ( erg cm-3 s-1) deposition layer simulation runs, measured at s. Each coloured line in the left-hand panel denotes a different energy deposition layer. These examples are representative of the entire suite of models which we studied. The centre and right hand panels plot the respective H and Ca II Å synthesised line profiles. It is immediately evident that the higher the energy is deposited in the atmosphere, the more emission the synthesised wings of both the H and Ca II Å lines display. In no case do the synthesised H wings form in emission when the Ca II Å wings do not. On the contrary, when the energy is deposited between - km, enhanced Ca II Å line wings are evident with no response from H. Qualitatively, these results do not change when one considers the shorter km energy deposition bins. The line core intensities of both lines are also increased for higher energy deposition layers, although, this is probably due to the lack of three-dimensional effects (i.e., the lack of overlying canopy) in the simulations. Varying the energy deposition rate only changes the level of enhancement across both lines.
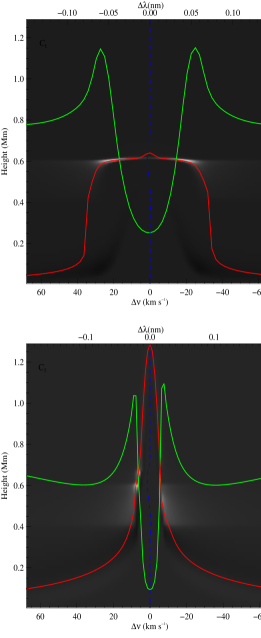
The strong connection between H line wing increases and Ca II Å line wing increases in these simulations comes from the modification of the contribution function of both lines due to the energy deposition. In the top panel of Fig. 10, we plot the difference between the s and s contribution functions for the H line profile, for a representative km high energy deposition layer. The overlaid lines plot the synthesised line profile (green; arbitrary scaling) and the height (red). The bright regions at a simulation height of km and a Doppler shift of km s-1 indicate the locations at which the enhanced emission in the H line wings (typical of EBs and QSEBs) occurs. The bottom panel plots the corresponding information for the Ca II Å line profile. This differenced contribution function also displays the bright regions (which are, perhaps, even more obvious than in H) at Doppler shifts of around km s-1, which lead to increases in intensity in the Ca II Å line wings. Due to the change in the source function and opacity caused by the heating, the contribution of both the H and Ca II Å line wings increases at these heights, regardless of the quiet-Sun formation heights of these lines. Overall, these results do not appear to support the assertion that energy deposition, consistent with EBs and QSEBs, at specific heights in the solar atmosphere can lead to H wing emission without Ca II Å wing intensity enhancements. However, future work should aim to investigate this further, perhaps using different starting atmosphere models.
4. Discussion and Conclusions
QSEBs are an interesting newly discovered phenomenon, identified by increases in intensity in the H line wings similar to EBs (Ellerman 1917; Nelson et al. 2015; Vissers et al. 2015) but located in the quiet-Sun. These events are thought to highlight the occurrence of magnetic reconnection in the photosphere outside of ARs, perhaps similar to the modelling presented by Nelson et al. (2013) and Danilovic (2017). In this paper, we have not only corroborated the results of Rouppe van der Voort et al. (2016), but have also highlighted some new properties of these features, including repetition over both short and long time-scales (in comparison to the lifetimes of the QSEBs), and shown the presence of an IB co-spatial to an individual QSEB (similar in nature to IB occurrence co-spatial to EBs; Tian et al. 2016), thereby also confirming the presence of IBs in the quiet-Sun. In the following paragraphs we shall present a brief overview of our results and discuss how they fit in with the current understanding of small-scale reconnection events.
Initially, QSEBs were identified in H line scans collected at the solar limb by the SST/CRISP instrument. The basic properties of these events were comparable to those found by Rouppe van der Voort et al. (2016) with average lifetimes, lengths, and widths of approximately s, ″, and ″, respectively. These values are at the lower end of the spectrum of properties previously derived for EBs in ARs, as is shown in Fig. 3. Two features within this sample did appear co-spatial to limited ( %) Ca II Å wing brightenings, however, as the bright regions in the Ca II Å line wings bore little resemblence to the clear, elongated QSEBs identified in H, it is likely that the Ca II Å heightened wing emission was not related to the QSEB. By studying a large range of RADYN simulated profile, created by perturbed reference profiles by an input of energy, we were unable to reproduce line profiles which displayed enhanced H line wing emission and no Ca II Å response (see Fig. 9).
Repetitive, impulsive flame-like behaviour (shown to be common for EBs; see, e.g., Vissers et al. 2015; Nelson et al. 2015) was observed for three QSEB events in our sample. The evolution of one of these QSEBs is detailed in Fig. 4 and the lightcurves constructed for that event and one further example are plotted in the left and right-hand columns of Fig. 5, respectively, with the repetitive peaks indicated by the arrows. Such repetition was not widely observed either here or by Rouppe van der Voort et al. (2016), begging the question as to whether recurrence is common across the solar disk or whether it is only limited to certain regions with currently unknown similarities where, perhaps, flux build-up occurs more readily (for example, at super-granular boundaries).
Two of these QSEBs formed co-spatial to burst events in the SDO/AIA Å UV and SJI Å data, with one of these events being sampled by the IRIS slit during its lifetime. The IRIS spectra displaying increased intensity in the Si IV Å and Å lines, as well as wing intensity increases in the C II and Mg II spectral windows (see Fig. 7). These profiles were analogous to IBs discussed in the literature (Peter et al. 2014; Vissers et al. 2015; Tian et al. 2016). The Si IV line widths were smaller than the majority of IBs, however, this could be due to line-of-sight effects if the dominant motion of the QSEB is vertical away from the solar disk (i.e., perpendicular to the line-of-sight). Support for this assertion was found through analysis of several other IBs, which were identified in these data (presented in Fig. 8). These IBs displayed larger Si IV line widths in addition to blue shifted Mg II profiles potentially indicating velocities in the line-of-sight.
Overall, our results indicate that the majority of QSEBs are smaller and apparently weaker than their AR cousins, agreeing with the results of Rouppe van der Voort et al. (2016). However, the IBs co-spatial to two of these features indicate that that some (likely a small minority of) QSEBs could be linked to localised heating of plasma to TR temperatures, in a similar manner to energetic EBs in ARs. Future observational work should be carried out to discover how common such apparently energetic QSEBs are. It also remains to be seen whether the interesting H and Ca II Å signatures of QSEBs can be reproduced through further semi-empirical modelling.
References
- Allred et al. (2015) Allred, J. C., Kowalski, A. F., & Carlsson, M. 2015, ApJ, 809, 104
- Archontis & Hood (2009) Archontis, V., & Hood, A. W. 2009, A&A, 508, 1469
- Berlicki & Heinzel (2014) Berlicki, A., & Heinzel, P. 2014, A&A, 567, A110
- Carlsson & Stein (1992) Carlsson, M., & Stein, R. F. 1992, ApJ, 397, L59
- Carlsson & Stein (1995) —. 1995, ApJ, 440, L29
- Carlsson & Stein (1997) —. 1997, ApJ, 481, 500
- Danilovic (2017) Danilovic, S. 2017, ArXiv e-prints, arXiv:1701.02112
- de la Cruz Rodríguez et al. (2015) de la Cruz Rodríguez, J., Löfdahl, M. G., Sütterlin, P., Hillberg, T., & Rouppe van der Voort, L. 2015, A&A, 573, A40
- De Pontieu et al. (2014) De Pontieu, B., Title, A. M., Lemen, J. R., et al. 2014, Sol. Phys., 289, 2733
- Ellerman (1917) Ellerman, F. 1917, ApJ, 46, 298
- Fang et al. (2006) Fang, C., Tang, Y. H., Xu, Z., Ding, M. D., & Chen, P. F. 2006, ApJ, 643, 1325
- Georgoulis et al. (2002) Georgoulis, M. K., Rust, D. M., Bernasconi, P. N., & Schmieder, B. 2002, ApJ, 575, 506
- Grubecka et al. (2016) Grubecka, M., Schmieder, B., Berlicki, A., et al. 2016, A&A, 593, A32
- Judge (2015) Judge, P. G. 2015, ApJ, 808, 116
- Kerr et al. (2016) Kerr, G. S., Fletcher, L., Russell, A. J. B., & Allred, J. C. 2016, ApJ, 827, 101
- Kim et al. (2015) Kim, Y.-H., Yurchyshyn, V., Bong, S.-C., et al. 2015, ApJ, 810, 38
- Kitai (1983) Kitai, R. 1983, Sol. Phys., 87, 135
- Kuridze et al. (2016) Kuridze, D., Zaqarashvili, T. V., Henriques, V., et al. 2016, ApJ, 830, 133
- Kuridze et al. (2015) Kuridze, D., Mathioudakis, M., Simões, P. J. A., et al. 2015, ApJ, 813, 125
- Lemen et al. (2012) Lemen, J. R., Title, A. M., Akin, D. J., et al. 2012, Sol. Phys., 275, 17
- Libbrecht et al. (2016) Libbrecht, T., Joshi, J., de la Cruz Rodríguez, J., Leenaarts, J., & Asensio Ramos, A. 2016, ArXiv e-prints, arXiv:1610.01321
- Lyot (1944) Lyot, B. 1944, Annales d’Astrophysique, 7, 31
- McMath et al. (1960) McMath, R. R., Mohler, O. C., & Dodson, H. W. 1960, Proceedings of the National Academy of Science, 46, 165
- Nelson et al. (2015) Nelson, C. J., Scullion, E. M., Doyle, J. G., Freij, N., & Erdélyi, R. 2015, ApJ, 798, 19
- Nelson et al. (2013) Nelson, C. J., Shelyag, S., Mathioudakis, M., et al. 2013, ApJ, 779, 125
- Pariat et al. (2004) Pariat, E., Aulanier, G., Schmieder, B., et al. 2004, ApJ, 614, 1099
- Peter et al. (2014) Peter, H., Tian, H., Curdt, W., et al. 2014, Science, 346, 1255726
- Qiu et al. (2000) Qiu, J., Ding, M. D., Wang, H., Denker, C., & Goode, P. R. 2000, ApJ, 544, L157
- Reid et al. (2016) Reid, A., Mathioudakis, M., Doyle, J. G., et al. 2016, ApJ, 823, 110
- Reid et al. (2017) Reid, A., Mathioudakis, M., Kowalski, A., Doyle, J. G., & Allred, J. C. 2017, ApJ, 835, L37
- Reid et al. (2015) Reid, A., Mathioudakis, M., Scullion, E., et al. 2015, ApJ, 805, 64
- Rouppe van der Voort et al. (2003) Rouppe van der Voort, L. H. M., Rutten, R. J., Sütterlin, P., Sloover, P. J., & Krijger, J. M. 2003, A&A, 403, 277
- Rouppe van der Voort et al. (2016) Rouppe van der Voort, L. H. M., Rutten, R. J., & Vissers, G. J. M. 2016, A&A, 592, A100
- Rutten (2016) Rutten, R. J. 2016, A&A, 590, A124
- Rutten et al. (2015) Rutten, R. J., Rouppe van der Voort, L. H. M., & Vissers, G. J. M. 2015, ApJ, 808, 133
- Rutten et al. (2013) Rutten, R. J., Vissers, G. J. M., Rouppe van der Voort, L. H. M., Sütterlin, P., & Vitas, N. 2013, Journal of Physics Conference Series, 440, 012007
- Scharmer (2006) Scharmer, G. B. 2006, A&A, 447, 1111
- Scharmer et al. (2003) Scharmer, G. B., Bjelksjo, K., Korhonen, T. K., Lindberg, B., & Petterson, B. 2003, in Proc. SPIE, Vol. 4853, Innovative Telescopes and Instrumentation for Solar Astrophysics, ed. S. L. Keil & S. V. Avakyan, 341–350
- Scharmer et al. (2008) Scharmer, G. B., Narayan, G., Hillberg, T., et al. 2008, ApJ, 689, L69
- Severny (1956) Severny, A. B. 1956, The Observatory, 76, 241
- Socas-Navarro et al. (2006) Socas-Navarro, H., Martínez Pillet, V., Elmore, D., et al. 2006, Sol. Phys., 235, 75
- Soler et al. (2012) Soler, R., Díaz, A. J., Ballester, J. L., & Goossens, M. 2012, ApJ, 749, 163
- Tian et al. (2016) Tian, H., Xu, Z., He, J., & Madsen, C. 2016, ApJ, 824, 96
- van Noort et al. (2005) van Noort, M., Rouppe van der Voort, L., & Löfdahl, M. G. 2005, Sol. Phys., 228, 191
- Vissers & Rouppe van der Voort (2012) Vissers, G., & Rouppe van der Voort, L. 2012, ApJ, 750, 22
- Vissers et al. (2013) Vissers, G. J. M., Rouppe van der Voort, L. H. M., & Rutten, R. J. 2013, ApJ, 774, 32
- Vissers et al. (2015) Vissers, G. J. M., Rouppe van der Voort, L. H. M., Rutten, R. J., Carlsson, M., & De Pontieu, B. 2015, ApJ, 812, 11
- Watanabe et al. (2011) Watanabe, H., Vissers, G., Kitai, R., Rouppe van der Voort, L., & Rutten, R. J. 2011, ApJ, 736, 71
- Watanabe et al. (2008) Watanabe, H., Kitai, R., Okamoto, K., et al. 2008, ApJ, 684, 736
- Yan et al. (2015) Yan, L., Peter, H., He, J., et al. 2015, ApJ, 811, 48
- Yang et al. (2016) Yang, H., Chae, J., Lim, E.-K., et al. 2016, ApJ, 829, 100