Dynamics of the superconducting order parameter through ultrafast normal-to-superconducting phase transition in Bi2Sr2CaCu2O8+δ from multi-pulse polarization-resolved transient optical reflectivity
Abstract
A systematic temperature dependent study of the femtosecond optical superconducting (SC) state destruction and recovery in Bi2Sr2CaCu2O8+δ cuprate superconductor by means of the all-optical polarization-sensitive multi-pulse spectroscopy is presented. At low temperatures and a partial SC state suppression an anisotropic SC-gap recovery-timescale is suggested by the data. The SC state destruction and recovery dynamics are compared to the recent TR-ARPES-inferred SC-gap dynamics and a qualitative agreement is found. Using a phenomenological response function the experimental data are also compared to time dependent Ginzburg-Landau model simulations.
I Introduction
The study of the time evolution of complex systems through symmetry breaking transitions (SBT) is of great fundamental interest in different areas of physicsBunkov and Godfrin (2000); Higgs (1966); Volovik (2010). An SBT of particular general interest is the ultrafast normal-to-superconducting (NS) state transition. Due to the small heat capacity of the electronic system, an optical pulse can efficiently suppress the SC state without heating the low-frequency phonon heat bath, which remains well below the critical temperature (. This enables us to perform an ultrafast effective111The quasiparticle energy distribution is nonthermal so strictly speaking the electronic is not well defined. electron temperature quench across with an ultrashort laser pulse, which is then followed by an ultrafast non-equilibrium NS transition.
The ultrafast SNS transition in the cuprate superconductors has been initially studied by all-opticalCarnahan et al. (2004); Kusar et al. (2008); Giannetti et al. (2009); Toda et al. (2011); Beyer et al. (2011) pump-probe technique followed by laser ARPESSmallwood et al. (2012, 2014, 2015); Piovera et al. (2015). While the laser ARPES can directly resolve the momentum dependent222Limited to the vicinity to the nodal point on the -Y line. quasiparticle (QP) distribution function, all-optical techniques offer better bulk sensitivity and greater flexibility. The lack of momentum resolution of an optical probe can be partially compensated by use of the optical dipole transition selection rules that depend on the probe-photon polarizationDevereaux and Hackl (2007); Toda et al. (2014) and energyToda et al. (2011); Coslovich et al. (2013) and enable selection of different parts of the Brillouin zone (BZ).
The electronic Raman-scattering tensor analyses have shownDevereaux and Hackl (2007) that the dielectric tensor fluctuations of different symmetries can be linked to charge excitations in different parts of the BZ. In particular, in a D4h point-symmetry corresponding to the ideal CuO2-plane symmetry, the dielectric tensor fluctuations with the B1g and B2g symmetries are linked to the anti-nodal and nodal BZ charge excitations, respectively, while the totally symmetric A1g fluctuations do not discriminate between the regions. The transient reflectivity, , is related to the Raman tensor and in Bi2Sr2CaCu2O8+δ (Bi2212) the B1g-like333Despite Bi2212 is orthorhombic we use the ideal D4h point group tetragonal CuO2-plane symmetry to simplify the notation. See supplemental to Ref. [Toda et al., 2014] for details. transient reflectivity component shows sensitivity to the SC state only, while A1g-like and B2g-like transient reflectivity components couple to both the SC and pseudogap (PG) order.Toda et al. (2014)
While the all-optical transient response in the cuprates under weak excitation can be well described in terms of the photoinduced absorption of the photoexcited quasiparticlesKabanov et al. (1999) the response function in highly nonequilibrium states is unclear due to unknown relative contributions of collective and single-particle degrees of freedom to the transient optical reflectivity. To overcome this problem the standard two-pulse all-optical pump-probe technique was extended to a multi-pulse technique, which was shown to be instrumental in extracting the order parameter dynamics in a charge density wave compoundYusupov et al. (2010) as well as in the prototypical cuprate superconductor La1.9Sr0.1CuO4Madan et al. (2016).
Here we extend our previous studyMadan et al. (2016) of an ultrafast SNS transition in La1.9Sr0.1CuO4 to Bi2Sr2CaCu2O8+δ in search of universality, and also to uncover potential imporant differences in the two materials with substantially different critical temperatures and pseudogap/SC gap ratios. By means of the all-optical multi-pulse technique combined with the polarization selective optical probe we were able to separate the SC state recovery dynamics from the previously studiedMadan et al. (2015) PG state recovery dynamic and enable discrimination between relaxation in the nodal and anti-nodal BZ regions. The material has been studied previously by time-resolved techniquesGiannetti et al. (2009); Cortés et al. (2011); Toda et al. (2011); Smallwood et al. (2012, 2014, 2015), but thus far there has been no systematic study of the the non-equilibrium transitions in this material, especially by the 3-pulse technique.
While we found that in La1.9Sr0.1CuO4 the time dependent Ginzburg-Landau (TDGL) theory can provide a fair quantitative description of the SC order parameter recovery, only a qualitative description of the data is possible in Bi2212, which we attribute to the large SC order fluctuations in the PG state near time of the transition. In addition, when only a partial SC state suppression is achieved, the polarization resolved optical probe enables us to detect anisotropic SC-order recovery timescales, revealing a faster SC gap recovery in the anti-nodal direction in comparison with the nodal BZ regions.
II Experimental
The sample used in this work was underdoped Bi2Sr2CaCu2O8+δ (Bi2212) single crystal with 78 K () grown by means of the traveling solvent floating zone method. Before mounting into a liquid-He flow cryostat the sample was freshly cleaved using sticky tape.
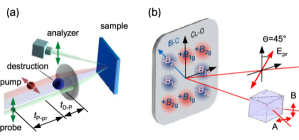
The pulse train from a 250-KHz 1.55-eV Ti:Sapphire regenerative amplifier was split into 50 fs destruction (D), pump (P) and probe (pr) pulse trains that were independently delayed with respect to each other. The resulting beams were focused and overlapped on the sample [see Fig. 1 (a)]. As in the standard pump-probe stroboscopic experiments the transient reflectivity was measured by monitoring the intensity of the weakest pr beam. The direct contribution of the unchopped D beam to was rejected by means of a lock-in synchronized to the chopper that modulated the intensity of the P beam only. The fluences J/cm2 and J/cm2 of the P and pr pulses were kept in the linear response region, well below the superconductivity destruction thresholdGiannetti et al. (2009); Stojchevska et al. (2011); Toda et al. (2011).
To select different components of the anisotropic transient reflectivityToda et al. (2014) two different polarization sensitive detection schemes were used. In the parallel detection scheme (PDS), which is sensitive to the sum of and components444As in Ref. Toda et al., 2014 we use the approximate notation corresponding to the tetragonal symmetry., , we used a single photodiode detection with an analyzer parallel to the pr-beam polarization, where the pr-beam polarization was parallel to the Cu-O bond direction. The polarizations of the P and D beams were perpendicular to the pr-beam polarization in order to suppress the signal due to P beam scattering.
In the balanced detection scheme (BDS), which is sensitive to the component only, the pr-beam polarization was oriented at 45° with respect to the Cu-O bond directions and two photodiodes in combination with a Wollaston prism were used for detection [see Fig. 1 (b)]. When the polarization axes of such detector are oriented along the Cu-O bond directions, the difference of the two photodiode photocurrents corresponds to , while and components are rejected. Fine alignment of the polarization and detector angles was done in the PG state at 120 K, to achieve a complete cancellation of the transient PG response.
In order to suppress the P beam scattering contribution to the signal in the BDS the P-beam frequency was doubled (3.1-eV P-photon energy) and a long-pass filter in front of the detector was used while the 1.55-eV D-photon energy was the same as in the first scheme.555The scattering from the D-beam does not contribute significantly since the beam is not modulated.

III Results
III.1 SC state destruction
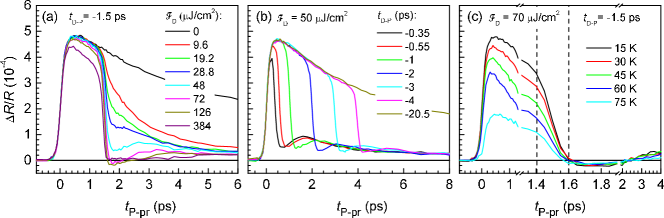
To illustrate the destruction of the SC state, in Fig. 2 we plot the transient reflectivity for the case when the D pulse arrives after the P pulse using the PDS. Depending on the D pulse fluence, , the transient reflectivity is suppressed to different degrees. Above J/cm2, SC order is completely suppressed on a 200-fs timescale after the D-pulse arrival. Above J/cm2 we observe also a small negative overshot lasting a few hundred femtoseconds followed by a weak recovery of the signal on a picosecond timescale. Both features vanish at the highest fluence of J/cm2. The suppression timescale does not depend on the D-pulse arrival time [Fig. 2 (b)] nor temperature [Fig. 2 (c)].
III.2 SC state recovery
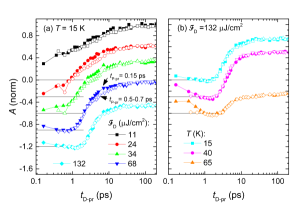
In Fig. 3 we show a typical transient reflectivity data set measured in the PDS for the case when the P pulse arrives after the D pulse. After a complete suppression for ps we first observe a recovery of the negative PG component on a ps timescale followed by the recovery of the positive SC component.
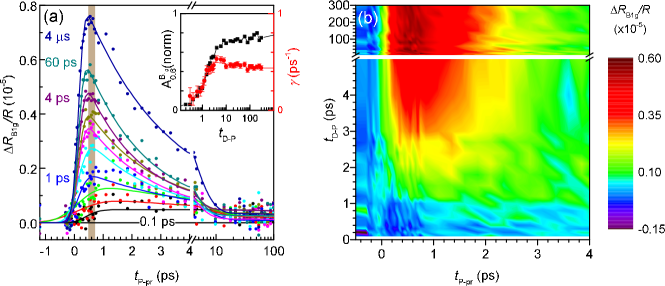
As shown previouslyToda et al. (2014) the PG response does not contribute to so recovery of the SC component on the short timescale can be observed more clearly in the BDS. In Fig. 4 we show a typical transient reflectivity data set measured using the BDS. As expected, the PG component is suppressed, but the signal-to-noise ratio is reduced due to a smaller amplitude.
IV Analysis and discussion
IV.1 SC state destruction
The destruction timescale of fs is and independent and faster than fs in LSCOKusar et al. (2008); Beyer et al. (2011). In LSCO it was suggestedKusar et al. (2008); Beyer et al. (2011) that the high energy optical phonons created during the relaxation of the primary photo electron-hole pair are the dominating pair breaking excitation setting the destruction timescale.
The faster destruction timescale in Bi2212 does not exclude the same phonon mediated destruction mechanism since one polar optical phonon can be generated by a photoexcited electron/hole every fsBeyer et al. (2011). Taking the initial photo electron/hole energy of eV and optical phonon energy of 50 meV leads to fs photo electron/hole energy relaxation time that is fast enough to be compatible with the experimental dataPerfetti et al. (2007). The phonon dominated pair-breaking destruction of the SC state is supported also by the large optical SC state destruction energy that is 5 times larger than the SC condensation energy.Stojchevska et al. (2011)
IV.2 Analysis of the SC state recovery
To analyze the recovery we first fit a finite-rise-time single-exponential relaxation model to the transient reflectivity in Fig. 4 to obtain the dependent relaxation rate . In the inset to Fig. 4 (a) we compare the relaxation rate from the fit to the amplitude of the SC response , where corresponds to the average of in the interval666In the vicinity of the peak of the unperturbed -response ps and to the transient reflectivity in the absence of the D pulse.
and initially recover on a similar time-scale of ps followed by slower dynamics extending towards the nanosecond timescale. As in the case of (La,Sr)CuO4+δ (LSCO), we attribute the suppression of during the first part of the recovery to the critical slowing down of the SC fluctuations in the vicinity of the transition.Madan et al. (2016) Upon the initial increase decreases on the nanosecond timescale indicating cooling of the probed volume: Since the effective temperature on longer timescales is far from the critical temperature the -dependence of is no longer critical but determined by the Rothwarf-Taylor bottleneck dynamics.Kabanov et al. (2005)
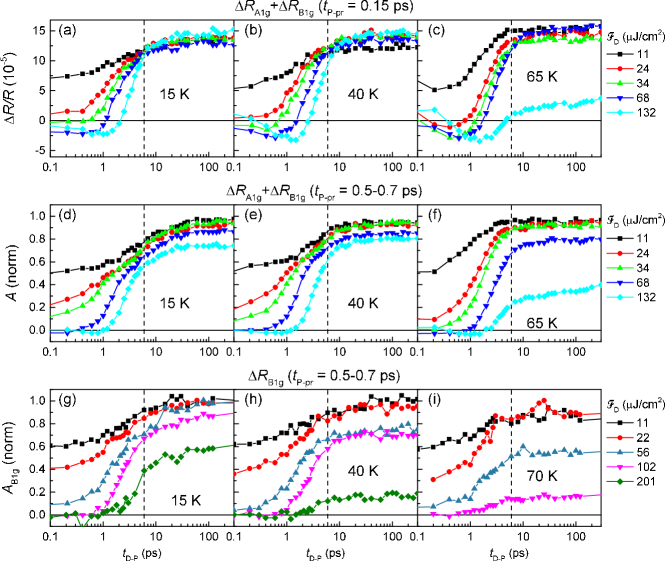
Contrary to LSCO, where the PG component shows no suppression up to a rather high excitation fluence,Kušar et al. (2011) the PG component in Bi2212 shows suppression already belowMadan et al. (2015) J/cm2 so also the PG component is affected by the D pulse. To extract the SC component recovery dynamics in the PDS it is therefore necessary to take the PG dynamics into account.
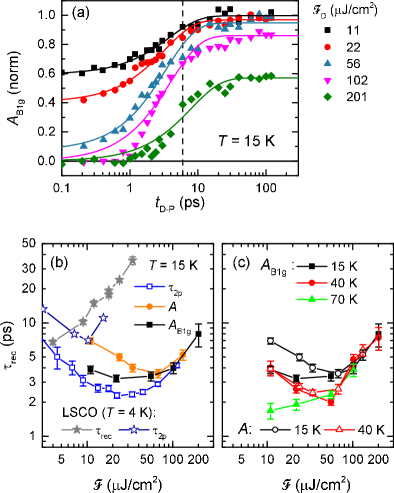
The PG component peaks at ps. Traces of at this as function of are shown in Fig. 5 (a-c). It is evident that at higher the PG recovery leads to non-monotonous traces due to the sub-ps recovery timescaleMadan et al. (2015) of the negative PG component preceding the recovery of the positive SC-state component. Due to the rather fast PG-component relaxation timeToda et al. (2014) [see Fig. 3 (a)] the contribution of the PG component to should diminish with increasing . Taking in the interval where has a peak777The has a peak at a slightly earlier time, where the PG component contribution is significantly larger. in the absence of the D pulse and the PG response is already suppressed, we calculate the normalized average, . Indeed, traces presented in Fig. 5 (d-f) show significantly less PG-component recovery and appear very similar to the equivalent traces shown in Fig. 5 (g-i).
At the PG recovers on the ps timescaleMadan et al. (2015). To check whether the amplitude of the PG component is modified during the slower SC state recoveryCoslovich et al. (2013) we compare in Fig. 6 the two readouts with different PG contribution taken at ps and the average in the interval (). At the highest J/cm2 it is possible to overlap the traces beyond ps at all measured temperatures when plot as a function of888The difference in sampling time of 0.55 ps needs to be taken into account when directly comparing the traces. by vertically shifting999The fully recovered PG component contributes to a -independent negative shift at longer . and rescaling. At intermediate s the complete overlap is not possible. The shifted and rescaled readouts at ps show slightly higher values in the - -ps delay range. This could indicate that the negative PG response at 1.55-eV probe-photon energy is transiently suppressed101010When the negative PG component is suppressed the total increases. by the appearance of the SC order.
A possibly related suppression of the PG component in the SC state at 1.08-eV probe-photon energy was suggested recentlyCoslovich et al. (2013). Considering an earlier reportToda et al. (2011), however, where by selecting a particular polarization and probe-photon energy no suppression of the PG component in the SC state was observed, we attribute the difference between readouts in our experiment to the SC-gap dependent pre-bottleneck SC-state dynamics, which influences the readouts at ps.
IV.3 SC state recovery timescale in nodal and anti-nodal response
In Fig. 7 (b) we compare the fluence dependencies of the SC recovery time, , for both symmetries to the standard 2-pulse transient-reflectivity relaxation time, . We estimate using a phenomenological exponential fit:
| (1) |
to the trajectories in Fig. 5(d)-(i). The lower data can be rather well fit using the simple single-exponential recovery model (1) while at higher the recovery appears clearly non exponential as shown in Fig 7 (a).
As a function of fluence both, and show a minimum at intermediate fluences. Above 100 J/cm2 timescales of different signals match rather well111111Despite the worse fit quality. and show virtually no -dependence [see Fig. 7 (c)]. At low and K, however, the A1g-dominated-channel slows down much more with decreasing than the B1g-channel and . On the contrary, at K, both, the A1g-dominated- and B1g-channel show identical fluence dependence in the full range with a sharp up-turn at J/cm2.
A faster relaxation in the B1g configuration has been observed already in the low excitation 2-pulse experiments.Toda et al. (2014) Due to the sensitivity of the the B1g configuration to the anti-nodal Brillouin-zone (BZ) region this is consistent with a faster quasiparticle relaxation around anti-nodes121212An consistent increase of the QP relaxation time away from the nodal point was observed in a recent ARPES experimentSmallwood et al. (2015) in some controversy to an earlier ARPES resultCortés et al. (2011). either by recombination or by scattering into the nodal BZ region, which contributes to the A1g-dominated channel showing a slower decay.
The effect of the faster antinodal quasiparticle relaxation is also evident in our 3-pulse experiment, but only, when the SC order is not completely suppressed and is below K. From the 3-pulse data it appears that upon a modest suppression the SC gap recovers faster at the anti-nodes than near the nodes.
At higher upon a complete suppression of the SC gap our data suggest the recovery that is more homogeneous across the Fermi surface. This could be attributed to two factors. First, during the initial part of the recovery the suppression of the Rothwarf-Taylor phonon bottleneckKabanov et al. (2005) and lifting of the SC-gap-imposed QP-relaxation phase space restrictionsSmallwood et al. (2016) enable efficient transfer of the excess QP energy to the phonon bath together with efficient diffusion of excitations across all of the BZ. Second, at higher the lattice bath is heated closer to so the QP-relaxation phase space restrictions can be easier overcome by the phonon assisted QP scattering.
In LSCO [Fig. 7 (b)] is similarly to significantly longer than in Bi2212.Toda et al. (2011) The generally slower and in LSCO could be attributed to the smaller SC gap enhancing the quasiparticle relaxation bottleneckKabanov et al. (1999). Moreover, in LSCO increases monotonically above the destruction threshold fluence,Kusar et al. (2008) J/cm2, while in Bi2212 withToda et al. (2011) J/cm2, the increase starts only above . This could be attributed to the lattice temperature after the quench being closer131313In LSCO the lattice temperature after the destruction pulse reachesMadan et al. (2016) at J/cm2. to in LSCO than in Bi2212 resulting in a stronger critical slowing down of the SC order parameter dynamics.
IV.4 Time dependent Ginzburg-Landau model
We proceed by analyzing the trajectory of the SC amplitude through the transition in the framework of the time-dependent Ginzburg-Landau (TDGL) theory. In previous studyMadan et al. (2016) of the SC-order recovery in LSCO we have shown that the TDGL theory fails to consistently describe the ultrafast optical destruction of the SC condensate. On the other hand, the SC condensate recovery can be quantitatively modeled using a phenomenological response function and the Ginzburg-Landau time, , as the only free fit parameter assuming a finite magnitude of the initial depth-dependent order parameter (Fig. 3c in Ref. [Madan et al., 2016]). The magnitude of the initial order parameter corresponds to the magnitude of the frozen SC fluctuations after the quench from the normal/PG to the SC state which is a function of the depth-dependent quench-rate (Eq. (4) in Ref. [Madan et al., 2016]). In LSCO even better fit is possible using a phenomenological depth-dependent initial order parameter :
| (2) |
where is an additional -dependent free parameter, the depth-dependent absorbed optical-energy density and the SC-destruction-threshold optical-energy density.
In the following we apply a similar TDGL approach to the SC state recovery dynamics in Bi2212.
IV.4.1 Response function
As a starting point one needs to establish the relation between the superconducting order parameter magnitude, , and the transient optical response amplitude. This relation was in the case of LSCO established phenomenologically from the temperature dependence of the normalized weak-excitation amplitude, .
In Bi2212 does not go to zero at due to the large pairing fluctuationsZhang et al. (2013); Madan et al. (2014) above as shown in Fig. 8 (a), inconsistently with the the GL theory. However, by taking into account that is sensitive to the paring amplitudeMadan et al. (2014) and not the SC phase coherence, we can still apply the GL description assuming that only the SC phase coherence is established at , while the largest temperature at which is still observable corresponds to the mean-field pairing critical temperature, K. Implying the standard GL -dependence of the (pairing) order parameter, , we can now establish the response function as shown in Fig. 8(b).


To further analyze the link between the SC order parameter and we compare our results to recent TR-ARPES gap dynamics data in near-optimally doped Bi2212 ( K).Smallwood et al. (2014) Considering the different doping levels of the samples and different spatial141414The optical penetration depth in Bi2212Stojchevska et al. (2011) is of the order of 100 nm in comparison to a nm scale photelectron escape depth. and reciprocal-space151515The B1g optical response is sensitive to a broad region near the anti node while the A1g response samples both the nodal and antinodal regionsDevereaux and Hackl (2007) sensitivity of the probes only a qualitative correspondence between the results is expected, since even in the case of TR-ARPES the extraction of the SC gap is not rigorously definedSmallwood et al. (2014). For the sake of comparison we therefore assume that , where corresponds to the TR-ARPES gap at the edge of the Fermi arc and calculate using the response function in Fig. 8(b). In Fig. 8 (c) and (d) we show comparison of our data to both, and the TR-ARPES gap, .
For the B1g configuration we find a surprisingly good match between and AB1g in the low fluence 161616Due to the exponential decay of the excitation fluence away from the surface the equivalent external in all-optical experiment is times larger than in the case of TR-ARPES. region, where the SC gap is only partially suppressed. At higher , where the gap171717The surface gap in the case of TR-ARPES and the bulk gap in the case of optics. is completely suppressed, the dynamics appears significantly different below ps, unless we compare curves with very different fluences. Ignoring the response function a direct comparison of at J/cm2 to at 4.4 times higher J/cm2 gives a good match in the region of the strong suppression of the gap.
For the dominated configuration a better match is observed when we compare to directly [Fig. 8 (d)] while shows consistently higher magnitude than . Similarly to the B1g configuration, a good match is observed at a complete SC gap suppression between the TR-ARPES trajectory at J/cm2 and at 4.5 times higher J/cm2.
Assuming that the TR-ARPES SC gap dynamics is identical to the bulk gap dynamics the difference between the fluences of the corresponding-timescales data can be, at least partially1616footnotemark: 16, attributed to the smearing of the optical-probe dynamics due to the depth-dependent excitation density and SC gap suppression. This is corroborated by the convergence of the optical and TR-ARPES trajectories with similar fluence on longer timescales, when the spatial inhomogeneity is expected to decrease.
The inaccuracy of the empirical response function [Fig. 8 (b)] can further contribute to the difference, especially in the region of small SC order parameter. Contrary to LSCOMadan et al. (2016) where the response function is linear up to the s-shape of the response function in the present case suggests that might be underestimated for low values of the gap.
Importantly, taking into account the inherent differences between the techniques we can conclude that the TR-ARPES Fermi-arc SC gap and the antinodal SC gap inferred from the B1g channel multi-pulse optical probe show qualitatively identical suppression and recovery dynamics.
IV.4.2 Simulations
As in the case of LSCOMadan et al. (2016) we simulate the evolution of the order parameter through the transition by solving the dimensionless form of the first of the two TDGL equations:
| (3) |
where time and length are measured in units of (fit parameter) and the coherence length, respectively. is a time- and depth-dependent reduced temperature which is the solution of the three temperature modelPerfetti et al. (2007) combined with the heat diffusion equation.Madan et al. (2016)
We neglect the second TDGL equation and any lateral variation of the order parameter, assuming that all the Kibble-Zurek (KZ) physicsKibble and Volovik (1997); Zurek (1996) can be phenomenologically absorbed into the initial order parameter using (2), and the phase dynamics, i.e. the dynamics of vortices, does not significantly modify the order parameter amplitude.
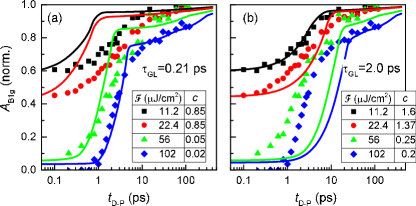
The two fitting parameters and are rather independent. While the first defines the Kible-Zurek-physics-related amplitude of the response at , the second defines the time-scale of the recovery. In Fig. 9 we present typical results of the simulations for two different values of the optimized to fit the highest- and the lowest- trajectories at 15 K, respectively. One can see that while a decent agreement for a targeted curve can be achieved, one needs to significantly vary to fit the complete data set. Since such variation is unphysical, we can state that the presented TDGL approach is only sufficient to describe the present data qualitatively, contrary to what was found in LSCO, where a more quantitative description is possible.
The lack of quantitative description can not be attributed to the omission of the second TDGL equation and the resulting vortex dynamics it describes. While at a partial SC-state order parameter suppression no KZ-vortices formation is expected more vortices would be created with further suppression. The presence of vortices at increased order parameter suppression is expected to further slow down the SC-state recovery181818Supplemental information to Ref. [Madan et al., 2016] . Looking at Fig. 9 one can clearly see, that even without the vortex dynamics the TDGL solutions display a stronger recovery-timescale slowdown with increased order parameter suppression than the experimental data, so inclusion of the vortex dynamics into modeling is expected to only increase the discrepancy.
On the other hand, the lack of quantitative description is not very surprising due to the large pairing fluctuations contributionMadan et al. (2014) to the transient reflectivity above that prevents strict applicability of the TDGL theory and undermine the phenomenological link between the order parameter magnitude and the experimentally observable .
V Summary an conclusions
Our systematic investigation of the ultrafast optical suppression and recovery of the superconducting state in Bi2Sr2CaCu2O8+δ by means of polarization-selective multi-pulse optical time-resolved spectroscopy leads to some interesting, and somewhat surprising new findings. We found that the SC order is suppressed on the 200-fs timescale, comparable to the recent laser TR-ARPESSmallwood et al. (2014) results. The destruction timescale is independent of the temperature and optical destruction pulse energy and is consistent with a photoexcited carrier energy-transfer to the high-energy pair breaking phonons.
The recovery of the SC order is slower appearing on the 2-8 ps timescale showing non-monotonous dependence on the destruction pulse energy. At low and a partial SC-state suppression the data shows that the SC gap in the antinodal region recovers faster than near the nodes. Perhaps surprisingly, the recovery also slows down with decreasing highlighting the importance of thermal fluctuations in the recovery mechanism. When the SC state is strongly suppressed, the recovery becomes non-exponential with the recovery timescale slowing down, becoming -independent.
The fact that the antinodal SC order parameter recovery dynamics inferred from the B1g channel and the TR-ARPES Fermi-arc SC gap dynamicsSmallwood et al. (2014) show qualitatively identical recovery dynamics gives us confidence in the significance of the multipulse technique.
Despite strong SC fluctuations above and the anisotropic SC-gap recovery the time dependent Ginzburg-Landau model qualitatively describes the SC-order temporal dynamics reasonably well, considering its limitations.
Acknowledgements.
The authors acknowledge the financial support of Slovenian Research Agency (research core funding No-P1-0040) and European Research Council Advanced Grant TRAJECTORY (GA 320602) for financial support. We would like to thank L. Stojchevska for helping with the measurements.References
- Bunkov and Godfrin (2000) Y. M. Bunkov and H. Godfrin, Topological Defects and the Non-Equilibrium Dynamics of Symmetry Breaking Phase Transitions, edited by Y. M. Bunkov and H. Godfrin (Springer Netherlands, Dordrecht, 2000) p. 396.
- Higgs (1966) P. W. Higgs, Physical Review 145, 1156 (1966).
- Volovik (2010) G. Volovik, Contemporary Physics, 5 (Oxford university press, 2010) pp. 451–452.
- Note (1) The quasiparticle energy distribution is nonthermal so strictly speaking the electronic is not well defined.
- Carnahan et al. (2004) M. Carnahan, R. Kaindl, J. Orenstein, D. Chemla, S. Oh, and J. Eckstein, Physica C: Superconductivity 408, 729 (2004).
- Kusar et al. (2008) P. Kusar, V. V. Kabanov, J. Demsar, T. Mertelj, S. Sugai, and D. Mihailovic, Physical Review Letters 101, 227001 (2008).
- Giannetti et al. (2009) C. Giannetti, G. Coslovich, F. Cilento, G. Ferrini, H. Eisaki, N. Kaneko, M. Greven, and F. Parmigiani, Physical Review B 79, 224502 (2009).
- Toda et al. (2011) Y. Toda, T. Mertelj, P. Kusar, T. Kurosawa, M. Oda, M. Ido, and D. Mihailovic, Physical Review B 84, 174516 (2011).
- Beyer et al. (2011) M. Beyer, D. Städter, M. Beck, H. Schäfer, V. V. Kabanov, G. Logvenov, I. Bozovic, G. Koren, and J. Demsar, Phys. Rev. B 83, 214515 (2011).
- Smallwood et al. (2012) C. L. Smallwood, J. P. Hinton, C. Jozwiak, W. Zhang, J. D. Koralek, H. Eisaki, D.-H. Lee, J. Orenstein, and A. Lanzara, Science 336, 1137 (2012), http://science.sciencemag.org/content/336/6085/1137.full.pdf .
- Smallwood et al. (2014) C. L. Smallwood, W. Zhang, T. L. Miller, C. Jozwiak, H. Eisaki, D.-H. Lee, and A. Lanzara, Phys. Rev. B 89, 115126 (2014).
- Smallwood et al. (2015) C. L. Smallwood, W. Zhang, T. L. Miller, G. Affeldt, K. Kurashima, C. Jozwiak, T. Noji, Y. Koike, H. Eisaki, D.-H. Lee, R. A. Kaindl, and A. Lanzara, Phys. Rev. B 92, 161102 (2015).
- Piovera et al. (2015) C. Piovera, Z. Zhang, M. d’Astuto, A. Taleb-Ibrahimi, E. Papalazarou, M. Marsi, Z. Z. Li, H. Raffy, and L. Perfetti, Phys. Rev. B 91, 224509 (2015).
- Note (2) Limited to the vicinity to the nodal point on the -Y line.
- Devereaux and Hackl (2007) T. P. Devereaux and R. Hackl, Reviews of Modern Physics 79, 175 (2007).
- Toda et al. (2014) Y. Toda, F. Kawanokami, T. Kurosawa, M. Oda, I. Madan, T. Mertelj, V. V. Kabanov, and D. Mihailovic, Physical Review B 90, 094513 (2014).
- Coslovich et al. (2013) G. Coslovich, C. Giannetti, F. Cilento, S. Dal Conte, T. Abebaw, D. Bossini, G. Ferrini, H. Eisaki, M. Greven, A. Damascelli, and F. Parmigiani, Phys. Rev. Lett. 110, 107003 (2013).
- Note (3) Despite Bi2212 is orthorhombic we use the ideal D4h point group tetragonal CuO2-plane symmetry to simplify the notation. See supplemental to Ref. [\rev@citealpnumToda2014] for details.
- Kabanov et al. (1999) V. V. Kabanov, J. Demsar, B. Podobnik, and D. Mihailovic, Phys. Rev. B 59, 1497 (1999).
- Yusupov et al. (2010) R. Yusupov, T. Mertelj, V. V. Kabanov, S. Brazovskii, P. Kusar, J.-H. Chu, I. R. Fisher, and D. Mihailovic, Nature Physics 6, 681 (2010).
- Madan et al. (2016) I. Madan, P. Kusar, V. V. Baranov, M. Lu-Dac, V. V. Kabanov, T. Mertelj, and D. Mihailovic, Physical Review B 93, 224520 (2016).
- Madan et al. (2015) I. Madan, T. Kurosawa, Y. Toda, M. Oda, T. Mertelj, and D. Mihailovic, Nature Communications 6, 6958 (2015), arXiv:1410.3205 .
- Cortés et al. (2011) R. Cortés, L. Rettig, Y. Yoshida, H. Eisaki, M. Wolf, and U. Bovensiepen, Phys. Rev. Lett. 107, 097002 (2011).
- Stojchevska et al. (2011) L. Stojchevska, P. Kusar, T. Mertelj, V. Kabanov, Y. Toda, X. Yao, and D. Mihailovic, Physical Review B 84, 180507 (2011).
- Note (4) As in Ref. \rev@citealpnumToda2014 we use the approximate notation corresponding to the tetragonal symmetry.
- Note (5) The scattering from the D-beam does not contribute significantly since the beam is not modulated.
- Perfetti et al. (2007) L. Perfetti, P. A. Loukakos, M. Lisowski, U. Bovensiepen, H. Eisaki, and M. Wolf, Phys. Rev. Lett. 99, 197001 (2007).
- Note (6) In the vicinity of the peak of the unperturbed -response.
- Kabanov et al. (2005) V. V. Kabanov, J. Demsar, and D. Mihailovic, Physical Review Letters 95, 147002 (2005).
- Kušar et al. (2011) P. Kušar, V. V. Kabanov, S. Sugai, J. Demšar, T. Mertelj, and D. Mihailović, Journal of superconductivity and novel magnetism 24, 421 (2011).
- Note (7) The has a peak at a slightly earlier time, where the PG component contribution is significantly larger.
- Note (8) The difference in sampling time of 0.55 ps needs to be taken into account when directly comparing the traces.
- Note (9) The fully recovered PG component contributes to a -independent negative shift at longer .
- Note (10) When the negative PG component is suppressed the total increases.
- Kusar (2007) P. Kusar, Influence of Irregularities and Dimensionality on Electron Relaxation, Ph.D. thesis, Faculty of Mathemathics and Physics, University of Ljubljana, Slovenia (2007).
- Note (11) Despite the worse fit quality.
- Note (12) An consistent increase of the QP relaxation time away from the nodal point was observed in a recent ARPES experimentSmallwood et al. (2015) in some controversy to an earlier ARPES resultCortés et al. (2011).
- Smallwood et al. (2016) C. L. Smallwood, T. L. Miller, W. Zhang, R. A. Kaindl, and A. Lanzara, Phys. Rev. B 93, 235107 (2016).
- Note (13) In LSCO the lattice temperature after the destruction pulse reachesMadan et al. (2016) at J/cm2.
- Zhang et al. (2013) W. Zhang, C. L. Smallwood, C. Jozwiak, T. L. Miller, Y. Yoshida, H. Eisaki, D.-H. Lee, and A. Lanzara, Phys. Rev. B 88, 245132 (2013).
- Madan et al. (2014) I. Madan, T. Kurosawa, Y. Toda, M. Oda, T. Mertelj, P. Kusar, and D. Mihailovic, Scientific Reports 4, 5656 (2014).
- Note (14) The optical penetration depth in Bi2212Stojchevska et al. (2011) is of the order of 100 nm in comparison to a nm scale photelectron escape depth.
- Note (15) The B1g optical response is sensitive to a broad region near the anti node while the A1g response samples both the nodal and antinodal regionsDevereaux and Hackl (2007).
- Note (16) Due to the exponential decay of the excitation fluence away from the surface the equivalent external in all-optical experiment is times larger than in the case of TR-ARPES.
- Note (17) The surface gap in the case of TR-ARPES and the bulk gap in the case of optics.
- Kibble and Volovik (1997) T. W. B. Kibble and G. E. Volovik, Journal of Experimental and Theoretical Physics Letters 65, 102 (1997).
- Zurek (1996) W. Zurek, Physics Reports 276, 177 (1996).
- Note (18) Supplemental information to Ref. [\rev@citealpnumMadan2016].