ALMA Maps of Dust and Warm Dense Gas Emission in the Starburst Galaxy IC 5179⋆
Abstract
We present our high-resolution (, 34 pc) observations of the CO (65) line emission, which probes the warm and dense molecular gas, and the 434 m dust continuum emission in the nuclear region of the starburst galaxy IC 5179, conducted with the Atacama Large Millimeter Array (ALMA). The CO (65) emission is spatially distributed in filamentary structures with many dense cores and shows a velocity field that is characteristic of a circum-nuclear rotating gas disk, with 90% of the rotation speed arising within a radius of pc. At the scale of our spatial resolution, the CO (65) and dust emission peaks do not always coincide, with their surface brightness ratio varying by a factor of 10. This result suggests that their excitation mechanisms are likely different, as further evidenced by the Southwest to Northeast spatial gradient of both CO-to-dust continuum ratio and Pa- equivalent width. Within the nuclear region (radius300 pc) and with a resolution of 34 pc, the CO line flux (dust flux density) detected in our ALMA observations is Jy km s-1 ( mJy), which account for 22% (2.4%) of the total value measured by Herschel.
Subject headings:
galaxies: active — galaxies: nuclei — galaxies: ISM — galaxies: starburst — galaxies: evolution — submillimeter: galaxies1. Introduction
Luminous infrared galaxies (LIRGs; [81000 ) are a mixture of single galaxies, galaxy pairs, interacting systems and advanced mergers (e.g. Haan et al. 2011, 2013; Petty et al. 2014; Larson et al. 2016; Psychogyios et al. 2016), and their space density exceeds that of optically selected starburst and Seyfert galaxies (AGNs) at comparable bolometric luminosity (Soifer et al. 1987). Compared to less luminous galaxies, LIRGs host a higher fraction of AGN, and exhibit enhanced star formation rates (SFR), usually in the nuclear region (Sanders & Mirabel 1996). At redshift , they dominate the cosmic SFR density (Le Flóch et al. 2005; Caputi et al. 2007; Magnelli et al. 2009, 2011; Gruppioni et al. 2013; though generally high- LIRGs may have different physical properties compared to their local counterparts (Iono et al. 2009; Menendez-Delmestre et al. 2009). Thus, a detailed study of local LIRGs is critical to our understanding of the star formation, cosmic evolution of galaxies and AGNs.
LIRGs (including ultra-LIRGs, i.e. ) in local Universe are all known to be extremely rich in molecular gas, with the ratio of total H2 to H i mass typically 1 (Sanders & Mirabel 1996). While the CO (10) line has been widely used to trace the total molecular gas content, star formation occurs in the denser parts of molecular gas clouds as evidenced by the tight correlations between and dense gas tracers such as HCN and CS (e.g., Gao & Solomon 2004; Wu et al. 2005; Zhang et al. 2014; Privon et al. 2015). Since star formation is expected to heat up the surrounding molecular gas substantially, the resulting warm dense gas can be better traced by the mid- (e.g. ) CO line transitions, which have critical densities () of a few times cm-3, and excitation temperatures of K (Carilli & Walter 2013).
Indeed, using the Herschel Space Observatory (hereafter Herschel; Pilbratt et al. 2010) SPIRE Fourier Transform Spectrometer (FTS; Griffin et al. 2010) data on a flux-limited subsample of nearby LIRGs selected from the Great Observatories All-Sky LIRG Survey (GOALS; Armus et al. 2009), Lu et al. (2014, 2017) found that, at galactic scales, SFR (as probed by ) correlated much better with the (65) and (76) transitions of CO, rather than with the low- ones (). This result has been confirmed by Liu et al. (2015) on an expanded sample also including nearby normal galaxies and star-forming regions, in which the authors showed that the best correlations (i.e. smallest dispersion) are between mid- CO line emission and IR continuum emission (i.e. the star formation law). However, at smaller scale (e.g. kpc, depending on the specific transition), these correlations start to show larger dispersion and/or deviate from the general relations (e.g. Figure 1 in Liu et al. 2015). Furthermore, our earlier Atacama Large Millimeter Array (ALMA; Wootten & Thompson 2009) high-resolution imaging of several LIRGs in CO (65) (Xu et al. 2014, 2015; Zhao et al. 2016b) also showed evidence of the breakdown of star formation law at a physical scale of 100 pc.
| Basic Properties | |||||||
|---|---|---|---|---|---|---|---|
| Name | R.A. (J2000) | Decl. (J2000) | Morph. | Spectral Type | |||
| (hh:mm:ss) | (dd:mm:ss) | (Mpc) | (km s-1) | () | |||
| (1) | (2) | (3) | (4) | (5) | (6) | (7) | (8) |
| IC 5179 | 22:16:09.10 | 36:50:37.4 | 51.4 | 3422 | SA(rs)bc | Starburst | 11.24 |
| ALMA Observation Log | |||||||
| SB | Date | Time (UTC) | Configuration | ||||
| (yyyy/mm/dd) | (m) | (min) | (K) | ||||
| (1) | (2) | (3) | (4) | (5) | (6) | (7) | (8) |
| X87b480_Xb68 | 2014/07/26 | 03:10:5904:48:15 | C34-5 | 27 | 820 | 39.44 | |
| Xa25bbf_X881e | 2015/06/07 | 08:14:0610:08:44 | C34-5 | 35 | 784 | 44.15 | |
| Xb47876_X1665 | 2016/06/18 | 07:53:2808:47:15 | C36-4 | 42 | 650 | 17.94 | |
Note. — For basic properties. Column 1: source name; Columns 2 and 3: right ascension and declination; Column 4: luminosity distance (we use to get angular size distance); Column 5: Heliocentric velocity from NASA/IPAC extragalactic database (NED); Column 6: morphology classification from NED; Column 7: Nuclear activity classification; Column 8: total infrared luminosity. For ALMA observation log. Column 1: schedule-block number; Column 2 and 3: observation date and time; Column 4: configuration; Column 5: number of usable antennae; Column 6: maximum baseline length; Column 7: on-source integration time; Column 8: median system temperature of different SPWs.
However, the CO (65) line is extremely difficult to observe in nearby galaxies using ground-based facilities, even with ALMA, and thus high-resolution (kpc) interferometric observations, mostly thanks to ALMA but also the SMA, are available only for a handful of sources: Arp 220 (Matsushita et al. 2009; Rangwala et al. 2015), VV 114 (Sliwa et al. 2013), NGC 34 (Xu et al. 2014), NGC 1068 (García-Burillo et al. 2014, 2016), NGC 1614 (Sliwa et al. 2014; Xu et al. 2015; Saito et al. 2017); NGC 253 (Krips et al. 2016), NGC 7130 (Zhao et al. 2016b), and IRAS13120-5453 (Sliwa et al. 2017). Among these observations, about two thirds have physical resolutions of 100 pc, and only the data for NGC 1068 (García-Burillo et al. 2014, 2016) have achieved a physical resolution better than 50 pc due to its much closer distance compared to other targets (except for NGC 253).
In order to study the properties of warm molecular gas and cold dust, and their relations to star formation in more details, we have initiated a multi-cycle ALMA program to observe the nuclear regions in representative LIRGs from our FTS sample to map simultaneously the CO (65) line emission (rest-frame frequency GHz) and the dust continuum emission at 434 m, with an ultimate goal of reaching a physical resolution of 50 pc, i.e. the typical size of a Galactic giant molecular cloud (GMC; Solomon et al. 1979), or less. Our ALMA targets include NGC 34 (Xu et al. 2014) and NGC 1614 (Xu et al. 2015) from the Cycle-0 observations, NGC 7130 (Zhao et al. 2016b) from the Cycle-2 observations, and IC 5179 of which the data presented here are combined from 3 independent observing campaigns across Cycles 2 and 3. The Cycle-0 sources represent advanced mergers with a very warm far-infrared (FIR) color (e.g. the IRAS 60-to-100 m ratio 1), whereas the Cycle-2 targets have FIR colors () more representative of typical LIRGs, covering both compact nuclear core and circumnuclear disk configurations visible in the high-resolution Pa- images of Alonso-Herrero et al. (2002; 2006), and whether there exists a significant AGN contribution to the ionized gas heating based on the [Ne v] observation of Petric et al. (2011).
Our previous studies have illustrated the different morphologies in the CO (65) emission within the nuclear regions of the three LIRGs: a rotating disk in NGC 34 (Xu et al. 2014), a rotating ring in NGC 1614 (Xu et al. 2015), and co-rotating clouds in NGC 7130 (Zhao et al. 2016b). Moreover, the CO (65) in NGC 7130 shows a unique double-lobed structure, well consistent with the dust lanes in the optical/near-infrared images. Furthermore, there seems to be a trend in the sense that the nuclear region (with a diameter of about 500 pc) contains a smaller fraction of the dense gas emission as the FIR color becomes cooler.
Whereas NGC 7130 is a peculiar spiral accompanied by two dwarf galaxies, and hosts an AGN, IC 5179 is an isolated, pure starburst galaxy (Veillux et al. 1995) with a morphology type of SA(rs)bc (de Vaucouleurs et al. 1991). The star formation activities in IC 5179 are widespread as demonstrated by the H emission (Lehnert & Heckman 1995), and numerous H ii regions are distributed in the spiral arms (Alonso-Herrero et al. 2006). Its inclination angle of 63∘, calculated by using the axis ratio from Lehnert & Heckman (1995), indicates that we nearly have an edge-on view of this source. At its distance (angular size distance) of 50.2 Mpc, 1″ corresponds to 244 pc. As shown in Armus et al. (2009), IC 5179 has , and , which make it the least luminous and coldest target in our ALMA sample. The nucleus is the most obscured region in this galaxy (Piqueras López et al. 2013), with annular mean (derived using the Br-/Br- ratio) in the range of 5-10 mag, consistent with that obtained from the near-IR (NIR) colors (Díaz-Santos et al. 2008).
Previous single-dish observations of low- 12CO and 13CO transitions (Mirabel et al. 1990; Garay et al. 1993) in IC 5179 show that these lines have multiple peaks. The 12CO (10) to 13CO (10) line ratio is 9, consistent with the value for normal galaxies (Sage & Isbell 1991) but much smaller than that for starburst mergers (Taniguchi & Ohyama 1998). The CO spectral line energy distribution (SLED) of IC 5179 observed by Herschel peaks at (Lu et al. 2017), whereas the CO (43) to (10) line ratio is about 0.3 based on the Herschel and SEST 15-m data (the beams at these frequencies are roughly the same, i.e., 45″; Mirabel et al. 1990; Garay et al. 1993; Chini et al. 1996; Albrecht et al. 2007). Therefore, the CO SLED of IC 5719 is closer to those of high- submillimeter galaxies (e.g., Casey et al. 2014) compared to most local (U)LIRGs which have significantly warmer CO SLEDs.
The remainder of this paper is organized as follows. We report our observations and data reduction in Section 2, present the results and discussion in Section 3, and briefly summarize the main conclusions in the last section. Throughout the paper, we adopt a Hubble constant of km s-1 Mpc-1, , and , which are based on the five-year WMAP results (Hinshaw et al. 2009), and are the same as those used by the GOALS project (Armus et al. 2009).
2. Observations and Data Reduction
The observations of the central region of IC 5179 in CO (65) were conducted using the Band 9 receivers of ALMA in the time division mode with a velocity resolution of 6.8 km s-1. The four basebands (i.e., “Spectral Windows”; SPWs 0-3) were centered at the sky frequencies of 683.6, 685.4, 679.9, and 681.8 GHz, respectively, each with a bandwidth of about 2 GHz. The data were collected thrice (two in Cycle-2, program ID: 2013.1.00524.S, PI: N. Lu, and one in Cycle-3, Program ID: 2015.1.00385.S, PI: N. Lu) in excellent weather conditions (, respectively) but about 1 year apart from each successful observation. During the observations, the relatively extended configurations C34-5 and C36-4 , using up to 32, 37 and 42 12-m antennae (5, 2, and 0 out of which had problematic data; Table 1), were adopted. The total on-source integration time was 101 minutes. During the observations, the phase and gain variations were monitored using J2258-2758, J2258-2758 and J2151-3027, respectively.
The data were reduced with CASA 4.6.0 (McMullin et al. 2007). The primary beam is , and the maximum recoverable scale is . The calibrated datasets were combined and cleaned using the Briggs weightings with robust=0.5, and have nearly identical synthesized beams for the line and continuum emission, with the full width of half maximum (FWHM) of , corresponding to physical scales of 37 pc32 pc, and a position angle (P.A.; north to east) of . The continuum was measured using data in SPWs 0-3 by excluding the line emission channels. For the CO (65) line emission, the cube was generated using the data in SPW-0, which encompasses the CO (65) emission at the systematic velocity (3422 km s-1; optical) with an effective bandpass of about 750 km s-1. The astrometric accuracy of these ALMA observations is better than , whereas the relative position accuracy is about synthesized beam/signal-to-noise ratio111https://help.almascience.org/index.php?/Knowledgebase/Article/View/153/6/what-is-the-astrometric-position-accuracy-of-an-alma-observation. Therefore, the relative position accuracies of the peak emission are about 5 and 6 mas, for our continuum and integrated line emission maps, respectively.
Since there are large time gaps among our observations, and the flux calibrators for each observation are different, we also imaged each dataset separately to check quality and flux consistency. For each dataset, we found that the synthesized beams (area) are times larger than the aforementioned value, and the flux varies by an factor of 15% (37%) for the line (continuum) emission. Unless otherwise stated, flux measurements are based on the images after the primary beam correction, whereas all of the figures are produced using the results before the primary beam correction.
In order to increase the signal-to-noise ratio, we binned spectral cubes into channels with the width of km s-1. The noise for these channel maps in CO (65) is in the range of mJy beam-1. For the continuum, the rms noise is about 0.4 mJy beam-1, and for the integrated CO (65) line emission map, which is integrated over the barycentric velocity range of 3522 km s-1 in the datacube of 14 km s-1 channel maps, it is 0.46 Jy km s-1 beam-1. All noise measurements were performed on the maps before the primary beam correction.
3. Results and Discussion
3.1. CO (65) Line Emission
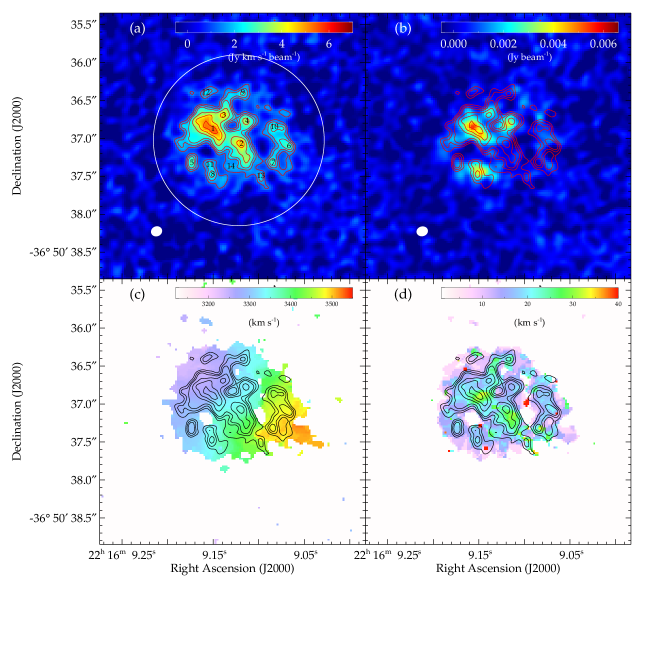
Figures 1a-1d show the integrated CO (65) emission, the 434 m continuum, the velocity field and velocity dispersion maps, respectively. All images are overlaid by the same contours of the integrated CO (65) line emission. The overall CO image looks clumpy, which may be due to the fact that (1) dense molecular gas is sparsely distributed in galaxies; and (2) our high resolution observation resolves out the largest-scale structures of and excludes weak/extended morphologies from being revealed in our maps. Furthermore, instead of discrete GMCs, we observed a complicated filamentary web, similar to what has been found in Galactic star formation regions (Molinari et al. 2010).
Using the clump-finding algorithm of Williams et al. (1994), which performs a blind search for clumps by contouring the map at different levels to identify peaks, we identified 14 clumps and labelled them in Figure 1a. The properties of these clumps, such as their positions, integrated fluxes, sizes (uncorrected for the beamsize), and velocity dispersions, are given in Table 2. From the table we can see that only 3 of these 14 clumps are resolved by our observation. This might be due to the fact that the CO (65) emission practically traces warm and dense molecular cores which are significantly more compact than the angular resolution of the observations. In the Galactic center, the warm and dense molecular cores (density of cm-3 and temperature of 60 to 100 K) traced by the para-H2CO emission are generally have sizes of 1 pc (Ginsburg et al. 2016).
The total flux of CO (65) measured within an circle of (as plotted in Figure 1a) from the integrated image is Jy km s-1, which is about 20% of our SPIRE/FTS-measured flux of Jy km s-1 (Lu et al. 2017), obtained with a much larger aperture of 33′′. To further constrain the fraction recovered by our observation within the ALMA FOV, we adopted a simple method to estimate the total CO flux (and the dust continuum flux) within our FOV. Firstly, we assume that the CO (65) (or dust continuum at 434 m) to the 70 micron flux ratio () is constant, according to Lu et al. (2014) and Liu et al. (2015). Secondly, we calculated , the fractional 70 m flux within a Gaussian beam of FWHM . For the Herschel FTS beam (FWHM35″) at CO (65), is about 0.8 (Zhao et al. 2016a; Lu et al. 2017), and for the ALMA FOV is 0.4. Therefore, our observation recovers 40% () of the total CO flux within the ALMA FOV. However, this missing flux is a very crude estimation since may vary at physical scales of kpc (e.g., Liu et al. 2015).
Our result indicates that the majority of the CO (65) emission in IC 5179 is missed by our ALMA observation, though our previous studies show that in nearby LIRGs the CO (65) emission is highly concentrated in regions with a scale of half kpc (Xu et al. 2014, 2015; Zhao et al. 2016b). This could be attributed to the following reasons: (1) Substantial CO (65) emission exists beyond the ALMA 9″ field of view; (2) The extended emission with a scale 2″.1 (520 pc) is resolved out by our observation (the size of the line/continuum region is very close to 2″.1, which might be indirect evidence); (3) Weak diffuse features are below our sensitivity; and (4) a combination of these three. Indeed, the measured flux is 1.4 times higher than the current value when a much larger beam () is used. This coarser resolution was obtained by doing the clean weighted with and -taper (). We also note that the total flux derived from the sum of the aperture photometry of individual channels (centered on the emission features for each given channel) is Jy km s-1 which 13% higher than that measured on the integrated CO (65) image. This is because, by co-adding all channel maps, the integrated emission is affected more severely by the (negative) side-lobes of different segments of the emission. This might be a significant effect since some segments are separated by 2″ (see the channel maps in §3.3), the angular scale limit of our interferometer observations.
t No. R.A. (J2000) Decl. (J2000) FWHMx FWHMy (hh:mm:ss) (dd:mm:ss) (″) (″) (Jy km s-1) (Jy km s-1) (km s-1) (1) (2) (3) (4) (5) (6) (7) (8) 1 22:16:09.151 36:50:36.90 0.37 (91) 0.29 (70) 0.16 35.4 43.6 2 22:16:09.122 36:50:37.07 0.24 (58) 0.29 (70) 0.13 20.4 31.7 3 22:16:09.140 36:50:36.70 0.28 (68) 0.19 (47) 0.13 13.0 28.6 4 22:16:09.115 36:50:36.77 0.17 (43) 0.16 (39) 0.10 7.2 21.2 5 22:16:09.176 36:50:37.32 0.09 (22) 0.14 (34) 0.09 3.1 22.1 6 22:16:09.070 36:50:37.10 0.16 (38) 0.18 (44) 0.08 5.5 22.1 7 22:16:09.086 36:50:37.32 0.20 (48) 0.18 (45) 0.08 4.3 32.7 8 22:16:09.153 36:50:37.47 0.17 (42) 0.14 (34) 0.07 3.9 26.7 9 22:16:09.118 36:50:36.40 0.22 (54) 0.11 (26) 0.07 4.1 29.2 10 22:16:09.084 36:50:36.85 0.17 (42) 0.15 (36) 0.07 5.5 24.3 11 22:16:09.155 36:50:37.35 0.11 (26) 0.08 (19) 0.07 1.8 27.3 12 22:16:09.159 36:50:36.40 0.13 (31) 0.08 (20) 0.06 1.7 17.0 13 22:16:09.099 36:50:37.50 0.16 (39) 0.24 (57) 0.06 3.5 34.8 14 22:16:09.132 36:50:37.37 0.18 (43) 0.18 (43) 0.05 3.0 33.1
Note. — Column 1: clump number; Columns 2 and 3: right ascension and declination of the clump center; Columns 4 and 5: FWHM at - and -direction, respectively, calculated at the level of and not corrected for the beam size; in the parentheses we also list the corresponding values in units of pc. Column 6: peak flux; Column 7: integrated flux; Column 8: velocity dispersion, obtained by fitting a Gaussian profile to the spectrum extracted within an elliptical aperture with radii of (FWHMx, FWHMy).
Figure 2 shows the integrated CO spectrum for the region within the circle in Figure 1a. The spectrum has multiple peaks, which is consistent with low- () CO observations (e.g., Mirabel et al. 1990; Garay et al. 1993). From the figure we can see that each component can be well fitted by a Gaussian function. The central velocity of the strongest peak in our spectrum is about 3330 km s-1. The flux-weighted mean, a measure of the systematic velocity of the kinematic center of the warm molecular gas disk, is 3345 km s-1.

3.2. Continuum Emission at 434 m
Our previous studies of the dust emission at 434 m in NGC 34, NGC 1614 (Xu et al. 2014, 2015) and NGC 7130 (Zhao et al. 2016b) have shown that dust heating and gas heating in the warm dense gas cores are strongly coupled at large scales (e.g., 100 pc). As shown in Figure 1b, the continuum generally correlates spatially with the CO (65) line emission as well in IC 5179. However, similar to what found in Arp 220 (Rangwala et al. 2015) and NGC 7130 (Zhao et al. 2016b), there also exist offsets (, or 25100 pc for different objects) between local peaks in the line and continuum emission. Furthermore, there is weak/no detectable dust emission in about a half of the CO-emission region (southwest).
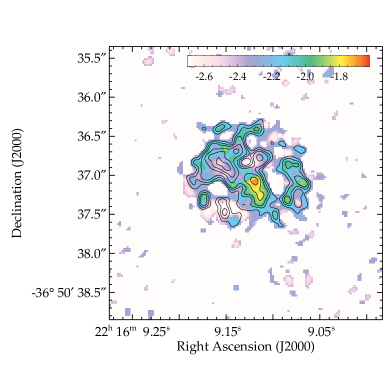
To further investigate the difference between the spatial distribution of the line and continuum emission, we plotted the CO (65)-to-continuum luminosity ratio (logarithm scale) in Figure 3. Here we have adopted as the monochromatic luminosity of the continuum emission. For pixels with fluxes less than 2, we used the 2 flux to calculate the ratio. From Figure 3 we can see that the CO-to-dust luminosity ratio varies by a factor of 10.
As discussed in detail in Zhao et al. (2016b), the displacement between the dust and line emission peaks, and the variation of the CO-to-dust luminosity ratio in NGC 7130 can be understood if they are heated by different mechanisms, e.g, the dust is heated by the UV radiation from young massive stars, whereas (part of) the CO-emission gas is mainly heated by supernova-driven shocks (see, e.g., Rosenberg et al. 2015). This scenario generally agrees with the observed results in IC 5179 as well. For example, the gas in the southwest part has weaker corresponding Pa- emission (see §3.4), and higher velocity dispersion, indicating a weaker radiation heating by the UV radiation field and a stronger mechanic heating by turbulence/shocks.
Our ALMA-detected flux density of the continuum at 434 m is mJy. By interpolating the Herschel SPIRE photometric measurements at 350 and 500 m, we estimated that the total flux density at 434 m is 3.01 Jy, indicating that only 2.4% (5% if the scaled value of the total flux adopted; see §3.1) of the total dust emission is detected by our ALMA observation. This fraction is about an order of magnitude lower than the interferometer-to-single-dish flux ratio of the CO (65) line emission, suggesting that the dust should be substantially more extended than the warm dense gas in IC 5179.
3.3. Kinematics of the Nuclear Region
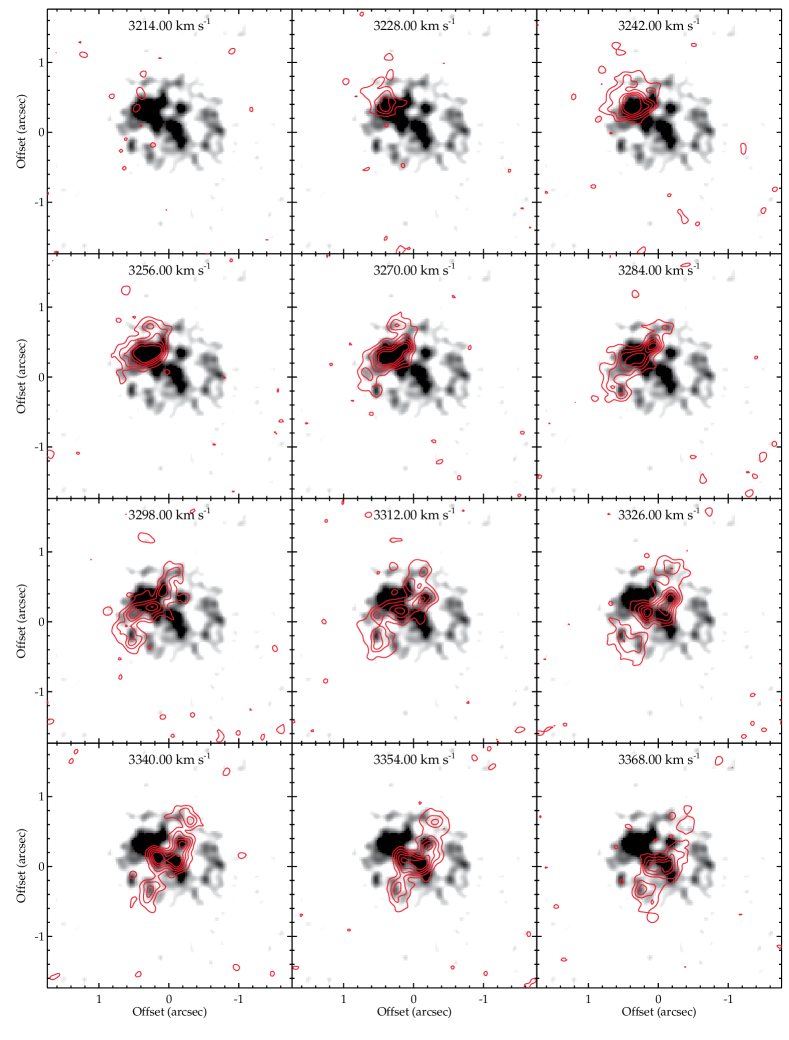
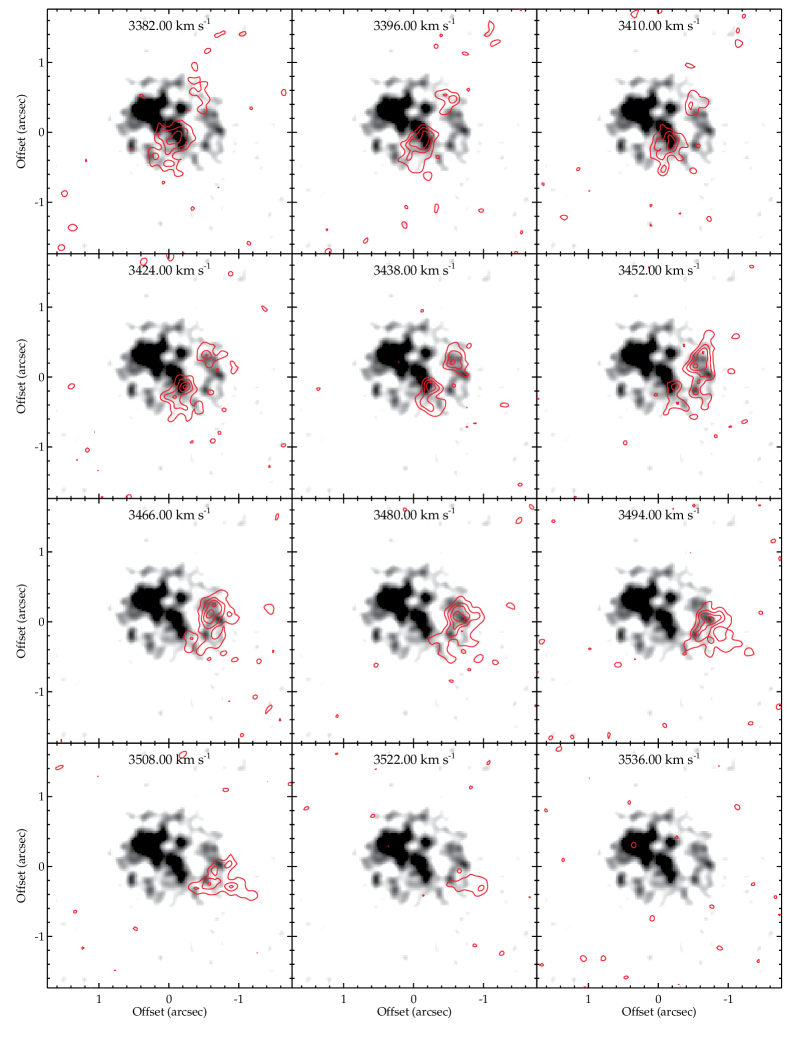
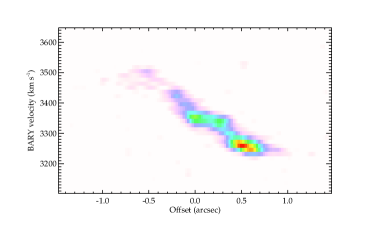
The channel maps are displayed in Figure 4, where channels are overlaid on the integrated line emission. The spatial-velocity structure is demonstrated clearly in these plots. The velocity field (first moment) map (Figure 1c) has the typical “spider-diagram” shape, and shows a clear velocity gradient along the southwest-northeast direction, which characterizes a rotating disk. From the position-velocity (P-V) diagram (Figure 5), which was extracted using a slice with the width of 0″.175 (7 pixels) and P.A. of 55∘ (similar to the optical P.A.), the velocity amplitude (uncorrected for the inclination) of this rotation is 140 km s-1. To have a more detailed view, we further quantify the kinemetric features using the code kinemetry222http://davor.krajnovic.org/idl/, which does surface photometry to the first moment map by determining the best-fitting ellipse, and extracts information such as mean velocity, rotation curve, kinematic P.A., axial ratio, deviation from simple rotation, etc (see Krajnović et al. 2006 for more details).
Figure 6a presents the kinematic P.A. as a function of radius , where the center (0.0 arcsec) was set to be (22h16m09s.132, ). We can see that P.A. shows large variation at small radii (i.e. ), indicating a twists in the isovelocity contours, and becomes stable at larger radii. The median value of the kinematic P.A. is 55∘, very similar to the one measured in the optical image (57∘; Lehnert & Heckman 1995). Figure 6b displays the variation of the axis ratio () along the radial direction. has similar behavior to P.A., and has a median value of 0.59, suggesting an inclination . The rotation curve (uncorrected for the inclination) shown in Figure 6c illustrates that it arises fast within the central , and then flattens. The maximum is similar to that estimated from the P-V diagram (Figure 5). In Figure 6d we also plot the overall magnitude of the higher-order term (), which is a kinemetric analogous of the photometric term that describes the deviation of isophote shape from an ellipse, and is sensitive to the existence of separate kinematic components on the velocity map (Krajnović et al. 2006). From the figure we see that the relative magnitude of can be as large as 10% of () when , indicating that there might exist some weak non-circular motions (possibly due to infollows/outflows) in the gas disk.
Using long-slit and integral field spectroscopic data of the H emission, Lehnert & Heckman (1995) and Bellocchi et al. (2013) derived a maximum rotation speed of 194 and 186 km s-1, respectively. Comparing with our result, we can see that the rise of the velocity is almost confined to the central half kpc. This result can be confirmed by a close inspection of the first moment map in Bellocchi et al. (2013), though their data have a much lower spatial resolution.
In the second moment map shown in Figure 1d, the velocity dispersion () in most regions is in the range of km s-1. However, regions with stronger emission (i.e., ; see the contours) in the zero moment map seem to have higher , with values of kms. From the P-V diagram, the velocity gradient due to the rotation is estimated to be 0.9 km s-1 pc-1, corresponding to a line widening of about 9 km s-1 within individual beams (linear size of 34 pc). This is consistent with the smallest shown in the velocity dispersion map (Figure 1d).
3.4. Comparison with Pa- Observations

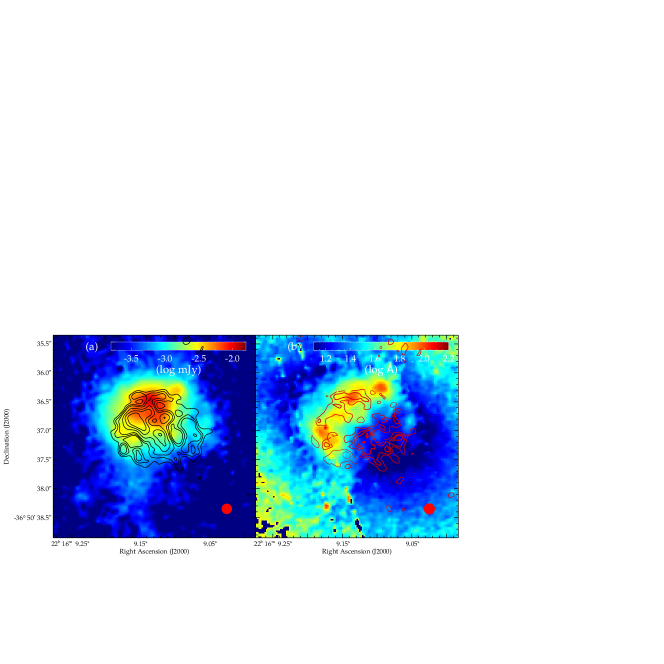
In Figure 7a we plot the high-resolution () HST Pa- (Alonso-Herrero et al. 2006; Diáz-Santos et al. 2008) image. The Pa- map was obtained from a set of HST NIR narrow-band images (Diáz-Santos et al. 2008). We have matched their resolutions by adopting when cleaning the calibrated images of the CO emission. As shown in the figure, the CO (65) line emission roughly coincides spatially with the Pa- emission, though their corresponding peaks do not agree. However, the Pa- emission seems to vary smoothly with radius, with no clumpy morphology as seen in the CO (65) image. Furthermore, the southwest part of the CO-emission region has much weaker Pa- emission. This should not be due to the extinction since the dust continuum is much weaker (see Figure 1b) and the CO-to-continuum ratio is higher (Figures 3 and 7b) in this region.
Figure 7b shows the Pa- equivalent width (EW; free from the extinction effect) image overlaid by CO-to-dust continuum ratio contours, where we have also adopted 2 as upper limits. As illustrated in Díaz-Santos et al. (2008), the Pa- EW is a useful age indicator of young stellar populations. It is interesting to find that the southwest region, where the CO-to-dust ratio is generally higher, shows about one order of magnitude smaller Pa- EW than the northeast region, suggesting an older stellar population. This result, combining with the increasing non-circular motions (Figure 6d), provides indirect evidence that the gas in the southwest region could be mainly excited by mechanical heating rather than UV photons from young massive stars.
4. Summary
In this paper we present our ALMA observations of the CO (65) line emission and the continuum emission at 434 m in the nucleus of the nearby LIRG IC 5179, with a physical resolution of about . Our main results are:
-
1.
The CO (65) emission displays a filamentary structure where many dense cores can be located, and shows a rotating disk-like velocity field. Moreover, its rotation curve reaches 90% of the maximum value within the central 150 pc.
-
2.
Globally the gas and dust are spatially correlated. However, their peaks do not always coincide with each other, and the CO-to-continuum ratio varies by at least an order of magnitude. This observed small scale variation can be attributed to the variation in the excitation mechanism of the CO line, as evidenced also by the values of the Pa- EW.
-
3.
Within the nuclear region of 300 pc and with a physical resolution of 34 pc, our ALMA observations detected CO flux (dust flux density) is Jykm s-1 ( mJy), only accounting for 22% (2.4%) of the total value derived from the Herschel/SPIRE observations.
References
- (1) Albrecht, M., Krügel, E., & Chini, R. 2007, A&A, 462, 575
- (2) Alonso-Herrero, A., Rieke, G. H., Rieke, M. J., & Scoville, N. Z. 2002, AJ, 124, 166
- (3) Alonso-Herrero, A., Rieke, G. H., Rieke, M. J., Colina, L., Pérez-González, Pablo G., & Ryder, S. D. 2006, ApJ, 650, 835
- (4) Armus, L., Mazzarella, J. M., Evans, A. S., et al. 2009, PASP, 121, 559
- (5) Bellocchi, E., Arribas, S., Colina, L., & Miralles-Caballero, D. 2013, A&A, 557, A59
- (6) Casey, C. M., Narayanan, D., & Cooray, A. 2014, Phys. Rep., 541, 45
- (7) Chini, R., Krügel, E., & Lemke, R 1996, A&AS, 118, 47
- (8) Caputi, K. I., Lagache, G., Yan, L., et al. 2007, ApJ, 660, 97
- (9) Carilli, C. L., & Walter, F. 2013, ARA&A, 51, 105
- (10) Díaz-Santos, T., Alonso-Herrero, A., Colina, L., et al. 2008, ApJ, 685, 211
- (11) Gao, Y., & Solomon, P. M. 2004, ApJ, 606, 271
- (12) Garay, G., Mardones, D., & Mirabel, I. F. 1993, A&A, 277, 405
- (13) García-Burillo, S., Combes, F., Ramos Almeida, C., et al. 2016, ApJL, 823, L12
- (14) García-Burillo, S., Combes, F., Usero, A., et al. 2014, A&A, 567, A125
- (15) Ginsburg, A., Henkel, C., Ao, Y., et al. 2016, A&A, 586, A50
- (16) Griffin, M. J., Abergel, A., Abreu, A., et al. 2010, A&A, 518, L3
- (17) Gruppioni, C., Pozzi, F., Rodighiero, G., et al. 2013, MNRAS, 432, 23
- (18) Haan, S., Armus, L., Surace, J. A., et al. 2013, MNRAS, 434, 1264
- (19) Haan, S., Surace, J. A., Armus, L., et al. 2011, AJ, 141, 100
- (20) Hinshaw, G., Weiland, J. L., Hill, R. S., et al. 2009, ApJS, 180, 225
- (21) Iono, D., Wilson, C. D., Yun, M. S., et al. 2009, ApJ, 695, 1537
- (22) Krajnović, D., Cappellari, M., Tim De Zeeuw, P., & Copin, Y. 2006, MNRAS, 366, 787
- (23) Krips, M., Martín, S., Peck, A. B., Sakamoto, K., Neri, R., Gurwell, M., Petitpas, G., & Zhao, J.-H. 2016, ApJ, 821, 112
- (24) Larson, K. L., Sanders, D. B., Barnes, J. E., et al. 2016, ApJ, 825, 128
- (25) Le Flóch, E., Papovich, C., & Dole, H., et al. 2005, ApJ, 632, 169
- (26) Lehnert, M. D., & Heckman, T. M. 1995, ApJS, 97, 89
- (27) Liu, D., Gao, Y., Isaak, K., Daddi, E., Yang, C., Lu, N., & van der Werf, P. 2015, ApJL, 810, L14
- (28) Lu, N., Zhao, Y., Xu, C. K., et al. 2014, ApJL, 787, L23
- (29) Lu, N., Zhao, Y., Xu, C. K., et al. 2017, ApJS, in press (arXiv: 1703.00005)
- (30) McMullin, J. P., Waters, B., Schiebel, D., Young, W., & Golap, K. 2007, in ASP Conf. Ser. 376, Astronomical Data Analysis Software and Systems XVI, ed. R. A. Shaw, F. Hill, & D. J. Bell (San Francisco, CA: ASP), 127
- (31) Magnelli, B., Elbaz, D., Chary, R. R., Dickinson, M., Le Borgne, D., Frayer, D. T., & Willmer, C. N. A. 2009, A&A, 496, 57
- (32) Magnelli, B., Elbaz, D., Chary, R. R., Dickinson, M., Le Borgne, D., Frayer, D. T., & Willmer, C. N. A. 2011, A&A, 528, A35
- (33) Matsushita, S., Iono, D., Petitpas, G. R., et al. 2009, ApJ, 693. 56
- (34) Menéndez-Delmestre, K., Blain, A. W., Smail, I., Alexander, D. M., Chapman, S. C., Armus, L., Frayer, D., Ivison, R. J., & Teplitz, H. 2009, ApJ, 699, 667
- (35) Mirabel, I. F., Booth, R. S., Garay, G., Johansson, L. E., & Sanders, D. B. 1990, A&A, 236, 327
- (36) Molinari, S., Swinyard, B., Bally, J., et al. 2010, A&A, 518, L100
- (37) Petric, A. O., Armus, L., & Howell, J., et al. 2011, ApJ, 730, 28
- (38) Petty, S. M., Armus, L., Charmandaris, V., et al. 2014, AJ, 148, 111
- (39) Pilbratt, G. L., Riedinger, J. R., Passvogel, T., et al. 2010, A&A, 518, L1
- (40) Piqueras López, J., Colina, L., Arribas, S., & Alonso-Herrero, A. 2013, A&A, 553, A85
- (41) Privon, G. C., Herrero-Illana, R., Evans, A. S., et al. 2015, ApJ, 814, 39
- (42) Psychogyios, A., Charmandaris, V., Díaz-Santos, T., et al. 2016, A&A, 591, 1
- (43) Rangwala, N., Maloney, P. R., Wilson, C. D., Glenn, J., Kamenetzky, J., & Spinoglio, L. 2015, ApJ, 806, 17
- (44) Rosenberg, M. J. F., van der Werf, P. P., Aalto, S., et al. 2015, ApJ, 801, 72
- (45) Sage, L. J., & Isbell, D. W. 1991, A&A, 247, 320
- (46) Saito, T., Iono, D., Xu, C. K., et al. 2017, ApJ, 835, 174
- (47) Sakamoto, K., Wang, J., Wiedner, M. C., et al. 2008, ApJ, 684, 957
- (48) Sanders, D.B., & Mirabel, I.F. 1996,ARA&A, 34, 749
- (49) Sliwa, K., Wilson, C. D., Aalto, S., & Privon, G. C. 2017, ApJL, 840, L11
- (50) Sliwa, K., Wilson, C. D., Iono, D., Juvela, M., Peck, A., & Matsushita, S. 2014, ApJL, 796, L15
- (51) Sliwa, K., Wilson, C. D., Krips, M., Petitpas,G. R., Iono, D., Juvela, M., Matsushita, S., Peck, A., & Yun, M. 2013, ApJ, 777, 126
- (52) Soifer, B. T., Sanders, D. B., Madore, B. F., et al. 1987, ApJ, 320, 238
- (53) Solomon, P. M., Sanders, D. B., & Scoville, N. Z. 1979, in IAU Symp. 84, The Large-Scale Characteristics of the Galaxy, ed. W. B. Burton (Cambridge Univ. Press), 35
- (54) Taniguchi, Y., & Ohyama, Y. 1998, ApJL, 507, L121
- (55) de Vaucouleurs, G., de Vaucouleurs, A., Corwin, H. G., Jr., Buta, R. J., Paturel, G., & Poqué, P. 1991, Third Reference Catalogue of Bright Galaxies (New York: Springer)
- (56) Veilleux, S., Kim, D.-C., Sanders, D. B., Mazzarella, & Soifer, B. T. 1995, ApJS, 98, 171
- (57) Williams, J. P., de Geus, E. J., & Blitz, L. 1994, ApJ, 428, 693
- (58) Wootten, A., & Thompson, A. R. 2009, IEEEP, 97, 1463
- (59) Wu, J., Evans, N. J., II, Shirley, Y. L., & Knez, C. 2010, ApJS, 188, 313
- (60) Xu, C. K., Cao, C., Lu, N., et al. 2014, ApJ, 787, 48
- (61) Xu, C. K., Cao, C., Lu, N., et al. 2015, ApJ, 799, 11
- (62) Zhang, Z.-Y., Gao, Y., Henkel, C., Zhao, Y., Wang, J., Menten, K. M., & Güsten, R. 2014, ApJL, 784, L31
- (63) Zhao, Y., Lu, N., Xu, C. K., et al. 2016a, ApJ, 819, 69
- (64) Zhao, Y., Lu, N., Xu, C. K., et al. 2016b, ApJ, 820, 118