Clock spectroscopy of interacting bosons in deep optical lattices
Abstract
We report on high-resolution optical spectroscopy of interacting bosonic 174Yb atoms in deep optical lattices with negligible tunneling. We prepare Mott insulator phases with singly- and doubly-occupied isolated sites and probe the atoms using an ultra-narrow “clock” transition. Atoms in singly-occupied sites undergo long-lived Rabi oscillations. Atoms in doubly-occupied sites are strongly affected by interatomic interactions, and we measure their inelastic decay rates and energy shifts. We deduce from these measurements all relevant collisional parameters involving both clock states, in particular the intra- and inter-state scattering lengths.
I Introduction
In the last decade, progress in laser frequency stabilization and frequency comparison has led to a new generation of atomic clocks with unprecedented performances ludlow2015a . These clocks use ultra-narrow optical transitions (hereafter “clock” transitions), interrogated with ultra-stable lasers locked to high-finesse Fabry-Perot cavities. Because such optical transitions are essentially free of spontaneous emission, they provide new opportunities not only for frequency metrology, but also for quantum information processing gorshkov2009a ; daley2011a , many-body physics and quantum simulation gorshkov2010a ; gerbier2010a ; martin2013a ; goldman2013b ; rey2014a . For instance, spin-orbit coupling has been demonstrated in 87Sr kolkowitz2017a and 173Yb atoms livi2016a . In these applications inter-atomic interactions play an important part. In particular, they are central to the study of quantum gases or the generation of entanglement. Recently, large spin-exchange interactions have been measured with fermionic 173Yb capellini2014a ; scazza2014a , which is promising for the simulation of quantum impurity models Riegger2017a . While atomic interactions are usually detrimental in frequency metrology ludlow2015a , degenerate quantum gases may help to improve the accuracy of optical clocks by offering a better control over interaction effects ludlow2015a , as suggested by a recent demonstration with a degenerate Fermi gas of 87Sr campbell2017a . Most optical clocks currently operate with fermionic atoms, which reduces but does not eliminate the problem of interactions at low temperatures campbell2009a . However, bosonic atoms could provide advantages due to their reduced sensitivity to external fields and simpler level structure, or for comparing clocks based on different isotopes ludlow2015a . Interaction effects could be essentially eliminated using many-body correlated states, e.g. a Mott insulator with one atom per lattice site.
Narrow optical or microwave transitions can also been used to probe various properties of degenerate quantum gases. Bose-Einstein condensation in hydrogen was detected through the associated change in the optical spectrum recorded on the transition killian1998a . This early study pointed out the role of intra- and inter-state interactions on the shape and position of the optical spectra. For bosonic gases in optical lattices, microwave spectroscopy has been used to probe the spatial structure of Mott insulator phases that arise for deep lattices foelling2006a ; campbell2006a . At zero temperature, the density profile shows extended regions of uniform integer filling, the so-called “Mott plateaus” bloch2008a . Different fillings correspond to different interaction shifts that can be resolved spectroscopically. More recently, optical spectroscopy on the narrow transition yamaguchi2010a enabled to monitor the superfluid-Mott insulator transition in a gas of 174Yb atoms kato2016a .
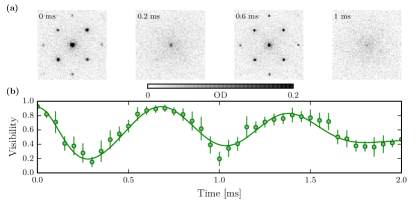
In this work, we report on a spectroscopic study of a bosonic Mott insulator of 174Yb using the ultra-narrow clock transition. Typical experimental results are shown in Fig. 1b. Starting from a sample in the ground state , a laser pulse resonant on the clock transition drives coherent oscillations between and the metastable excited state . After a fast initial decay of the total atom number, the contrast of the oscillations approaches unity and eventually decreases for ms. This coherent dynamics can be understood by considering the spatial distribution of atoms in a trapped Mott insulator (sketched in Fig. 1a). For our experimental parameters, we expect a central core of doubly-occupied sites surrounded by an outer shell of singly-occupied sites. Inelastic collisions in the excited state lead to the fast initial decay, where all doubly-occupied sites are lost. When only singly-occupied sites remain, they display long-lived Rabi oscillations. In this article, we study in detail the impact of elastic and inelastic interactions on the coherent dynamics of the system. We show that this analysis can be used to measure the previously unknown collisional properties of 174Yb.

The paper is organized as follows. We describe the experimental setup in Sec. II, including the sequence used to prepare an ultracold bosonic gas in an optical lattice in Sec. II.1, and the optical setup for the clock laser and detection scheme in Sec. II.2. We present a measurement of the on-site occupation numbers in the Mott insulator phase in Sec. II.3. In Sec. III, we analyze the dynamics of doubly-occupied sites. Using the model presented in Sec. III.1, we extract inelastic (Sec. III.2) and elastic (Sec. III.3) interaction parameters from spectroscopic data. We conclude in Sec. IV.
II Experimental setup and methods
II.1 A Mott insulator of bosonic ytterbium atoms
II.1.1 Optical lattice setup
Our experiment starts with a nearly pure Bose-Einstein condensate (BEC) of about 174Yb atoms in a crossed optical dipole trap (CDT) with initial trap frequencies (see dareau2015a ; scholl2016a for more details). The BEC is transferred into a three-dimensional cubic optical lattice depicted in Fig. 1a. This lattice results from the incoherent superposition of three orthogonal standing waves with orthogonal polarizations bloch2008a . All lattice light beams derive from the same laser operating at the magic wavelength nm ludlow2015a ; barber2008a , for which the polarizabilities of and are equal dzuba2010a . The periodic optical lattice potential experienced by the atoms irrespective of their internal state is then
| (1) |
where are the lattice depths and where is the lattice wavenumber. We calibrate the lattice depths for given laser powers by Kapitza-Dirac diffraction. The vertical lattice (VL) depth is essentially fixed (see Sec. II.1.2), while the horizontal lattice (HL) depths can be varied from zero to . Here is the recoil energy, with the atomic mass. In this work, unless stated explicitly, we use the largest available lattice depths. The Gaussian envelope of the lattice lasers also entails an additional, slowly varying harmonic potential
| (2) |
By recording collective mode frequencies of a BEC, we infer the Gaussian beam waists for each standing wave, ,,. The corresponding trap frequencies are for lattice depths .
II.1.2 Adiabatic preparation of a Mott insulator
The BEC is transferred into the optical lattice in three consecutive steps, aiming at preparing a stack of independent 2D Bose gases in the lowest Bloch band of the HL: (i) a fast ramp up of the VL, (ii) a slow extinction of the CDT and (iii) an adiabatic increase of the HL.
In more detail, we first ramp up in 20 ms a single standing wave propagating vertically (VL), superimposed on the CDT. This fast increase is used to freeze the vertical motion in the combined potential formed by the optical lattice and gravity. The potential alone barely traps the atoms along gravity with a sag of the cloud much larger than in the CDT ( compared to , respectively, with the acceleration of gravity). The fast ramp up of the VL (as opposed to a slow, quasi-adiabatic transfer) prevents from inducing any motion along morsch2006a , potentially leading to heating of the cloud. Note, however, that the duration of this first step is still long enough to avoid inter-band transitions. In a second step, the CDT is smoothly extinguished in 200 ms to create a stack of independent two-dimensional condensates in the VL potential alone. This step reduces the atomic density and hence mitigates the rate of three-body losses (see Sec. II.3). It also avoids differential light shifts between the clock states created by the CDT lasers. In a final step, the two arms of the HL are increased to their desired values in 100 ms, which roughly fulfills the criterion of gericke2007a for adiabatic loading of the lowest Bloch band.
Each planar gas can be described by a 2D Bose-Hubbard Hamiltonian bloch2008a
| (3) |
Here the notation indicates summation over all lattice sites at positions in the plane, and in-plane tunneling to nearest-neighbors with matrix element . Tunneling along the gravity direction has been neglected. The on-site energy is given by
| (4) |
where denotes a two-dimensional vector in the plane and where (respectively ) are the Wannier functions for the vertical (resp. horizontal) lattice potential. The scattering length describes low-energy s-wave scattering between two atoms in the internal state , and has been measured in kitagawa2008a , with the Bohr radius. Using collapse and revival dynamics (see greiner2002b and appendix), we measure Hz, which compares well with the value Hz calculated from Equ. 4 using the calibrated lattice depths. Unless otherwise mentioned, the quoted error bars represent a confidence interval on the optimum fit value.
At zero temperature, the 2D Bose-Hubbard model supports phase transitions to incompressible Mott insulator (MI) phases bloch2008a ; spielman2007a ; capogrosso2008a ; jimenezgarcia2010a . For a filling factor , i.e. 1 atom per lattice site, Monte-Carlo simulations predict a transition for a critical value capogrosso2008a , corresponding to HL depths around . The smooth harmonic trap leads to a characteristic “wedding cake” density profile, i.e. density plateaus with integer filling, the denser plateaus occurring near the trap center bloch2008a . In the present work, the HL depths become large enough at the end of the loading procedure so that we can safely neglect tunneling altogether (). Introducing a chemical potential , the spatial structure is then given, in the local density approximation, by
| (5) |
where denotes the integer part of . For finite temperatures and/or tunneling (still small compared to ), the overall density profile remains similar but with smoother edges than predicted by Equ. 5. The relative weight of the plateau with atoms can be characterized by its population normalized to the total atom number, noted in the remainder of the article.
II.2 Single-atom Rabi oscillations on the clock transition
With a MI in the ground state as a starting point, we now describe our experiments involving spectroscopy on the clock transition. In this section, we focus on the simplest case with only one atom per site. This can be realized by loading a sufficiently small number of atoms (such that only a plateau with atom per site appears) as in Fig. 2a.
II.2.1 Optical setup
The optical setup has been presented in detail in dareau2015a . Briefly, a laser resonant with the clock transition near nm is locked on a high-finesse cavity well-isolated from its surroundings which serves as frequency reference. We split the optical path into one going to the cavity using an optical fiber with active Doppler noise cancellation ma1994a , and the other going towards the atomic cloud. The wavevector is oriented along the direction (see Fig. 1a).
The electric dipole transition is forbidden at zero field ( transition, with the total electronic angular momentum). Following the method pioneered in taichenachev2006a ; barber2006a , we use a static magnetic field (with G) to enable an effective electric dipole coupling between and . Neglecting motional degrees of freedom, the effective coupling strength is taichenachev2006a , where , and are respectively the intensity, power and waist ( radius) of the clock laser beam. For atoms in a deep optical lattice, the complete transition amplitude (hereafter denoted as “Rabi frequency” for simplicity) is , where the additional factor takes into account the overlap between motional states ludlow2015a . We find Hz using mW/cm2 (mW and ) and a laser linearly polarized along , in good agreement with the measured value Hz for the experiment of Fig. 1b. Hopping transitions to different sites and to higher bands can be safely neglected (the Lamb-Dicke parameter is small, with nm the typical extent of the atomic wavefunction ).
II.2.2 Detection
We detect atoms in the ground state using standard resonant absorption imaging on the transition. Atoms in the excited state are detected using a repumping laser on the transition near nm. Here and in the remainder we denote by the atom number in the state . The auxiliary state can decay to the states (), where are metastable and where decays to the ground state by emitting a photon at nm. The metastable state is a dark state for both the repumping and the imaging lasers. However, the branching ratio is small bowers1996a , so that the repumping efficiency from to is close to unity for a -long repumping pulse. Comparing and for Rabi oscillations similar to Fig. 2a, we estimate %, consistent with a calculation based on optical Bloch equations. In addition, atoms in the ground state are very far off-resonant and hardly affected. Hence, applying the repumping pulse allows us to detect the total population . To detect selectively atoms in and measure only , we apply an additional -long removal pulse on the transition before the repumping pulse. Atoms in scatter many photons and are pushed away from the imaging region. Atoms in are mostly unaffected by the removal pulse, although we measure a reduced detection efficiency by approximately %. This is possibly due to secondary scattering between trapped atoms and untrapped atoms leaving the sample. We have also observed a slight influence of the atomic density on the repumping efficiency. The observed efficiency is reduced by roughly % when is higher than about . We do not correct experimental atom numbers in for the repumping efficiency but we take it into account in the analysis of Sec. III.2 and Sec. III.3.
II.2.3 Single-atom dynamics
For atoms in singly-occupied lattice sites, the time evolution consists of textbook Rabi oscillations between and , described by the Hamiltonian
| (8) |
with the laser detuning, the atomic Bohr frequency of the transition, the clock laser frequency and the Rabi frequency introduced before. Starting from a sample in the ground state and switching on the coupling laser, the atomic populations oscillate between and at the frequency . In the remainder we characterize the coupling laser pulse by its duration , or equivalently by its area . We show in Fig. 2a Rabi oscillations for a cloud prepared with only singly-occupied sites [], where almost full contrast is observed up to 10 ms. However, for higher atom numbers as in Fig. 1b [], Rabi oscillations are damped on the same time scale. For both cases the Rabi frequency is Hz. In the following we consider possible dephasing mechanisms to explain this difference.
We first consider a possible deviation from the exact magic wavelength, inducing a position-dependent differential light shift caused by the lattice potential. A calculation based on barber2008a indicates a differential shift across the cloud smaller than Hz for a wavelength mismatch of nm. Hence, this effect can be neglected in the present work.
Frequency or intensity fluctuations of the clock laser also induce dephasing over time. Although the intensity of this laser is not actively stabilized at the atomic cloud location, careful monitoring shows that intensity fluctuations remain below 1% and cannot explain the observed dephasing. Regarding frequency fluctuations, we recorded spectra at low atom numbers (to ensure almost unity filling across the cloud), -pulse areas and long pulse times. When the pulse time exceeds ms, we observe substantial shot-to-shot fluctuations of the measured transition probability with identical parameters. This could be explained by shot-to-shot fluctuations of the clock laser frequency with a standard deviation of about Hz, presumably due to the high-finesse cavity. This value can certainly be improved in future work. In order to evaluate the impact of such frequency fluctuations on the coherent dynamics in Fig. 1b, we modeled them by a random detuning with a Gaussian distribution function of width . We verified numerically that a width greater than Hz would be required to account entirely for the observed damping, a value incompatible with the narrowest measured spectra.
Additional dephasing mechanisms come from the Gaussian profile of the coupling beam. This profile entails a non-uniform and also induces a position-dependent differential light shift, leading to a non-uniform barber2006a . Close to resonance, the first effect is dominant. Inhomogeneities cause a dephasing over time between the center and the edges of the cloud, and thus to an apparent damping when averaging over the whole cloud. The dephasing time thus depends on the cloud size. Using a parabolic approximation for the Gaussian profile, we estimate , where is the radius of the cloud and a numerical factor depending on the atomic density distribution111Although a misalignment of the clock beam could also increase the damping rate, this would entail a reduction of the maximum achievable Rabi frequency, which we do not observe.. We used the model for the spatial atomic density of Sec. II.3 to obtain the cloud size for a given and to estimate . For the highest atom number [ ] we find ms, close to the observed damping time in Fig. 1b. For the lowest atom number [ ] we find ms, consistent with almost no decay observed in Fig. 2a.
We conclude that inhomogeneous dephasing is likely responsible for the observed damping for large but quickly becomes negligible when decreases due to the quadratic dependence . In the low limit, the damping is then most likely dominated by frequency fluctuations on a time scale ms. We note that the damping has little influence on the shape and position of the spectra shown in Sec. III.3, where the pulse time is shorter than the damping time. However, the single-particle damping discussed in this paragraph limits the uncertainty on our measurement of collisional parameters presented in Sec. III.3.
II.3 Determination of Mott shell populations
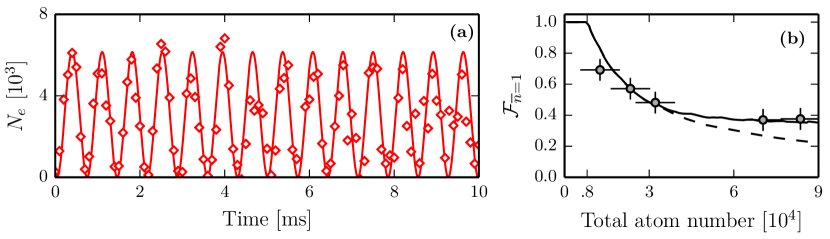
Fig. 1b illustrates that the temporal dynamics at early times can strongly differ from the Rabi oscillations expected for singly-occupied sites alone, as in Fig. 2a. While elastic interactions provide state-dependent energy shifts, inelastic interactions lead to a fast decay leaving only singly-occupied sites after ms (see Sec. III.2). The long-time asymptote of in Fig. 1b thus reflects the initial fraction of atoms in singly-occupied sites of the MI phase. In Fig. 2b, we show the measured values of this asymptote for various initial atom numbers .
In order to compare this measurement to the expected value of in a deep MI phase, we model the first phase of our loading sequence where the VL is quickly increased (see Sec. II.1.2) using a sudden approximation. The initial atomic distribution for a BEC in the CDT is projected on a periodic potential of period much smaller than the initial Thomas-Fermi half-length of the BEC. For a BEC in the Thomas-Fermi regime dalfovo1999a , this results in a distribution for the number of atoms in each plane of the VL at the altitude (the integer labels the plane), with the Heaviside function. Using this distribution, we then assume a zero entropy sample in each plane, determined as the ground state of the 2D Bose-Hubbard model in Equ. 3 with atoms. We finally compute the normalized populations summing over all .
For the parameters of our experiment, there are typically occupied planes, with occupation numbers in a deep MI phase ranging from to . For the lowest atom numbers explored in this work [], we find only a plateau with , in agreement with Fig. 2a. For the largest atom numbers [], we find plateaus with normalized populations . The prediction of this loading model for the normalized population , shown in Fig. 2b as dashed line, agrees with the measured values only for low atom numbers .
We attribute the marked difference for higher atom numbers to three-body inelastic losses, that occur at relatively high rates in optical lattices. We estimate a lifetime ms for triply-occupied sites using the three-body rate constant cm6/s measured in fukuhara2009a , comparable to the loading time in the HL. A detailed kinetic modeling of these losses during the loading sequence is beyond the scope of this work. Here we extend our model in the simplest possible way, by assuming that all triply-occupied sites have decayed during the loading and are therefore empty when the measurements are performed (the model predicts negligible population of sites with occupancy , and we neglect them in our discussion). For the largest atom numbers [], the normalized populations become . The prediction of this lossy loading model, shown in Fig. 2b as solid line, agrees well with the measured values and suggests that the in-trap density distribution is close to the predicted one.
III Interacting atoms driven on the clock transition
III.1 Model
We now consider the dynamics of doubly-occupied sites driven by the coupling laser, which differs from singly-occupied sites in several aspects. First, due to bosonic enhancement, the coupling strength is times higher for double than for single occupancy. Second, the three possible symmetric states , and have in general different interaction energies, characterized by Hubbard parameters , and , the last two being unknown. Finally, the states and are prone to inelastic decay via principal quantum number changing collisions. We model this inelastic process by adding an imaginary term to the Hamiltonian, with . This results in a dynamics captured by a non-Hermitian effective Hamiltonian
| (12) |
in the basis.
We numerically solve the generalized Schrödinger equation using the effective Hamiltonian Equ. 12 with initial condition . We also solve the Schrödinger equation for singly-occupied sites using Equ. 8 with initial condition . This gives transition probabilities denoted with and with . We then sum the contributions of doubly- and singly-occupied sites to obtain the average populations and . For example, we have
| (13) |
We assume the repumping efficiency to be independent from the filling factor for simplicity.
III.2 Lifetime of doubly-occupied sites
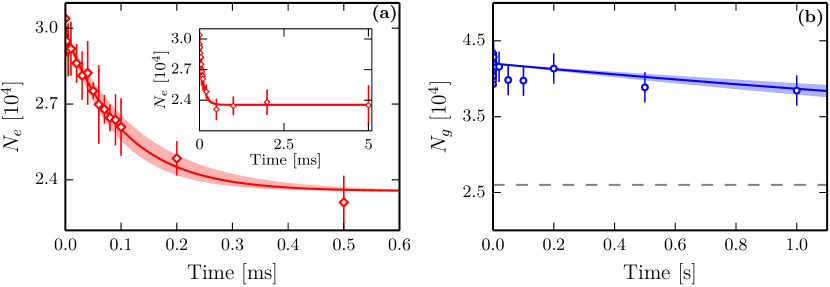
In this section we measure the inelastic loss rates and . We first investigate the role of inelastic collisions. After a coupling laser pulse of area [ Hz] in order to obtain a substantial population of , we apply a removal pulse (see Sec. II.2.2) to get rid of remaining atoms in state . We are then left with a collection of singly- and doubly-occupied sites where all atoms are in the excited state . We show in Fig. 3a the measured lifetime of this sample. We detect a fast exponential decay at short times which we interpret as the consequence of inelastic collisions. For longer times, we observe a plateau corresponding to the remaining atoms in singly-occupied sites. The exponential decay rate is a direct measurement of .
A similar technique is used to investigate the role of inelastic collisions. We apply a coupling laser pulse of area [ Hz] in order to obtain a substantial population of . We measure the atom number in the ground state which is expected to decay as . Fig. 3b shows a typical measurement, where almost no losses occur even after one second. In order to extract a damping rate, we fix the initial populations using the model in Sec. III.1. An exponential fit to the data, with a rate as the only free parameter, yields . The projected asymptote of the decay is represented with the dashed line in Fig. 3b. We measure a similar lifetime for atoms in in the absence of the coupling laser. Hence the measured damping rate is only an upper bound for .
III.3 Spectroscopy of elastic interactions
We now turn to the determination of elastic interaction parameters and . To this end, we perform spectroscopic experiments probing doubly-occupied sites. The method is illustrated in Fig. 4a-b, and the measurements shown in Fig. 4c-d.
The determination of is best performed in a perturbative limit, where the pulse area and the population of remain small (Fig. 4a). The time evolution of then reduces to that of a two-level system resonant for . This resonance is well-resolved provided that the Rabi frequency is much smaller than .
In order to extract the interaction strength , one could in principle use a two-photon resonance directly linking and . This requires a weak enough Rabi frequency and , where is an interaction shift and where is the two-photon detuning. Under these conditions, the intermediate state can be adiabatically eliminated, and the dynamics reduces to that of an effective two-level system. The difference can therefore be directly measured from the location of the two-photon resonance. Practically, this idealized experiment is difficult to perform for weak coupling due to the strong loss rate , which gives a substantial width to the two-photon resonance. In order to circumvent this issue, we perform the experiment at a larger Rabi frequency, and make use of the losses by measuring after a clock pulse of area (Fig. 4b). The “background signal” from singly-occupied sites is minimized near resonance, whereas doubly-occupied sites show a pronounced feature due to losses located at . Even for large Rabi frequencies, we find that the loss spectral feature in the total signal is only weakly affected by the intermediate state (inset of Fig. 4b).
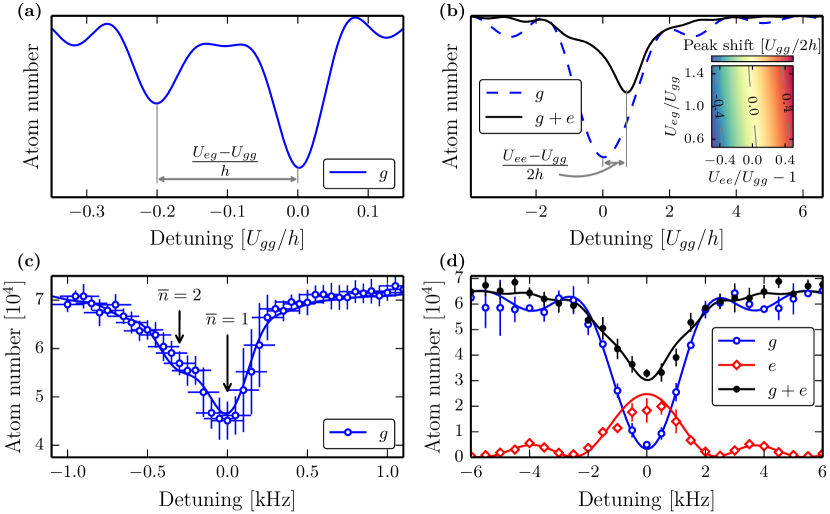
The experimental results are presented in Fig. 4c-d. Data is centered so that corresponds to the single-atom resonance. The measurement of (Fig. 4c) is done with a weak Rabi frequency Hz and displays a “shoulder” near Hz. This corresponds to the signal from doubly occupied sites. On the other hand, the measurement of (Fig. 4d), performed at strong Rabi frequency Hz, shows a loss peak almost coincident with Hz, or equivalently . To extract quantitative values, we fit the prediction of the model from Sec. III.1 to the experimental spectra (solid and dashed lines in Fig. 4c-d). We fix the normalized populations , the loss rates , and the initial atom number to their measured values and leave the Rabi frequencies , , the interaction energies , and the repumping efficiency as free parameters. The prediction of the model has been further convolved with a Gaussian function to account for frequency jitter of the clock laser, the width being left as an extra free parameter. We obtain Hz, Hz and %, consistent with our calibrations. The width of the convolving Gaussian Hz, is consistent with the narrowest spectrum we could observe, as discussed in Sec. II.2.3. Finally we extract Hz and Hz, in agreement with the qualitative discussion above. The error bars represent statistical % confidence intervals on the optimal values of and , obtained by the bootstrap method.
III.4 Determination of atomic parameters
The ratio of the elastic interaction parameters and to is directly proportional to the ratio of the respective scattering lengths. From our calibration of (see appendix) we get
| (14) | |||||
| (15) |
The error bars do not account for possible systematic errors (for instance, in determining ). Combining our measurements and the value from kitagawa2008a , we obtain the scattering lengths , . We thus find all scattering lengths involving the clock states of 174Yb equal within 20 % hoffer2016 . The near-equality of the scattering lengths is somewhat surprising. These observations differ markedly from the fermionic 173Yb isotope, where the equivalent scattering lengths have been found very different from one another capellini2014a ; scazza2014a .
We also extract from the loss rate the two-body loss rate constant that enters into the rate equation [the relation between the two is ]. We find
| (16) |
This value is in line with comparable measurements in strontium or fermionic ytterbium scazza2014a ; traverso2009a ; ludlow2011a . As noted in Sec. III.2, we can only give an upper bound on the rate constant . Low inelastic loss rates were also observed for fermionic 173Yb scazza2014a and 87Sr Bishof2011a .
During the preparation of the manuscript, we learnt about similar experiments performed at LENS in Florence Franchi2017a . Their results agree with ours within the uncertainties.
IV Conclusion
In conclusion, we have performed spectroscopy of a bosonic ytterbium Mott insulator using an optical clock transition. The high spectral resolution allows us to be sensitive to the on-site number statistics. Singly-occupied sites display long-lived coherent oscillations between and whereas the dynamics of doubly-occupied sites is strongly affected by two-body elastic and inelastic interactions. We extract the inelastic loss constants from lifetime measurements, and the elastic interaction parameters from spectroscopy. The resulting intra- and inter-states scattering lengths , and turn out to be very close to one another.
The large inelastic loss rate for two atoms in at the same lattice site leads to sub-ms lifetimes. Such high rates are in line with measurements on other group-II atoms traverso2009a ; ludlow2011a , and are clearly a threat to experiments where such double occupancies can arise. Several solutions can be enforced to avoid this situation. If tunneling is irrelevant or detrimental (as in optical clocks), one can choose to work in a regime where only a Mott insulator with unit occupancy arises. This requires careful engineering of the auxiliary potential , but it seems within current experimental capability even for a large atom number of several . In a regime where tunneling cannot be neglected, one could imagine using an “interaction blockade”, where transitions to sites with double occupancy will always be off resonant and thereby inefficient. The near-equality of , and for 174Yb restricts this method to very low Rabi frequencies. Finally, the large inelastic rate suggests that the analog of the “quantum Zeno” suppression of losses syassen2008a ; yan2013a ; zhu2014a could occur in our system, where strong losses confine the system to a lossless subspace for a suitable initial state and weak enough coupling. This provides a natural direction for future work in a true Hubbard regime where both interactions and tunneling play a role.
Acknowledgments: We thank M. Höfer and S. Fölling for discussions and for sharing their experimental results with us. We also thank G. Cappellini, J. Catani, L. Fallani and the LENS ytterbium team for stimulating discussions during the program “From Static to Dynamical Gauge Fields with Ultracold Atoms” (Galileo Galilei Institute, Florence). We are grateful to S. Nascimbène and J. Dalibard for their careful reading of the manuscript.
References
- (1) A. D. Ludlow, M. M. Boyd, J. Ye, E. Peik, and P. O. Schmidt. Optical atomic clocks. Rev. Mod. Phys., 87:637–701, Jun 2015.
- (2) A. V. Gorshkov, A. M. Rey, A. J. Daley, M. M. Boyd, J. Ye, P. Zoller, and M. D. Lukin. Alkaline-earth-metal atoms as few-qubit quantum registers. Phys. Rev. Lett., 102:110503, March 2009.
- (3) A. J. Daley. Quantum computing and quantum simulation with group-II atoms. Quantum Inf. Process., 10(6):865–884, 2011.
- (4) A. V. Gorshkov, M. Hermele, V. Gurarie, C. Xu, P. S. Julienne, J. Ye, P. Zoller, E. Demler, M. D. Lukin, and A. M. Rey. Two-orbital magnetism with ultracold alkaline-earth atoms. Nat. Phys., 6(4):289–295, April 2010.
- (5) F. Gerbier and J. Dalibard. Gauge fields for ultracold atoms in optical superlattices. New J. Phys., 12(3):033007, 2010.
- (6) M. J. Martin, M. Bishof, M. D. Swallows, X. Zhang, C. Benko, J. von Stecher, A. V. Gorshkov, A. M. Rey, and J. Ye. A quantum many-body spin system in an optical lattice clock. Science, 341(6146):632–636, 2013.
- (7) N. Goldman, F. Gerbier, and M. Lewenstein. Realizing non-abelian gauge potentials in optical square lattices: an application to atomic Chern insulators. J. Phys. B: At. Mol. Opt. Phys., 46(13):134010, 2013.
- (8) A. M. Rey, A. V. Gorshkov, C. V. Kraus, M. J. Martin, M. Bishof, M. D. Swallows, X. Zhang, C. Benko, J. Ye, N. D. Lemke, and A. D. Ludlow. Probing many-body interactions in an optical lattice clock. Ann. Phys., 340(1):311–351, 2014.
- (9) S. Kolkowitz, S. L. Bromley, T. Bothwell, M. L. Wall, G. E. Marti, A. P. Koller, X. Zhang, A. M. Rey, and J. Ye. Spin-orbit-coupled fermions in an optical lattice clock. Nature, 542(7639):66–70, February 2017.
- (10) L. F. Livi, G. Cappellini, M. Diem, L. Franchi, C. Clivati, M. Frittelli, F. Levi, D. Calonico, J. Catani, M. Inguscio, and L. Fallani. Synthetic dimensions and spin-orbit coupling with an optical clock transition. Phys. Rev. Lett., 117:220401, Nov 2016.
- (11) G. Cappellini, M. Mancini, G. Pagano, P. Lombardi, L. Livi, M. Siciliani de Cumis, P. Cancio, M. Pizzocaro, D. Calonico, F. Levi, C. Sias, J. Catani, M. Inguscio, and L. Fallani. Direct observation of coherent interorbital spin-exchange dynamics. Phys. Rev. Lett., 113:120402, September 2014.
- (12) F. Scazza, C. Hofrichter, M. Höfer, P. C. De Groot, I. Bloch, and S. Fölling. Observation of two-orbital spin-exchange interactions with ultracold -symmetric fermions. Nat. Phys., 10(10):779–784, October 2014.
- (13) L. Riegger, N. Darkwah Oppong, M. Höfer, D. Rio Fernandes, I. Bloch, and S. Fölling. Localized magnetic moments with tunable spin exchange in a gas of ultracold fermions. arXiv:1708.03810, 2017.
- (14) S. L. Campbell, R. B. Hutson, G. E. Marti, A. Goban, N. Darkwah Oppong, R. L. McNally, L. Sonderhouse, J. M. Robinson, W. Zhang, B. J. Bloom, and J. Ye. A Fermi-degenerate three-dimensional optical lattice clock. arXiv:1702.01210, 2017.
- (15) G. K. Campbell, M. M. Boyd, J. W. Thomsen, M. J. Martin, S. Blatt, M. D. Swallows, T. L. Nicholson, T. Fortier, C. W. Oates, S. A. Diddams, N. D. Lemke, P. Naidon, P. Julienne, J. Ye, and A. D. Ludlow. Probing interactions between ultracold fermions. Science, 324(5925):360–363, 2009.
- (16) T. C. Killian, D. G. Fried, L. Willmann, D. Landhuis, S. C. Moss, T. J. Greytak, and D. Kleppner. Cold collision frequency shift of the - transition in hydrogen. Phys. Rev. Lett., 81:3807–3810, Nov 1998.
- (17) S. Fölling, A. Widera, T. Müller, F. Gerbier, and I. Bloch. Formation of spatial shell structure in the superfluid to Mott insulator transition. Phys. Rev. Lett., 97:060403, Aug 2006.
- (18) G. K. Campbell, J. Mun, M. Boyd, P. Medley, A. E. Leanhardt, L. G. Marcassa, D. E. Pritchard, and W. Ketterle. Imaging the mott insulator shells by using atomic clock shifts. Science, 313(5787):649–652, 2006.
- (19) I. Bloch, J. Dalibard, and W. Zwerger. Many-body physics with ultracold gases. Rev. Mod. Phys., 80(3):885, 2008.
- (20) A. Yamaguchi, S. Uetake, S. Kato, H. Ito, and Y. Takahashi. High-resolution laser spectroscopy of a Bose-Einstein condensate using the ultranarrow magnetic quadrupole transition. New J. Phys., 12(10):103001, 2010.
- (21) S. Kato, K. Inaba, S. Sugawa, K. Shibata, R. Yamamoto, M. Yamashita, and Y. Takahashi. Laser spectroscopic probing of coexisting superfluid and insulating states of an atomic Bose-Hubbard system. Nat. Commun., 7:11341, April 2016.
- (22) A. Dareau, M. Scholl, Q. Beaufils, D. Döring, J. Beugnon, and F. Gerbier. Doppler spectroscopy of an ytterbium Bose-Einstein condensate on the clock transition. Phys. Rev. A, 91:023626, February 2015.
- (23) M. Scholl, Q. Beaufils, A. Dareau, D. Döring, M. Bosch Aguilera, R. Bouganne, J. Beugnon, and F. Gerbier. Hofstadter optical lattice for ultracold ytterbium atoms. In 2016 European Frequency and Time Forum (EFTF), pages 1–4, April 2016.
- (24) Z. W. Barber, J. E. Stalnaker, N. D. Lemke, N. Poli, C. W. Oates, T. M. Fortier, S. A. Diddams, L. Hollberg, C. W. Hoyt, A. V. Taichenachev, and V. I. Yudin. Optical lattice induced light shifts in an Yb atomic clock. Phys. Rev. Lett., 100:103002, March 2008.
- (25) V. A. Dzuba and A. Derevianko. Dynamic polarizabilities and related properties of clock states of the ytterbium atom. J. Phys. B: At. Mol. Opt. Phys., 43(7):074011, 2010.
- (26) O. Morsch and M. Oberthaler. Dynamics of Bose-Einstein condensates in optical lattices. Rev. Mod. Phys., 78:179–215, Feb 2006.
- (27) T. Gericke, F. Gerbier, A. Widera, S. Fölling, O. Mandel, and I. Bloch. Adiabatic loading of a Bose-Einstein condensate in a 3D optical lattice. J. Mod. Opt., 54(5):735–743, 2007.
- (28) M. Kitagawa, K. Enomoto, K. Kasa, Y. Takahashi, R. Ciuryło, P. Naidon, and P. S. Julienne. Two-color photoassociation spectroscopy of ytterbium atoms and the precise determinations of -wave scattering lengths. Phys. Rev. A, 77:012719, Jan 2008.
- (29) M. Greiner, O. Mandel, T. W. Hänsch, and I. Bloch. Collapse and revival of the matter wave field of a Bose-Einstein condensate. Nature, 419(6902):51–54, September 2002.
- (30) I. B. Spielman, W. D. Phillips, and J. V. Porto. Mott-insulator transition in a two-dimensional atomic Bose gas. Phys. Rev. Lett., 98:080404, Feb 2007.
- (31) B. Capogrosso-Sansone, Ş. G. Söyler, N. Prokof’ev, and B. Svistunov. Monte Carlo study of the two-dimensional Bose-Hubbard model. Phys. Rev. A, 77:015602, Jan 2008.
- (32) K. Jiménez-García, R. L. Compton, Y.-J. Lin, W. D. Phillips, J. V. Porto, and I. B. Spielman. Phases of a two-dimensional Bose gas in an optical lattice. Phys. Rev. Lett., 105:110401, Sep 2010.
- (33) L. Ma, P. Jungner, J. Ye, and J. L. Hall. Delivering the same optical frequency at two places: accurate cancellation of phase noise introduced by an optical fiber or other time-varying path. Opt. Lett., 19(21):1777–1779, Nov 1994.
- (34) A. V. Taichenachev, V. I. Yudin, C. W. Oates, C. W. Hoyt, Z. W. Barber, and L. Hollberg. Magnetic field-induced spectroscopy of forbidden optical transitions with application to lattice-based optical atomic clocks. Phys. Rev. Lett., 96:083001, Mar 2006.
- (35) Z. W. Barber, C. W. Hoyt, C. W. Oates, L. Hollberg, A. V. Taichenachev, and V. I. Yudin. Direct excitation of the forbidden clock transition in neutral atoms confined to an optical lattice. Phys. Rev. Lett., 96:083002, March 2006.
- (36) C. J. Bowers, D. Budker, E. D. Commins, D. DeMille, S. J. Freedman, A.-T. Nguyen, S.-Q. Shang, and M. Zolotorev. Experimental investigation of excited-state lifetimes in atomic ytterbium. Phys. Rev. A, 53:3103–3109, May 1996.
- (37) Although a misalignment of the clock beam could also increase the damping rate, this would entail a reduction of the maximum achievable Rabi frequency, which we do not observe.
- (38) F. Dalfovo, S. Giorgini, L. P. Pitaevskii, and S. Stringari. Theory of Bose-Einstein condensation in trapped gases. Rev. Mod. Phys., 71:463, 1999.
- (39) T. Fukuhara, S. Sugawa, Y. Takasu, and Y. Takahashi. All-optical formation of quantum degenerate mixtures. Phys. Rev. A, 79:021601, Feb 2009.
- (40) Earlier, unpublished experiments obtained at LMU in Munich are consistent with our measurements [M. Höfer and S. Fölling, private communication, 2016].
- (41) A. Traverso, R. Chakraborty, Y. N. Martinez de Escobar, P. G. Mickelson, S. B. Nagel, M. Yan, and T. C. Killian. Inelastic and elastic collision rates for triplet states of ultracold strontium. Phys. Rev. A, 79:060702, Jun 2009.
- (42) A. D. Ludlow, N. D. Lemke, J. A. Sherman, C. W. Oates, G. Quéméner, J. von Stecher, and A. M. Rey. Cold-collision-shift cancellation and inelastic scattering in a Yb optical lattice clock. Phys. Rev. A, 84:052724, November 2011.
- (43) M. Bishof, M. J. Martin, M. D. Swallows, C. Benko, Y. Lin, G. Quéméner, A. M. Rey, and J. Ye. Inelastic collisions and density-dependent excitation suppression in a 87Sr optical lattice clock. Phys. Rev. A, 84:052716, Nov 2011.
- (44) L. Franchi, L. F. Livi, G. Cappellini, G. Binella, M. Inguscio, J. Catani, and L. Fallani. State-dependent interactions in ultracold 174Yb probed by optical clock spectroscopy. New J. Phys., 19(10):103037, 2017.
- (45) N. Syassen, D. M. Bauer, M. Lettner, T. Volz, D. Dietze, J. J. García-Ripoll, J. I. Cirac, G. Rempe, and S. Dürr. Strong dissipation inhibits losses and induces correlations in cold molecular gases. Science, 320(5881):1329–1331, 2008.
- (46) B. Yan, S. A. Moses, B. Gadway, J. P. Covey, K. R. A. Hazzard, A. M. Rey, D. S. Jin, and J. Ye. Observation of dipolar spin-exchange interactions with lattice-confined polar molecules. Nature, 501(7468):521–525, September 2013.
- (47) B. Zhu, B. Gadway, M. Foss-Feig, J. Schachenmayer, M. L. Wall, K. R. A. Hazzard, B. Yan, S. A. Moses, J. P. Covey, D. S. Jin, J. Ye, M. Holland, and A. M. Rey. Suppressing the loss of ultracold molecules via the continuous quantum Zeno effect. Phys. Rev. Lett., 112:070404, Feb 2014.
*
Appendix A Collapse and revival experiment
We have performed a collapse and revival experiment following [29] to determine experimentally the interaction strength . We first prepare our system in a superfluid state by loading the atoms in a lattice with depths and . Rapidly quenching the HL depths to suppresses tunneling in the plane, and triggers a coherent interaction-driven evolution where first-order spatial coherence periodically collapses and revives with period (Fig. 5a-b). In a non-uniform system, the period of revivals is determined by alone (which can be taken uniform over the lattice with an error smaller than 1 %), but the revival amplitude progressively decreases due to the inhomogeneous dephasing introduced by the auxiliary trap [29]. To extract the period without detailed modeling of the system, we fit equidistant Gaussian functions to our experimental data (Fig. 5b). In this way we account phenomenologically for the inhomogeneous damping as in [29].