Metastable morphological states of catalytic nanoparticles
Abstract
During the catalytic synthesis of graphene, nanotubes, fibers, and other nanostructures, many intriguing phenomena occur, such as phase separation, precipitation, and analogs of capillary action. We demonstrate that catalytic nanoparticles display metastable states that influence growth, reminiscent of some protein ensembles in vivo. As a carbon nanostructure grows, the nanoparticle elongates due to an energetically favorable metal-carbon interaction that overrides the surface energy increase of the metal. The formation of subsequent nested tubes, however, drives up the particle’s free energy, but the particle remains trapped until an accessible free energy surface allows it to exit the tube. During this time, the nanoparticle continues to catalyze tube growth internally within the nested structure. This nonequilibrium thermodynamic cycle of elongation and retraction is heavily influenced by tapering of the structure, which, ultimately, determines the final product and catalyst lifetime. Our results provide a unifying framework to interpret similar phenomena for other catalytic reactions, such as during CO oxidation, and suggest routes to the practical optimization of such processes.
Advances in catalytic growth – especially chemical vapor deposition [1,2] – of carbon nanostructures are paving the way for their ubiquitous application in technologies. Their exceptional thermal, electronic, and mechanical properties [3–9] are primarily determined by their structure, which is in turn determined by their growth conditions (composition, size, and shape of the catalyst, support, temperature, etc.). However, the product is invariably a mixture of all possible carbon nanostructures instead of a single phase with the desired properties for a specific application. Understanding the chemical and morphological evolution of catalyst particles during nanostructure nucleation and growth will help determine conditions needed for controlled synthesis.
Recently, environmental transmission electron microscope (ETEM) has been successfully employed to follow the nucleation and growth of various carbon nanostructures on catalytic particles [10–12]. One perplexing observation is the appearance of morphological changes of the metal catalysts [10,13,14], first reported by Helveg et al. [10] using ETEM imaging. In this Letter, we provide a thermodynamic explanation of the elongation-retraction cycle of catalytic nanoparticles and compare with high resolution ETEM videos of bamboo-like carbon nanotube (BCNT) growth on nickel nanoparticles supported on SiO2, see the Supplemental Information (SI) for experimental details. The elongation-retraction cycle occurs for different metal catalysts and conditions, as well as for other structures, such as boron nitride nanotubes. Moreover, our model should be extendable to other catalytic processes where morphological changes occur, such as surface oscillations in Pt nanoparticles during catalytic oxidation of CO [15].
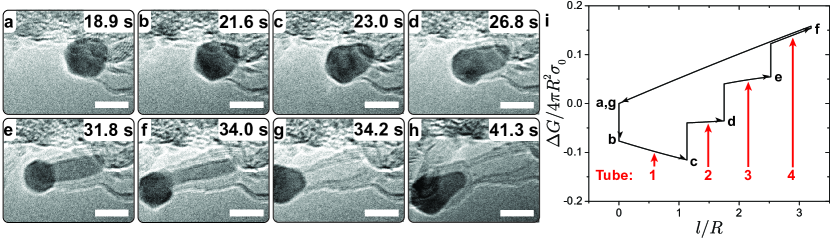
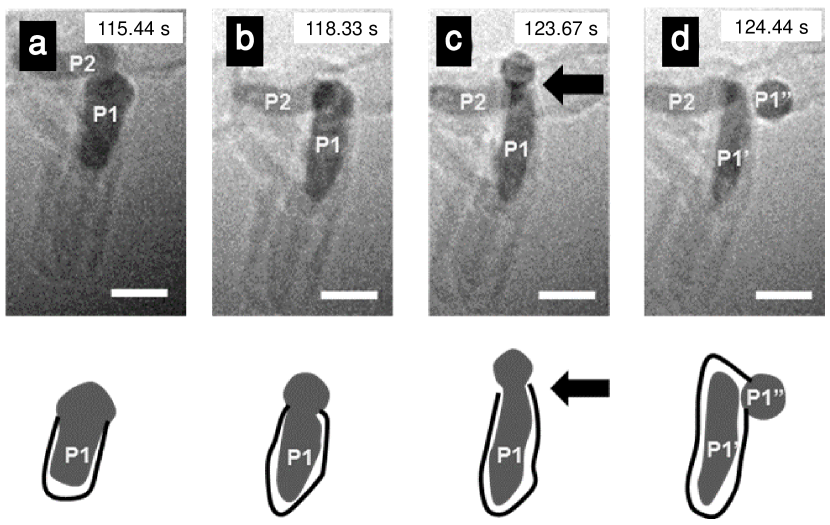
Figure 1a-h shows an elongation-retraction cycle of nickel growing a BCNT (see also Movie S1). After nucleation, the metal-carbon interaction makes it energetically favorable for the catalyst particle to deform with the elongating tube so long as the radius is above a threshold value. However, as further tubes form internally to make a multi-walled structure, eventually the elongated state is unfavorable. The particle, though, remains pinned in the structure. Only when the innermost tube is both small and long enough will the nanoparticle be “released” and the process will repeat.
This morphological change is energetically costly in terms of the particle’s surface energy (a change of 100’s of eV as the particle deviates from a spherical form), but the metal-carbon interaction compensates for this: The elongation results in a change in the metal surface area of , with an energy penalty , where is the surface energy density ( eV/nm2 for nickel [16,17]). However, the deformation also allows a contact area , that lowers the energy by , where is the metal-carbon interaction energy density [24].
These give the dominant contributions to the Gibbs free energy change, , for the particle going from its spherical form, , to the elongated “pear shape”, ,
| (1) |
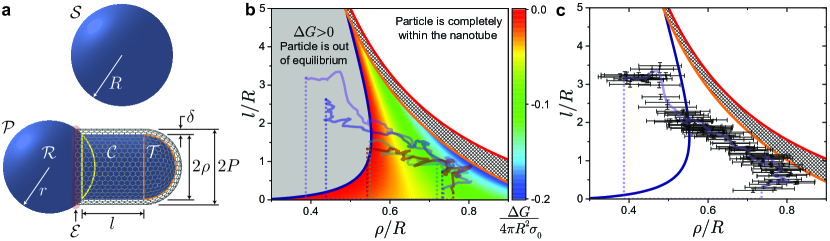
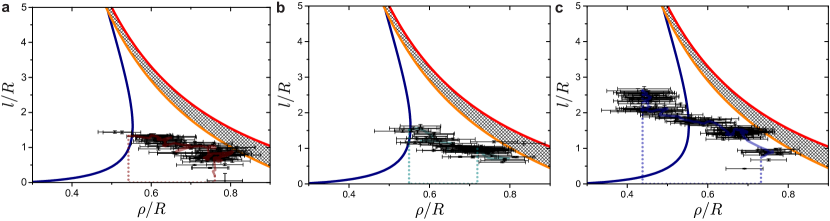
This determines whether the particle is thermodynamically favored to be outside () or inside () the carbon nanostructure. Considering structures consisting of only spherical and cylindrical regions (Fig. 2a), we have and with the radius of the initial spherical nanoparticle, the radius of the spherical region outside the tube, and the length and radius of the elongated region . The nanotube radius is , where nm is the gap between the carbon and the metal [13,19]. The quantity is the height of the region of overlap between and (outlined in yellow in Fig. 2a). When the particle tapers at an angle (i.e., it has a conical form), these expressions change (see the SI for the full calculation).
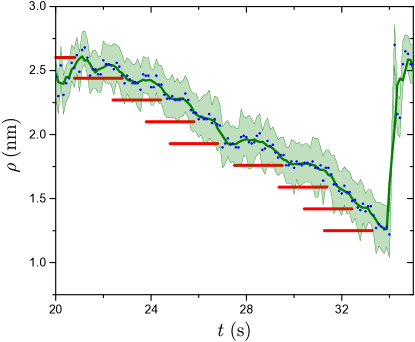
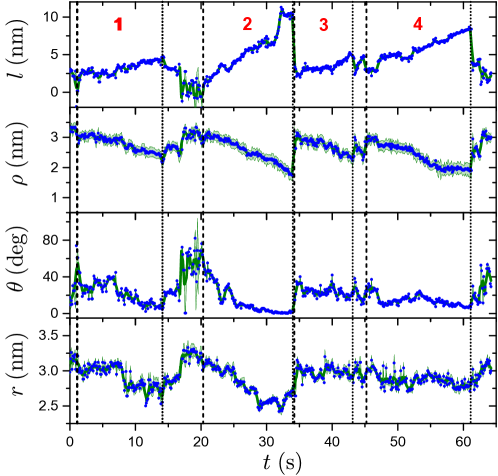
Figure 1i shows the corresponding idealized Gibbs free energy for Fig. 1a-g, which resembles the well-known Carnot and Otto thermodynamic cycles [20]. However, here the processes are approximately iso-radial and iso-longitudinal (i.e., constant length), as opposed to isothermal, isobaric, etc. (and, as we will see, also out of equilibrium). Step-like features are visible in the observed trajectories, Fig. 2b,c, especially in radius versus time, Fig. 3.
Within the cycle shown in Fig. 1i, the particle’s free energy does not always decrease. Depending on the inner tube radius, the free energy of the particle can be pushed upwards, which occurs for Fig. 1cd onward. In this case, the inner tube radii are smaller than the threshold value (see the SI)
| (2) |
where gives an effective (dimensionless) surface energy and is the ratio of metal-carbon interaction to metal surface energy density. For an innermost tube radius below this threshold, the elongation of the particle requires work, i.e., – work provided by carbon addition.
While carbon addition can serve as an effective driving force for particle deformation, the free energy eventually becomes positive with decreasing tube radius and the particle is thermodynamically favored to be outside of the structure. At this point, the particle will lower its free energy if it can escape from the tube and restore its spherical form. This results in a phase diagram for particle morphology where a critical line – determined by the geometry and interaction parameter – demarcates the regimes where elongation is favorable and unfavorable, see Fig. 2b. The figure also shows the retracted and elongated structures and the morphological trajectories ( and of the particle versus time) from the ETEM videos. Figures S1 and S2 show the automated data analysis method and Figs. S3-S8 give additional schematic and trajectory information.
Even when it is unfavorable for the particle to be in the tube, it is still found there actively catalyzing tube growth internally to the structure. That is, the out-of-equilibrium particle continues to function, allowing for both longer and more tubes to grow. For the particle to escape, the particle tip, , must detach from the tube cap, which requires overcoming an energy barrier. Thus, nested tube addition and further elongation occurs until the particle can transition to a different free energy surface – one where it is not attached to the tube cap – and exit the tube. The energy barrier, though, is substantial. Without surface restructuring and tapering, the barrier is (e.g., in Fig. 2c greater than 50 eV for most of the cycle) – even though the change in free energy for the complete retraction is negative. Taking into account optimal restructuring at (i.e., the curvature at the tip decreasing to that at , see the SI), the free energy difference (relative to the spherical form ) during retraction is Eq. (1) with the areas replaced by and . The path fg in Fig. 1i shows the free energy difference as the particle retracts on this alternate free energy surface, where we include both restructuring and tapering (i.e., the conical form of the elongated region, see the SI). However, for the cycle shown in Fig. 1 (and Figs. 2c and 3), the tapering angle is only in the highly elongated form.
We note that the barrier to retraction after the fourth tube is added is on the order of 1/1000th the total surface free energy (), or less than 10 eV. This barrier is easily overcome by further restructuring, faceting, or other mechanisms, and, in any case, is certainly within the uncertainties of the data and limitations of the model. The particle would have to overcome a barrier almost an order of magnitude larger in order to retract before the fourth tube forms (while more drastic restructuring, etc., may suppress such a barrier, this process will be much slower).
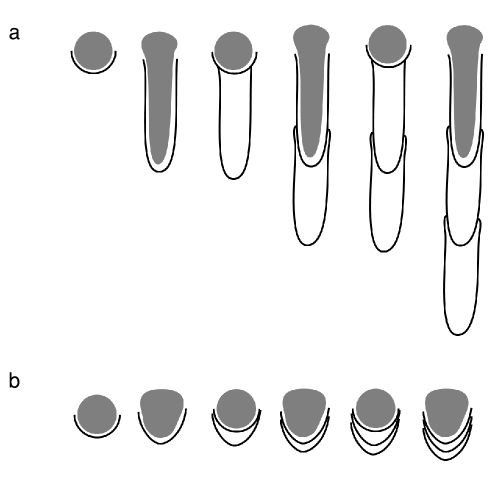
Moreover, tapering – already discussed above – frequently occurs. Figure 4 shows the effect of tapering on the particle morphology. For inward tapering (Fig. 4a), the barrier to retraction can be substantially reduced as the particle tip has a smaller contact area with the carbon nanostructure. Indeed, the two curves – one for elongation and one for retraction – rapidly approach each other (and even cross), indicating that the particle will detach from the carbon nanostructure at the tip and retraction will occur. When this occurs in the regime , the retraction will only be partial, as it is uphill for the particle to completely exit the nanostructure. There are no thermodynamic forces that can push the particle up this hill (carbon structure growth can only perform work outward along the particle’s length or, during tube addition, radially inward). The analytical model we present explains this behavior quantitatively. Moreover, this demonstrates why the presence of inward tapering promotes carbon nanofiber formation (over bamboo or tubular structures): Once a tapered carbon nanostructure forms, the shorter elongation and incomplete retraction favor the formation of stacked canonical carbon structures (see Fig. S6). Larger nanoparticles, for instance, display more tapering (see Fig. S7). This may be a result of particle curvature – the cap forms to conform to the particle, giving a conical rather than a semi-spherical cap (kinetics may also play a role here).
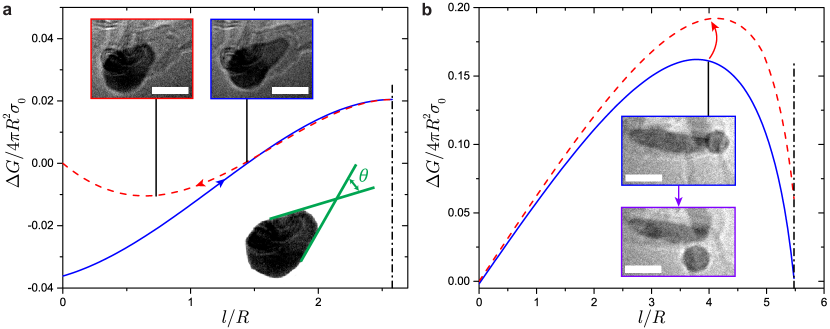
Outward tapering (i.e., flaring) has an even more drastic effect. Figure 4b (also see Movie S2 and Fig. S8) shows elongation and retraction curves for an outward tapered particle (, where the minus sign indicates outward tapering). The particle can retract when is small. However, nested tube addition pushes the particle onto the elongation curve at large . At this point, there is already a substantial energetic barrier to transition onto the retraction curve and exit the tube. Thus, even in the absence of barriers to diffusion, the particle is trapped in the tube, which eventually encapsulates part of the nanoparticle, breaking it into two (see the inset in Fig. 4b). Such elongated residues have often been observed during ex situ imaging of the CNT grown in CVD reactors [22,23] and our model helps understand this limit on the homogeneity of catalytic products.
In summary, the above model quantitatively captures the morphology
of the catalyst nanoparticles during CNT growth as observed via in
situ ETEM imaging. It is favorable metal-carbon interaction, work
from tube growth, geometry, and the presence of energy barriers that
steer the morphology of the catalytic nanoparticle. While Refs. [10]
and [14] discuss the diffusion of nickel atoms, our model demonstrates
the non-equilibrium, cyclical nature of the elongation and retraction,
showing that metastability allows the catalyst to continue growing
the structure. Tapering explains partial retraction and particle length,
helping to understand the formation of fibers and end-product homogeneity.
The model suggests that, for example, altering the value of (the
ratio of metal-carbon interaction to metal surface energy density)
via, e.g., mixed-metal nanoparticles can encourage certain morphologies
and the growth of particular carbon nanomaterials. Moreover, our results
pose new questions about the role of faceting/surface structure, carbide
formation, the support, rim binding, and kinetics, ones that will
open up novel directions in the investigation and classification of
catalytic behavior.
P. A. L. acknowledges support under the Cooperative Research Agreement between the University of Maryland and the National Institute for Standards and Technology Center for Nanoscale Science and Technology, Award 70NANB10H193, through the University of Maryland. We would like to thank S. Zhu, T. Li, and S. Deffner for helpful discussions.
-
[1]
H. Yan, Q. Li, J. Zhang, and Z. Liu, Carbon 40, 2693 (2002).
-
[2]
J. Kong, H. T. Soh, A. M. Cassell, C. F. Quate, and H. Dai, Nature 395, 878 (1998).
-
[3]
M. F. L. De Volder, S. H. Tawfick, R. H. Baughman, and A. J. Hart, Science 339, 535 (2013).
-
[4]
A. D. Franklin, Nature 498, 443 (2013).
-
[5]
Z. Han and A. Fina, Prog. Polym. Sci. 36, 914 (2011).
-
[6]
M. J. O’Connell, Science 297, 593 (2002).
-
[7]
S. Ogata and Y. Shibutani, Phys. Rev. B 68, 165409 (2003).
-
[8]
S. M. Bachilo, Science 298, 2361 (2002).
-
[9]
B. I. Yakobson and P. Avouris, in Carbon Nanotub., edited by M. S. Dresselhaus, G. Dresselhaus, and P. Avouris (Springer Berlin Heidelberg, Berlin, Heidelberg, 2001), pp. 287–327.
-
[10]
S. Helveg, C. L pez-Cartes, J. Sehested, P. L. Hansen, B. S. Clausen, J. R. Rostrup-Nielsen, F. Abild-Pedersen, and J. K. Nørskov, Nature 427, 426 (2004).
-
[11]
H. Amara, C. Bichara, and F. Ducastelle, Phys. Rev. Lett. 100, 056105 (2008).
-
[12]
Y. Ohta, Y. Okamoto, A. J. Page, S. Irle, and K. Morokuma, ACS Nano 3, 3413 (2009).
-
[13]
E. Pigos, E. S. Penev, M. A. Ribas, R. Sharma, B. I. Yakobson, and A. R. Harutyunyan, ACS Nano 5, 10096 (2011).
-
[14]
M. Moseler, F. Cervantes-Sodi, S. Hofmann, G. Cs nyi, and A. C. Ferrari, ACS Nano 4, 7587 (2010).
-
[15]
S. B. Vendelbo, C. F. Elkjær, H. Falsig, I. Puspitasari, P. Dona, L. Mele, B. Morana, B. J. Nelissen, R. van Rijn, J. F. Creemer, P. J. Kooyman, and S. Helveg, Nat. Mater. 13, 884 (2014).
-
[16]
T. A. Roth, Mater. Sci. Eng. 18, 183 (1975).
-
[17]
F. R. de Boer, Cohesion in Metals: Transition Metal Alloys, 2 (North Holland, Amsterdam, 1988).
-
[18]
M. Picher, P. A. Lin, J. L. Gomez-Ballesteros, P. B. Balbuena, and R. Sharma, Nano Lett. 14, 6104 (2014).
-
[19]
P. A. Khomyakov, G. Giovannetti, P. C. Rusu, G. Brocks, J. van den Brink, and P. J. Kelly, Phys. Rev. B 79, 195425 (2009).
-
[20]
H. B. Callen, Thermodynamics and an Introduction to Thermostatistics, 2nd ed (Wiley, New York, 1985).
-
[21]
R. Rao, R. Sharma, F. Abild-Pedersen, J. K. Nørskov, and A. R. Harutyunyan, Sci. Rep. 4, 6510 (2014).
-
[22]
Z. He, J.-L. Maurice, A. Gohier, C. S. Lee, D. Pribat, and C. S. Cojocaru, Chem. Mater. 23, 5379 (2011).
-
[23]
J. Gao, J. Zhong, L. Bai, J. Liu, G. Zhao, and X. Sun, Sci. Rep. 4, 3606 (2014).
-
[24]
Although these particles partially convert to carbide during growth, the carbon structures (via the inner tube) attach to the metal terminated surfaces only, as reported for Co-based catalysts [18], and the interaction is not markedly influenced by the internal particle structure.
-
[25]
We note that only the innermost nanotube is included, as the outer tubes are expected only to play a secondary role in the elongated-to-retracted transition.
-
[26]
We note that other non-idealities can be present but not visible since the ETEM yields a 2D image.
-
[27]
This line thus delineates where the thermodynamic expression, Eq. (1), is valid and also where we expect different physical behavior due to faceting of the particle outside the tube (and potentially the removal of step edges that anchor the tube, e.g., causing rim detachment), giving a substantial energetic barrier that will halt elongation. In Fig. 1c, further elongation would approach this regime, i.e., where the radius of the elongated region of the particle is equal to width of the particle outside the tube.
-
[28]
We take and from immediately after the retraction using the automated data analysis values.
-
[29]
This is opposed to inward tapers, which reduce the barrier.
-
[30]
We note that the particle does not start off on the elongation curve at , but rather nested tube addition pushes the particle onto this curve at a large value for . The outward tapered particle might have been able to retract if it was pushed onto this curve at smaller .
-
[31]
The creation of two new surfaces in the metal particle of radius costs or about for the small radius neck shown in the top image. An increased contact of the external, spherical particle with the carbon nanostructure may actually lower the barrier to particle breakage. In any case, the tube growth can drive breakage, but it cannot drive retraction: There are no external processes that can assist the exiting of the particle (and the particle can not follow the blue line for decreasing as the tube would have to shrink), but there is a process that assists breakage.
-
[32]
We take and from measurements on the images.
Metastable morphological states of catalytic nanoparticles – Supplemental Information
Pin Ann Lin,1,2 Bharath Natarajan,3 Michael Zwolak,1, ***michael.zwolak@nist.gov and Renu Sharma1, †††renu.sharma@nist.gov
1 Center for Nanoscale Science and Technology, National Institute
of Standards and Technology, Gaithersburg, Maryland 20899, USA
2 Maryland NanoCenter, University of Maryland, College Park, Maryland, USA.
3 Materials Measurement Laboratory, National Institute of Standards and Technology Gaithersburg, MD 20899 USA
1 Environmental transmission electron microscope
We use an environmental transmission electron microscope (ETEM) [S1] operated at 200 kV to observe the CNT growth in situ. A Ni-SiOx catalyst is dry-loaded onto 200 mesh molybdenum TEM grids. The sample on the TEM grid is loaded onto a TEM heating holder and introduced into the ETEM column. The sample is heated to temperatures between 773 K and 798 K in vacuum. After approximately 30 min, C2H2 is introduced to initiate the CNT growth and a pressure of 0.39 Pa is maintained during growth. The movies are at a frame rate of 9 . Note that precision of our dimensional measurements is limited by the pixel resolution (0.066 nm) of the images.
2 Theory of elongation and retraction
2.1 Elongation in a cylindrical tube
When the bulk of the nanoparticle does not change appreciably, i.e., when the particle maintains its crystalline structure (as seen in ETEM observations [S2]) and ignoring atomic details, the Gibbs free energy change – the catalytic process is at constant temperature and pressure – for elongation with tube growth will have contributions only from the metal surface energy, the metal-carbon (surface) interaction, and surface configurations (entropy). The latter is likely to be small even at the elevated temperatures used for carbon nanostructure growth. Thus, including only the dominant terms, we have
| (S1) |
with
| (S2) |
and
| (S3) |
This gives Eq. (1) in the main text.
In addition, to compute the free energy, we need a volume constraint on the particle. Since the nickel remains crystalline, its total volume will be approximately conserved giving the equation
| (S4) |
The left hand side is the volume of the initial, spherical particle. The terms on the right hand side are, in order, the volume of the spherical region outside the tube, a correction term that subtracts the spherical cap of that same region (as the sphere is not complete), the volume of the cylinder inside the tube, and the volume of the hemispherical end of the cylinder. Equations (S1)- (S4) yield a set of dimensionless equations in terms of and (and ) only, which thus characterize the elongation. This indicates that the energetics of the morphological changes we examine are scale-invariant, contrary to what is widely believed [S3] (these changes will become slower, however, as the size of the particle increases). Faceting and the density of steps increase as the curvature increases. Thus, the scale invariance will be broken, but this is not expected to happen until the particle sizes are below about 1 nm to 2 nm [S1].
The first term in Eq. (S3) – the one proportional to only – is the surface energy of region . The second term has both the surface energy and metal-carbon interaction energy of the regions and . Note that the edge region, , where the tube binds to the metal, shown in Fig. 2a of the main text, is not included in these expressions, as here we are examining the conditions that determine when the particle will elongate with tube growth and retract from the tube later. For these processes, the rim region gives an approximately identical contribution to both the spherical and “pear” shapes (to fully understand the origin of tapering, though, a more detailed treatment of the rim region is necessary). We note that the outer tubes unbind from the particle during inner tube elongation, a process that likely has its origins in the kinetics of tube formation – smaller tubes elongate faster as they need less carbon to grow per unit length. When an outer tube detaches, there will be an energy penalty. This penalty is less than the gain in free energy due to the further elongation of the inner tube.
To go further than this descriptive account of the interactions, we need to express Eq. (S1), with the free energies given by Eqs. (S2) and (S3), in terms of and only, subjecting it to the volume constraint, Eq. (S4). Using the latter, the radius of region is
| (S5) |
where , , and . All of the radicands are positive within the region of interest and thus give real values for (when , i.e., when , gives the region demarcated by the red line in Fig. 3a,b of the main text). With this value of , we will automatically satisfy the volume constraint and we can write
| (S6) |
That is, the free energy change is a function of only and (or, when dimensionless, and ). As seen in Fig. 2 of the main text, the initial particle deformation (large ) falls within the regime where elongation is thermodynamically favored (). With decreasing , the morphology transitions into a regime where elongation is disfavored ().
The free energy for elongation, though, only yields a partial picture. We also want to know the local thermodynamic forces (the derivative of the free energy) and the barriers to transition to different free energy surfaces. Since we have , the derivative,
| (S7) |
with respect to length is straight forward to compute, but will yield unwieldy expressions. Instead, we will work with instead of . At fixed , a change in gives only a change in and vice versa. We can then compute and transform back into a function of and . In some sense, the variables and are more natural for calculations. However, is not the most transparent variable for understanding elongation. Using Eq. (S4), we have
| (S8) |
which allows us to get both and . We then find
| (S9) |
Using Eq. (S5) for gives also the desired derivative as a function of the right arguments. The transition
| (S10) |
demarcates the region where particle elongation with nanotube growth will happen spontaneously from that where it requires work. From Eq. (S9), the transition line for spontaneous elongation (not to be confused with the transition line, , which is related but different) is
| (S11) |
where we define as the radius of the outer region on the transition line. Thus, the transition line is solely dependent on the ratio through an effective (dimensionless) surface energy density of the particle within the nanotube, . With units, this is , which gives the effective surface energy density of the elongated region in terms of the metal surface energy attenuated by the metal-carbon interaction. This allows us to find – the length of the tube at the transition line – versus by putting Eq. (S11) into Eq. (S8), at
| (S12) |
with the effective dimensionless surface energy. To make this expression more transparent, we can solve for the value of when . This occurs at at
| (S13) |
with corrections that are fourth order in (in other words, even for moderate metal-carbon interaction strengths, e.g., , the perturbative expression is accurate). Moreover, in the regime the experimental measurements are in (i.e., not very small), the transition line is essentially
| (S14) |
This means that as gets smaller, the transition that halts spontaneously elongation happens at longer and longer , drawing out the particle with continued nested tube formation.
For all results we use , which is about half of the value, , from DFT calculations of nickel-graphene interaction [S4]. One expects that the value would be lower for interaction with nanotubes due to curvature and imperfect contact (i.e., from additional surface roughness, incommensurate length scales, faceting, etc.).
2.2 Retraction from a cylindrical tube
For retraction to occur, the particle tip has to unbind from the tube. Direct detachment entails a penalty of . This barrier is suppressed by restructuring at the particle tip, , and by inward tapering during growth. When the particle tip is not in contact with the nanotube, it is favorable – optimal in this case – for the tip to reduce its curvature to a sphere of radius (the radius of the outside region of the particle). This restructuring reduces the surface energy of the particle. The free energy of retraction is then
| (S15) |
Volume conservation during retraction is given by
| (S16) |
Using Fig. 2a of the main text, the spherical cap (yellow line) is “cut out” and moved to the tip (orange). There is exactly a volume of a sphere of radius plus the volume of the elongated cylinder. This restructuring reduces the energy barrier. Since the before and after restructuring is different, call them and , respectively, the energy barrier is
| (S17) |
2.3 Elongation in an inward tapered tube
The free energy for elongation with tube growth is
| (S18) |
where is the slope of the taper with angle , is the radius at the tube mouth, , and is the radius at the tip. The volume constraint is
| (S19) |
The that satisfies this constraint is given by Eq. (S5), but with .
2.4 Retraction from an inward tapered tube
As with the cylindrical tube, when the tip detaches from the tube, the surface will restructure. For an inward tapered tube, the radius of the tip that minimizes the free energy is (the radius of the outside portion of the particle). The free energy for retraction is
| (S20) |
where (unlike the cylindrical case, the spherical caps do not have the same height and they do not cancel). The volume constraint is
| (S21) |
These equations are used to plot the retraction from the inward tapered tube in Fig. 4a of the main text.
2.5 Elongation in an outward tapered tube
The free energy for elongation with tube growth is
| (S22) |
where is the slope of the taper with angle , is the radius at the tube mouth, , and is the radius at the tip. The volume constraint is
| (S23) |
The that satisfies this constraint is given by Eq. (S5), but with .
2.6 Retraction from an outward tapered tube
As with the cylindrical tube, when the tip detaches from the tube, the surface will restructure. For an outward tapered tube, the radius of the tip that minimizes the free energy is . When , the free energy for retraction is
| (S24) |
where . The volume constraint is
| (S25) |
When , the free energy for retraction is
| (S26) |
The volume constraint is
| (S27) |
These equations are used to plot the retraction from the outward tapered tube in Fig. 4b of the main text.
3 Image Processing
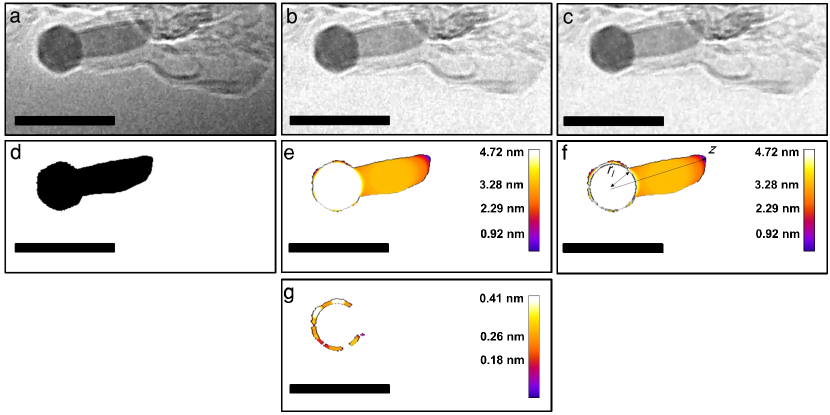
A sum total of 579 frames require analysis for the extraction of morphology descriptors defined in the main text. To address this need, we develop an algorithm that performs accurate, unbiased binarization of the image series. Figure S1 shows the image processing steps applied to a representative image (Fig. S1a) of an elongated particle. A background subtraction removes low frequency non-uniformities in intensity (Fig. S1b). An “anisotropic diffusion” (Perona-Malik diffusion) smoothing then reduces image noise (Fig. S1c). This smoothing technique preserves edges, lines, and finer details important for image interpretation. This image is then thresholded to an appropriate intensity. The method then isolates the remaining noisy objects by size (units of pixels squared) and eliminates them using image subtraction to get the final binarized image.
We compute the local thickness of the particle at each pixel of the binarized image (Fig. S1e), defined as follows [S6,S7]. For the set of all points in the particle and an arbitrary point in the particle, the local thickness, , is the largest circle that contains the point and is completely within the particle’s boundary,
| (S28) |
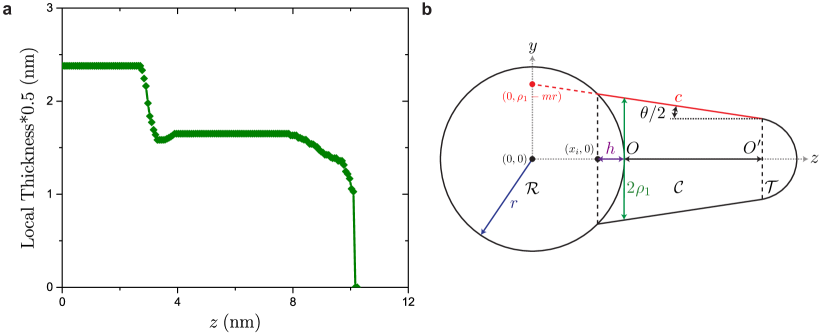
Here, is the set of points inside a circle with center and radius . From the local thickness map, we also find the radius of the largest circle, , in the image (Fig. S1f), subtract this circle from the image, and obtain the average of the local thickness of the remaining fringe region. The radius is of the outer region, , is the sum of and the fringe thickness. The standard deviation in the fringe thickness is taken to be the uncertainty in (Fig. S1g). We then extract the local thickness profile along the loci of the center of these fit circles (-axis in Fig. S1f and Fig. S2a) from each image, as well as the taper angle (from the slope of the thickness profile).
The length l is the sum of and (in Fig. S2b), where is the distance between points and . The point is the center of the circle fit to the tip of the elongated portion and is the point of intersection of line and the circle (in Fig. S2b). The slope of the line is . The intercept is the thickness at point (), the taper , and the radius of the outer circle . For an outer circle centered at the origin, the points of intersection come from the equations
| (S29) |
and
| (S30) |
We subtract the coordinate of the point of intersection () from to obtain . The average radius of the elongated region () is the mean thickness value at each point along the -axis between points (,0) and in the image. The uncertainty in is the standard deviation in the thickness of the fringe elements of the elongated region, i.e., the edge variations outside of the fit circles.
4 Additional Data and Discussion
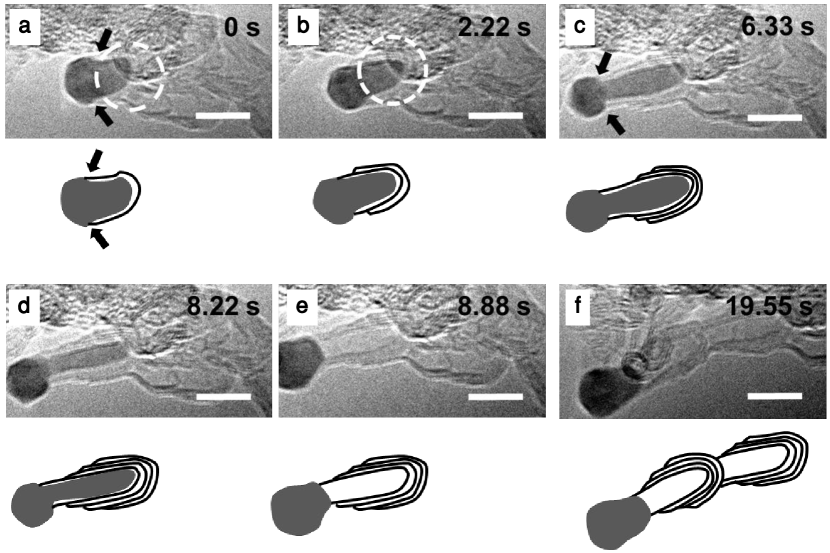
Figure S3 shows a series of snapshots from a real-time video of bamboo carbon nanotube (BCNT) growth recorded after the growth has started from a nm radius Ni catalyst particle. Schematic drawings below each frame illustrate the observed changes in catalyst morphology and the BCNTs formation process. The sequence here starts from when the catalyst nanoparticle has changed to a pear-like shape with the CNTs anchored at well-defined step edges (marked by arrows in Fig. S3a). At this point, the particle is starting its elongation. During this process, new tubes are added into the interior of the carbon structure. At the end of the approximately 6 s of elongation (Fig. S3a-c), the elongated particle has a length that is approximately three times the radius of the original particle. The outer CNT then detaches from the lower half of the particle and the particle roughly recovers its original, spherical form with the innermost tube’s rim still attached to the steps (Fig. S3e). BCNTs form through the cycles of nanoparticle elongation and retraction, which occur with frequencies in the range 0.013 s-1 to 0.086 s-1
Figures S4 and S5 show data extracted from the ETEM videos. Figure S6 shows a schematic of how carbon nanostructure growth proceeds for non-tapered and tapered catalytic nanoparticles. Figure S7 is a series of frames from a real-time video of a carbon nanofiber (CNF) growth from an approximately R = 4.5 nm Ni catalyst nanoparticle at the tip. The video sequence starts when the catalyst particle is partially elongated inside a CNF (Fig. S7a). The degree of the particle elongation is () (the average ratio of elongation to particle diameter), which is much shorter elongation than the smaller particle analyzed in the main text. The higher degree of tapering, possibly due to how the carbon cap forms, results in the shorter elongation and in CNF growth rather than BCNT growth. A more detailed analysis of the binding region and the interplay with surface energies is required to confirm that cap formation is indeed the mechanism that drives the higher degree of tapering. Kinetics also can play a role here, as larger tubes (that form on the larger nanoparticle) have a smaller variation in the rate at which they grow. When a small nested tube forms, its growth rate significantly surpasses the previous tubes growth rate, causing detachment of that larger tube. This is less likely to occur when the tube radius is large. Importantly, the scale invariance of the model in the main text demonstrates that the smaller shape changes are not due to unfavorable energetics (except potentially for the energetics/structure of rim binding).
Figure S8 shows a series of images extracted from the video showing an occurrence of positive tapering during elongation. The free energy landscape for this breakage event is in Fig. 4b of the main text.
References
- (1) R. Sharma and P. A. Crozier, in Handb. Microsc. Nanotechnol., edited by N. Yao and Z. L. Wang (Kluwer Academic Publishers, Boston, 2005), pp. 531–565.
- (2) J. L. Gomez-Ballesteros, J. C. Burgos, P. A. Lin, R. Sharma, and P. B. Balbuena, RSC Adv 5, 106377 (2015).
- (3) P. M. Ajayan, Nature 427, 402 (2004).
- (4) P. A. Khomyakov, G. Giovannetti, P. C. Rusu, G. Brocks, J. van den Brink, and P. J. Kelly, Phys. Rev. B 79, 195425 (2009).
- (5) T. A. Roth, Mater. Sci. Eng. 18, 183 (1975).
- (6) http://imagej.net/Local_Thickness
- (7) T. Hildebrand and P. Ruegsegger, J. Microsc. 185, 67 (1997).