Properties of O dwarf stars in 30 Doradus
Abstract
We perform a quantitative spectroscopic analysis of 105 presumably single O dwarf stars in 30 Doradus, located within the Large Magellanic Cloud. We use mid-to-high resolution multi-epoch optical spectroscopic data obtained within the VLT-FLAMES Tarantula Survey. Stellar and wind parameters are derived by means of the automatic tool iacob-gbat, which is based on a large grid of fastwind models. We also benefit from the Bayesian tool bonnsai to estimate evolutionary masses. We provide a spectral calibration for the effective temperature of O dwarf stars in the LMC, deal with the mass discrepancy problem and investigate the wind properties of the sample.
keywords:
Galaxies: Magellanic Clouds – Stars: atmospheres – Stars: early-type – Stars: fundamental parameters1 Introduction
The VLT-FLAMES Tarantula Survey (VFTS, [Evans et al. (2011), Evans et al. 2011]) is an ESO large programme that has obtained mid-to-high resolution multi-epoch optical spectra of hundreds of O-type stars in 30 Doradus, the largest H ii region in the Local Group, located in the Large Magellanic Cloud. VFTS was developed aiming at the study of rotation, binarity and wind properties of an unprecedented number of massive stars within the same star-forming region. Within this project, a huge effort has been made in the study of O-type stars, including the analysis of multiplicity ([Sana et al. (2013), Sana et al. 2013]), spectral classifications ([Walborn et al. (2014), Walborn et al. 2014]) and the distribution of rotational velocities ([Ramírez-Agudelo et al. (2013), Ramírez-Agudelo et al. (2015), Ramírez-Agudelo et al. 2013, 2015]). These studies are essential for the estimation of stellar parameters and chemical abundances of the complete O-type sample, which will allow to investigate fundamental questions in stellar and cluster evolution. To date, the quantitative study of the O-type sample is about to be complete (see [Sabín-Sanjulián et al. (2014), Sabín-Sanjulián et al. (2017), Sabín-Sanjulián et al. 2014, 2017]; [Ramírez-Agudelo et al. (2017), Ramírez-Agudelo et al. 2017]), as well as the determination of nitrogen abundances ([Grin et al. (2016), Grin et al. 2016], Simón-Díaz et al. in prep.)
In this work, we study the properties of a sample of O stars close to the ZAMS, those with luminosity classes IV and V.
2 Observations and data sample
We have used spectroscopic data obtained by means of the Medusa mode of the FLAMES spectrograph at the VLT (Paranal, Chile). In addition, -band images obtained with the (GO12499, P. I.: D. J. Lennon) were utilized to evaluate possible contamination in the Medusa fibres.
We have selected a sample of 105 likely single and unevolved O stars based on the multiplicity properties derived by [Sana et al. (2013), Sana et al. (2013)] and the spectral classifications by [Walborn et al. (2014), Walborn et al. (2014)]. Our sample includes O stars with luminosity classes V and IV, as well as Vz, V-III (uncertain classification) and III-IV (interpolation between III and IV).
3 Quantitative spectroscopic analysis
The quantitative analysis of the spectroscopic data for our sample of O dwarfs was performed by means of the IACOB Grid-Based Automatic Tool (iacob-gbat, see [Simón-Díaz et al. (2011), Simón-Díaz et al. 2011], [Sabín-Sanjulián et al. (2014), Sabín-Sanjulián et al. 2014]). iacob-gbat is based on a grid of 190 000 precomputed fastwind stellar atmosphere models ([Santolaya-Rey, Puls, & Herrero (1997), Santolaya-Rey et al. 1997], [Puls et al. (2005), Puls et al. 2005]) and a algorithm that compares observed and synthetic H and He line profiles.
Absolute magnitudes in the -band calculated by [Maíz Apellániz et al. (2014), Maíz-Apellániz et al. (2014)] and projected rotational velocities by [Ramírez-Agudelo et al. (2013), Ramírez-Agudelo et al. (2013)] were used.
We estimated mean values and uncertainties for effective temperature Teff, surface gravity , helium abundance , stellar radius , luminosity , spectroscopic mass and wind-strength -parameter (defined as = , where is the mass-loss rate and the wind terminal velocity). Evolutionary masses () were obtained by means of the Bayesian tool bonnsai ([Schneider et al. (2014), Schneider et al. 2014]), which used evolutionary models by [Brott et al. (2011), Brott et al. (2011)] and [Köhler et al. (2015), Köhler et al. (2015)].
Most of the stars in our sample showed strong nebular contamination, but only 11 critical cases had to be analyzed using nitrogen lines (HHeN). This diagnostic was also used for 9 cases with too weak or inexistent He i lines. We could only provide upper limits for log for about 70% of the sample due to thin winds. In addition, possible/confirmed contamination in fibre was present in several stars, which could have altered the determination of physical parameters. A few cases were found with too low helium abundances and too high gravities, a possible indication of undetected binarity.
4 Spectral calibration
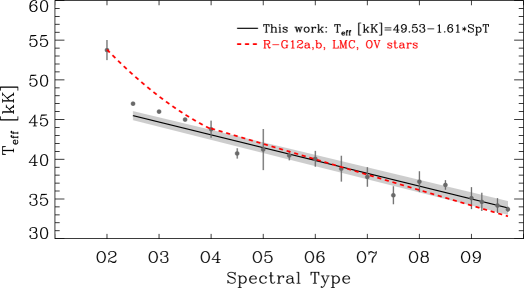
Figure 1 represents our Teff scale as a function of spectral types. We perform a linear fit to the points excluding O2 stars, since they show indications of undetected binarity and/or contamination in fibre. When comparing with the most recent and complete spectral calibration for O dwarfs in the LMC before this work ([Rivero González et al. (2012), Rivero González et al. (2012), Rivero-González et al. 2012a,b], who used HHeN diagnostics to analyse optical spectra of 25 stars, including 16 dwarfs), we found that there is an excellent agreement between both scales for spectral types later than O4. In the earliest regime, Rivero-González et al. utilized a quadratic fit obtaining hotter temperatures than ours, although the estimates for our O2 stars agree with their calibration. However, we cannot reach a firm conclusion about the necessity of changing the slope in the O2-O4 regime due to the small number of observed stars and their very likely binarity/multiplicity. A larger sample of O-type stars earlier than O4, as well as information on their possible composite nature are necessary.
5 Mass discrepancy
The mass discrepancy problem consists on a lack of agreement between spectroscopic and evolutionary masses. Since its identification by [Herrero et al. (1992), Herrero et al. (1992)], several explanations have been proposed but it remains unresolved due to the diversity of results in different environments.
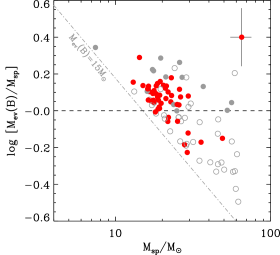
We compare our derived spectroscopic and evolutionary masses in Figure 2. We find a certain trend in the distribution: for masses below 20 M⊙, we can only find stars with , i.e., a positive discrepancy, while for higher masses both positive and negative discrepancies are present. Nevertheless, this trend could be explained by a selection bias in our sample. All the O dwarfs in this work have masses systematically above 15 M⊙ (see indication in Fig. 2). As a consequence, all stars with a negative mass discrepancy and masses below 15 M⊙ are not present. To investigate this effect and reach a clearer conclusion about the mass discrepancy in the VFTS sample, results from the ongoing quantitative analysis of the early B-dwarfs should be included.
6 Wind properties
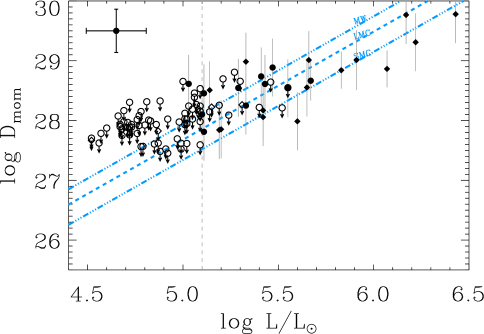
In this study, we estimated the logarithm of the wind-strength -parameter (see Sect. 3) of the sample stars. If terminal velocities were available, log could be used to estimate mass-loss rates. Nevertheless, we lack UV spectroscopic data to derive directly terminal velocities. For this reason, we have followed the approach used by [Mokiem et al. (2007), Mokiem et al. (2007), Mokiem et al. (2007a,b)] to estimate the escape velocity and the terminal velocity , where is the Eddington factor and the metallicity corresponding to the LMC. The wind momentum was calculated via = , and is represented in Figure 3 as a function of stellar luminosity. Two different behaviours are present in the distribution:
-
•
At luminosities higher than log 5.1, winds were constrained for most of the stars. Most of them show consistency with the linear trend predicted by [Vink, de Koter, & Lamers (2001), Vink et al. (2001)] within the error bars. However, a large dispersion is found, showing some stars above the theoretical WLR for Galactic metallicity and some others below the prediction for the SMC. The first case could be explained by unclumped wind models and large uncertainties on the estimated terminal velocities, but no suitable explanation can be found for the second one.
-
•
At luminosities lower than log 5.1, only upper limits could be given for log and therefore . To constrain such thin winds, UV spectroscopy is necessary.
References
- Brott et al. (2011) Brott I., et al., 2011, A&A, 530, A115
- Evans et al. (2011) Evans C. J., et al., 2011, A&A, 530, A108
- Grin et al. (2016) Grin N. J., et al., 2016, arXiv, arXiv:1609.00197
- Herrero et al. (1992) Herrero A., Kudritzki R. P., Vilchez J. M., Kunze D., Butler K., Haser S., 1992, A&A, 261, 209
- Köhler et al. (2015) Köhler K., et al., 2015, A&A, 573, A71
- Maíz Apellániz et al. (2014) Maíz Apellániz J., et al., 2014, A&A, 564, A63
- Mokiem et al. (2007) Mokiem M. R., et al., 2007, A&A, 465, 1003
- Mokiem et al. (2007) Mokiem M. R., et al., 2007, A&A, 473, 603
- Puls et al. (2005) Puls J., Urbaneja M. A., Venero R., Repolust T., Springmann U., Jokuthy A., Mokiem M. R., 2005, A&A, 435, 669
- Ramírez-Agudelo et al. (2013) Ramírez-Agudelo O. H., et al., 2013, A&A, 560, A29
- Ramírez-Agudelo et al. (2015) Ramírez-Agudelo O. H., et al., 2015, A&A, 580, A92
- Ramírez-Agudelo et al. (2017) Ramírez-Agudelo O. H., et al., 2017, arXiv, arXiv:1701.04758
- Rivero González et al. (2012) Rivero González J. G., Puls J., Najarro F., Brott I., 2012, A&A, 537, A79
- Rivero González et al. (2012) Rivero González J. G., Puls J., Massey P., Najarro F., 2012, A&A, 543, A95
- Sabín-Sanjulián et al. (2014) Sabín-Sanjulián C., et al., 2014, A&A, 564, A39
- Sabín-Sanjulián et al. (2017) Sabín-Sanjulián C., et al., 2017, A&A, 601, A79
- Sana et al. (2013) Sana H., et al., 2013, A&A, 550, A107
- Santolaya-Rey, Puls, & Herrero (1997) Santolaya-Rey A. E., Puls J., Herrero A., 1997, A&A, 323, 488
- Schneider et al. (2014) Schneider F. R. N., Langer N., de Koter A., Brott I., Izzard R. G., Lau H. H. B., 2014, A&A, 570, A66
- Simón-Díaz et al. (2011) Simón-Díaz S., Castro N., Herrero A., Puls J., Garcia M., Sabín-Sanjulián C., 2011, JPhCS, 328, 012021
- Vink, de Koter, & Lamers (2001) Vink J. S., de Koter A., Lamers H. J. G. L. M., 2001, A&A, 369, 574
- Walborn et al. (2014) Walborn N. R., et al., 2014, A&A, 564, A40