Finding evolved stars in the inner Galactic disk with Gaia
Abstract
The Bulge Asymmetries and Dynamical Evolution (BAaDE) survey will provide positions and line-of-sight velocities of evolved, maser bearing stars in the Galactic plane. Although this Galactic region is affected by optical extinction, BAaDE targets may have Gaia cross-matches, eventually providing additional stellar information. In an initial attempt to cross-match BAaDE targets with Gaia, we have found more than 5,000 candidates. Of these, we may expect half to show SiO emission, which will allow us to obtain velocity information. The cross-match is being refined to avoid false positives using different criteria based on distance analysis, flux variability, and color assessment in the mid- and near-IR. Once the cross-matches can be confirmed, we will have a unique sample to characterize the stellar population of evolved stars in the Galactic bulge, which can be considered fossils of the Milky Way formation.
keywords:
Galaxy: bulge, stars: AGB and post-AGB, masers, astrometry.1 Motivation
The characterization of the stellar population of the Galactic bulge represents a key piece to understand the morphology and dynamical evolution of the inner Galaxy. This stellar population is dynamically affected by a massive bar (e.g. [Dwek et al. (1995)]) and recent studies have shown an X-shaped structure (e.g. [Wegg & Gerhard (2013)]), similar to what it is seen in extragalactic edge-on boxy bulges. Optical surveys —notably Gaia— are limited due to optical extinction, and are not able to make unhindered stellar astrometric measurements in the Galactic bulge, which complicates the characterization of this stellar population.
Radio campaigns are not affected by extinction and can therefore provide complementary information to optical surveys, especially at low latitudes. The Bulge Asymmetries and Dynamical Evolution (BAaDE) project surveys red giant stars for SiO maser emission at 43 and 86 GHz with the VLA and ALMA, eventually providing positions and radial velocities of approximately 20,000 targets along the Galactic plane ([Sjouwerman et al. (2016)]). The BAaDE survey aims to significantly improve the dynamical models using radio sources in regions not reachable with optical surveys. The BAaDE survey is expanding the currently known stellar tracers in the inner Galaxy by a large number.
Tests for dynamical models of the Galaxy require large samples of stars with accurate positions and velocities. More details can be derived if distances are tied to stellar velocities. Therefore, we present an initial attempt to cross-match BAaDE targets with Gaia DR1, resulting in more than 5,000 matches. However, since BAaDE targets were selected based on mid-IR colors measured with the MSX mission ([Sjouwerman et al. (2009)], (2016)) —where the positional uncertainty is up to 2 arcsec— the cross-matched sample could be contaminated by false positives. After confirming the matches, we will have a sample with optical, IR and radio information that can be used to characterize the stellar populations in the inner Galaxy, as well as to test dynamical models. In particular, we can obtain the positions, proper motions, parallaxes, colors and periods from Gaia DR2 (April 2018). Until then, we can use the Gaia DR1 positions for cross-matching.
2 Cross-matching description
The BAaDE target selection was based on MSX colors, which in turn were based on IRAS color-color diagrams (see [Sjouwerman et al. (2009)]). [Van der Veen & Habing (1988)] developed an IRAS color-color diagram to study dust/gas envelopes (DGE) of Asymptotic Giant Branch (AGB) stars. They found that DGE stars appear in a sequence in the IRAS color-color diagram, perhaps associated with an evolutionary track with an increasing mass-loss rate. In this color-color diagram, SiO maser stars are found within a specific color regime, allowing a stellar selection based on the IRAS colors. Later on, [Sjouwerman et al. (2009)] were able to transform parts of this IRAS color-color diagram onto colors in the mid-IR, using MSX data. With the improved angular resolution provided by MSX, red giant stars (with envelopes likely to harbor SiO maser emission) can be efficiently selected in the Galactic plane.
To positionally match the BAaDE targets with other surveys, we consider a circular area with 5 arcsec radius around the BAaDE targets, based on the MSX positional accuracy (2 arcsec). Although the cross-match can be done directly with Gaia, we initially cross-match BAaDE targets and 2MASS, because of three different reasons. Firstly, we do not expect that a target displaying both mid-IR emission (MSX) and optical emission (Gaia) would not have emission in the near-IR (2MASS). Hence, by initially cross-matching with 2MASS, we are already avoiding some false positives. Secondly, the cross-match between 2MASS and Gaia was already made by Marrese et al. (in preparation) using the best neighbor algorithm, finding more than 90 coincidences. Finally, 2MASS contributes with useful near-IR information to characterize the stellar population.
The cross-match between BAaDE targets and 2MASS produced more than 90 coincidences within 5 arcsec. However, looking at these sources in the Gaia catalog, out of 5,674 coincidences seem to have a counter part at optical wavelengths. From those, 4,814 sources have only one Gaia match and 860 sources have 2 or more Gaia matches within the search radius. We will focus on the 4,814 sources that have a unique Gaia match.
3 False positive filters
To refine the cross-matching by avoid false positives, several filtering methods have been considered. Below, we outline the most successful methods that we have applied.
3.1 Distance analysis
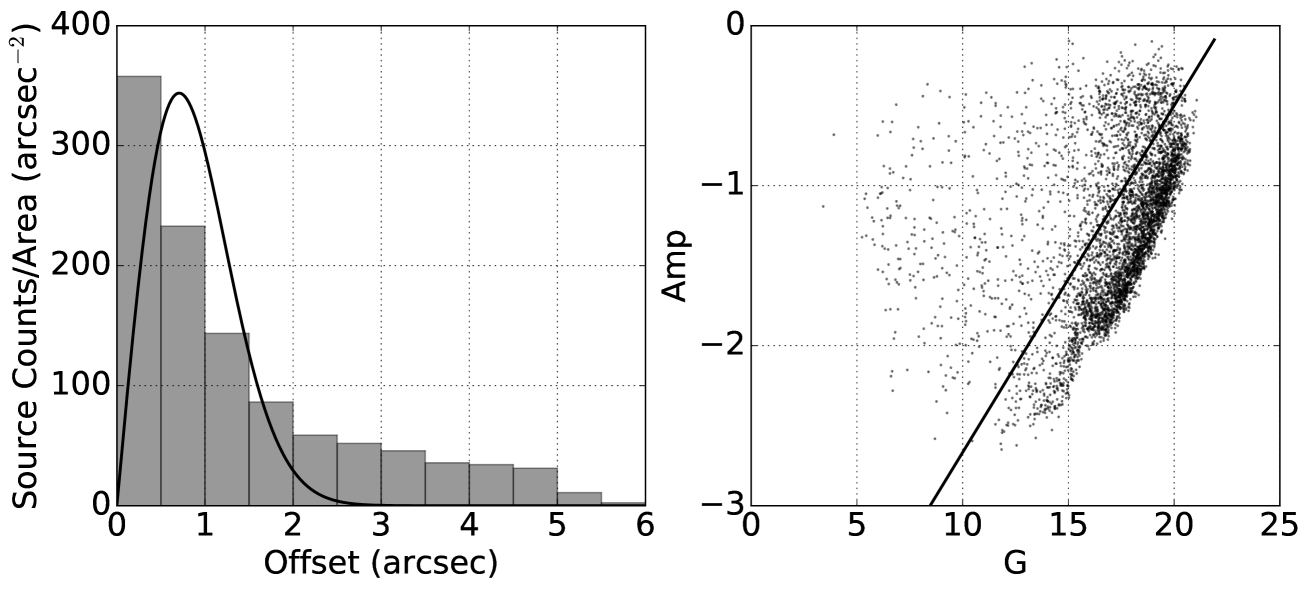
The distribution of matches between the BAaDE targets and Gaia shows Gaussian distributions for both components with absolute mean values arcsec. This is 2D Gaussian distribution can be converted to a function of the distance offset, which is a first-order Bessel function assuming the same standard deviations in both components. The left panel of Fig. 1 shows the expected distribution for a radius of 2 arcsec (representative as the typical MSX positional uncertainty) as a solid line. Excess sources at offsets above arcsec may be considered false positives.
3.2 Color filters in the mid- and near-IR
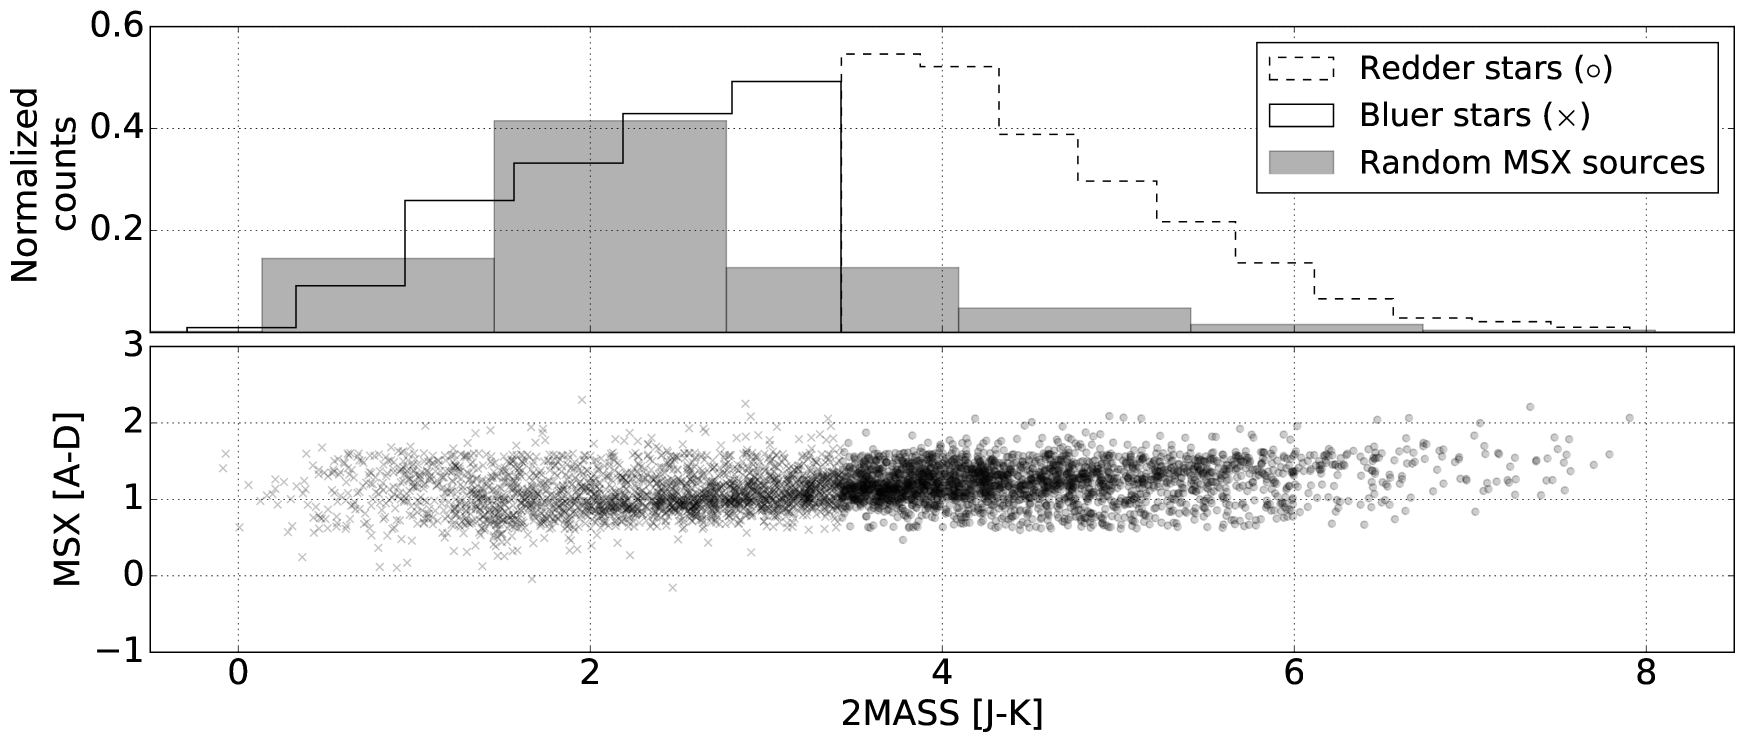
Since the cross-match was made through 2MASS, the near-IR filters () and the mid-IR (MSX bands) can be used for color-color diagrams. The lower panel of Fig. 2 shows the color-color diagram between [A-D] MSX bands and [J-K] 2MASS filters for the matches between BAaDE targets and Gaia. We calculated the mean value for the 2MASS colors and we split the sample in two different subsamples, i.e., (bluer stars) and (redder stars). AGB stars are expected to have redder colors (represented by a steeper slope in their SED), and therefore we expect that the redder stars are more likely to be correct cross-matches.
Moreover, the upper panel of Fig. 2 shows the histograms for the bluer and redder stars respectively, plotted on top of the distribution for random subset of MSX sources. The plot shows that most of the MSX sources are indeed bluer stars, in agreement with that redder stars (representing half of our sample) are more rare and could more easily be associated with pulsating AGB stars.
3.3 Variability of evolved stars
The observed variability of the optical g-band can be quantified with an amplitude measure, defined as , where is the number of observations. [Belokurov et al. (2017)] calculated the amplitude for different stellar populations in the LMC and SMC, and localized Mira variables in the upper region of the amplitude-magnitude plot. This implies for a given range in these variable stars have a higher value of Amp than non-variable source of the same brightness. The right panel of Fig. 1 shows an amplitude-magnitude plot for the matches between BAaDE targets and Gaia. The solid line represent the typical behavior for most of the Gaia sources. Stars with amplitudes higher than -1 are highly related with pulsating stars and hence could be confirmed as properly matched. In contrast, Stars with amplitudes lower than -1 must be carefully reviewed by an alternative criterion for false positives.
3.4 Statistical arguments
Assuming an uniform distribution of sources in the bulge for the Gaia detections and for the BAaDE targets, one could calculate the number of sources that randomly will match given the resolution of each survey. We estimate that the number of random matches should be less 1,200, which is low compared with our finding of 5,674 matches. Moreover, in the statistical calculation we have assumed that there is no optical extinction that could limit the number of Gaia sources. Therefore, the actual number of random matches should be much lower than 1,200, confirming that our cross-match is not a consequence of random matches of unrelated sources.
Acknowledgements.
This work has made use of data from the European Space Agency mission Gaia, processed by the Gaia Data Processing and Analysis Consortium (DPAC). Funding for the DPAC has been provided by national institutions, in particular the institutions participating in the Gaia Multilateral Agreement. This material is based upon work supported by the National Science Foundation under Grant Number 1517970.References
- [Belokurov et al. (2017)] Belokurov, V., Erkal, D., Deason, A. J., Koposov, S. E. et al. 2017, MNRAS, 466, 4711
- [Dwek et al. (1995)] Dwek, E., Arendt, R. G., Hauser, M. G., Kelsall, T., Lisse, C. M. et al. 1995, ApJ, 445, 716
- [Sjouwerman et al. (2009)] Sjouwerman, L. O.; Capen, S. M.; Claussen, M. J. 2009, ApJ, 705, 1554
- [Sjouwerman et al. (2016)] Sjouwerman, L. O., Pihlström, Y. M., Rich, R. M., Morris, M. R. et al. 2016, in: R.M. Crocker, S.N. Longmore & G.V. Bicknell (eds.), The Multi-Messenger Astrophysics of the Galactic Centre, Proc. IAU Symposium No. 332, p. 103
- [Van der Veen & Habing (1988)] van der Veen, W. E. C. J. & Habing, H. J. 1988, A&A, 194, 125
- [Wegg & Gerhard (2013)] Wegg, C. & Gerhard, O. 2013, MNRAS, 435, 1874