Life in the coffee-ring: how evaporation-driven density gradients dictate the outcome of inter-bacterial competition
Abstract
When a drop dries, it often leaves a ring-shaped stain through a ubiquitous phenomenon known as the coffee-ring effect. This also occurs when the liquid contains suspended microbes; evaporation leaves cells at higher concentrations in the ring than the drop interior. Using biofilm experiments and cellular automata simulations, we show that the physical structure created by the coffee-ring effect can dramatically alter the outcome of inter-bacterial competition. We experimentally study this effect using two strains of Vibrio cholerae that compete using a contact-dependent killing mechanism termed the type 6 secretion system. By creating a heterogeneous density profile, the coffee-ring effect changes the outcome of competition: the bacterial strain that wins in the low-density interior loses in the far denser ring. Through simulations parameterized with experimentally-determined density profiles, we recapitulate our experimental findings. We examine the role of a V. cholerae strain’s frequency, its relative efficacy at killing competitors, and the initial concentration of cells in the droplet in determining the outcome of competition. By scaling from individual cellular interactions to overall changes in strain frequency, our work demonstrates how the coffee-ring effect plays a powerful role in structuring microbial communities, indirectly driving ecological changes in community composition.
1 Introduction
Bacteria often form dense, surface-attached colonies known as biofilms [1]. Understanding how these complex microbial communities are structured is of fundamental and practical interest, as they dramatically change evolutionary outcomes [2][3][4][5] and underlie recalcitrant medical [6][7] and industrial [8][9] problems. Biofilms are highly plastic and can be formed from a few founder cells and remain relatively clonal, or they can arise from whole populations comprising diverse microbial taxa[10]. While a great deal of effort has gone into understanding how biofilms develop, far less attention has been paid to understanding how common physical forces structure their early assembly [11].
When a drop dries, it almost always leaves behind a ring-shaped stain. A gradient in evaporation rate - lowest at the drop center, highest at the drop edge - drives a fluid flow from the center to the edge, carrying anything in the drop to the periphery [12][13][14]. When evaporation finishes, it leaves behind a deposit that is denser at the edge than in the interior. This phenomenon, known as the coffee-ring effect[12][13][14][15], creates ring-shaped deposits of anything dissolved or suspended in a drop, from the oils in a cup of coffee [12], to colloidal particles [12][13][14][15], to cells[16] [17][18]. Indeed, a drop of rain, fresh water, or a sneeze aerosol can contain millions of microbial cells[19]. When these drops dry on a surface, the coffee ring effect will play a central role in spatially-structuring the population. Along with these natural occurrences, this effect is likely present in most laboratory experiments wherein agar slabs are inoculated with small drops of liquid culture (Figure 1). Cells deposited in the densely packed ring immediately interact with each other, while cells in the dilute interior initially undergo clonal outgrowth. Thus, the coffee-ring-determined spatial variance of initial cell concentration may play a large role in mediating the local interactions between deposited cells, directly impacting fitness and biofilm structure.
In this paper, we use a model system of interbacterial competition to examine consequences of spatial structuring via the the coffee-ring effect. Using simulations and experiments, we compete two strains of Vibrio cholerae that can each kill the other (but not siblings) on contact via the type VI secretion system (T6SS). The T6SS is an apparatus 25% of all sequenced gram negative bacteria use to translocate toxic effector proteins into the cytoplasm of a target cell on contact [20], which can lead to clonal phase separation in biofilms[21]. Interestingly, the strain that is superior in the low-density interior of the biofilm appears inferior in the coffee ring. We show that this context dependence is due to the coffee-ring effect, which generates a density heterogeneity between the coffee-ring and its interior. Further, we show that when competing two strains, three parameters must all be considered: the ratio of T6SS-mediated killing effectivenesses, the initial number ratio, and the initial concentration. Due to its ubiquity in both natural and laboratory settings, understanding the role of the coffee-ring effect in structuring microbial biofilms is of central biological importance.
2 Methods
2.1 Experiments
The V. cholerae strains used were derivatives of isolates C6706 and 692-79 [22], and were constructed as described in McNally, et al. [21]. The C6706 strain was tagged with an mKO fluorescent protein and is shown here in red. The 692-79 strain was labeled with mTFP1 and is shown here in blue. Cells were grown at C in Lysogeny Broth (LB) liquid medium to an optical density (OD) and subsequently inoculated as drops onto LB agar (1.5%) pads on glass slides. Imaging was performed using laser fluorescence confocal microscopy with a Nikon A1R, as described in [21]. Agar pads were inoculated with a mixture of the two strains at a number ratio of 1:4 (C6706:692-79); this number ratio was chosen as it produces, after 24 hours of incubation, a nearly 50:50 final mixture of the two strains in the center of the biofilm. Suspensions of the two strains with the chosen number ratio were prepared immediately prior to inoculation by mixing different volumes of single-strain cultures grown to identical optical density. For a number ratio of 1:4, this meant mixing of liquid culture C6706 () into of liquid culture 692-79 () just before inoculation.
2.2 Simulations
Our simulation is a 2D stochastic cellular automata model of biofilm member cells. Sites are arranged on a square lattice of varying length, from 400 (to generate the data in figure 2) to 2500 (to generate figure 1 C). Each site is occupied by a red cell, a blue cell, or an empty space (black). A cell can interact with any of its eight neighbors. A red (blue) cell may kill a neighboring blue (red) cell with probability (), leaving an empty site; a red (blue) cell may double-into a neighboring empty site with probability (). A simulated timestep is defined as choosing a site at random from the lattice, subjecting it to the transition rules, and repeating for either and iterations (depending on the lattice size), so that each automaton is expected to have had the chance to reproduce (space permitting) once per timestep.
3 Results and Discussion
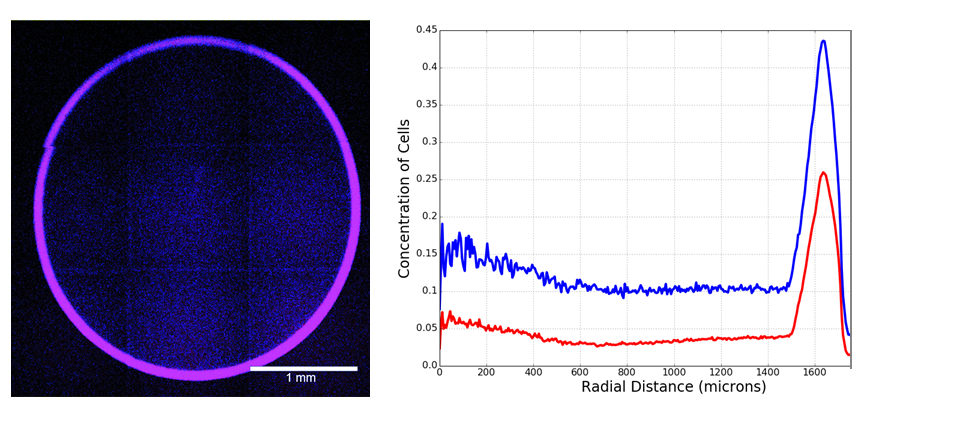
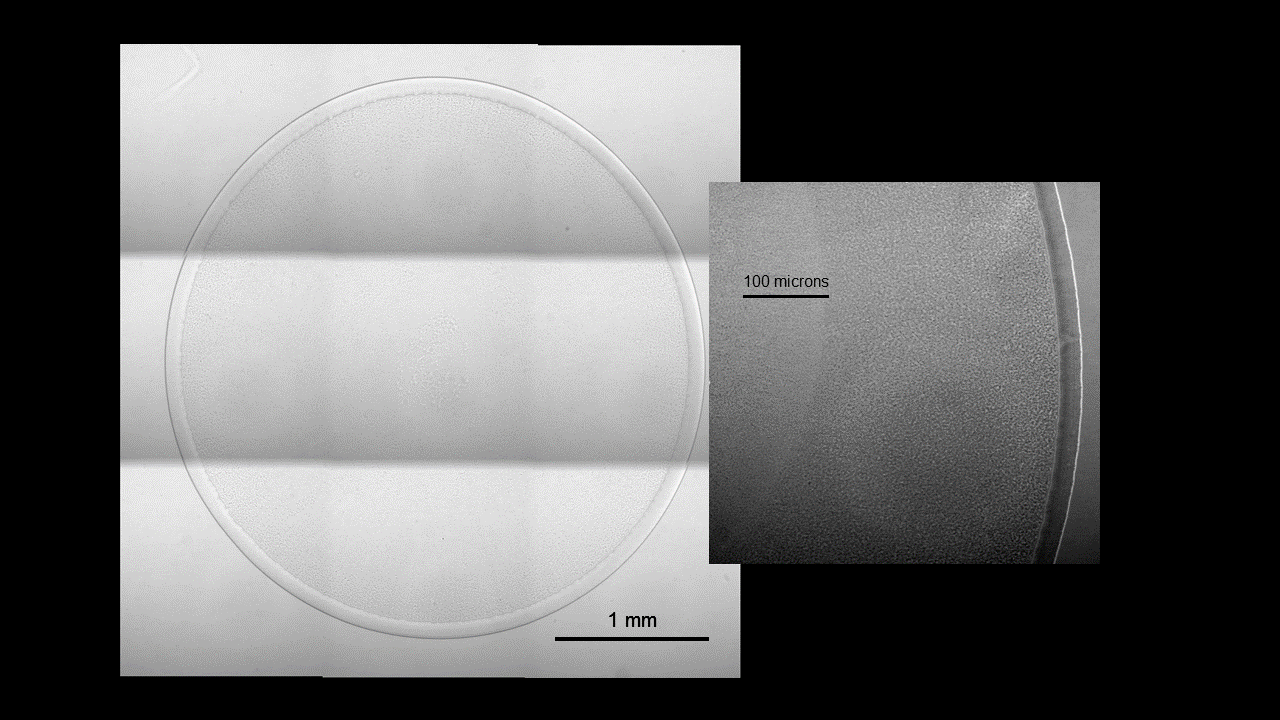
Immediately after inoculation, we imaged biofilms using brightfield and fluorescence microscopy (Figure 1A and 1B). Indeed, cells deposit more densely in the coffee ring (Figure 1A, and 1B, left). After 24 hours of growth, biofilms composed of two mutually killing strains reproducibly exhibit three regimes of cellular arrangement (Figure 1 B, right. See SI Figure 1 for replicates). In the interior of the biofilm, T6SS mediated warfare causes clonal phase separation, as described in [21]. On the biofilm periphery, outside of the blue annulus, cells undergo range expansion into uncolonized territory[23] [24]. Surprisingly, while the frequency of the red strain with superior T6SS weaponry (-fold better killing as measured by the number of surviving E. coli cells in a killing assay [22]) increases throughout the competition in the center, it actually decreases in the coffee-ring, leaving a blue ring.
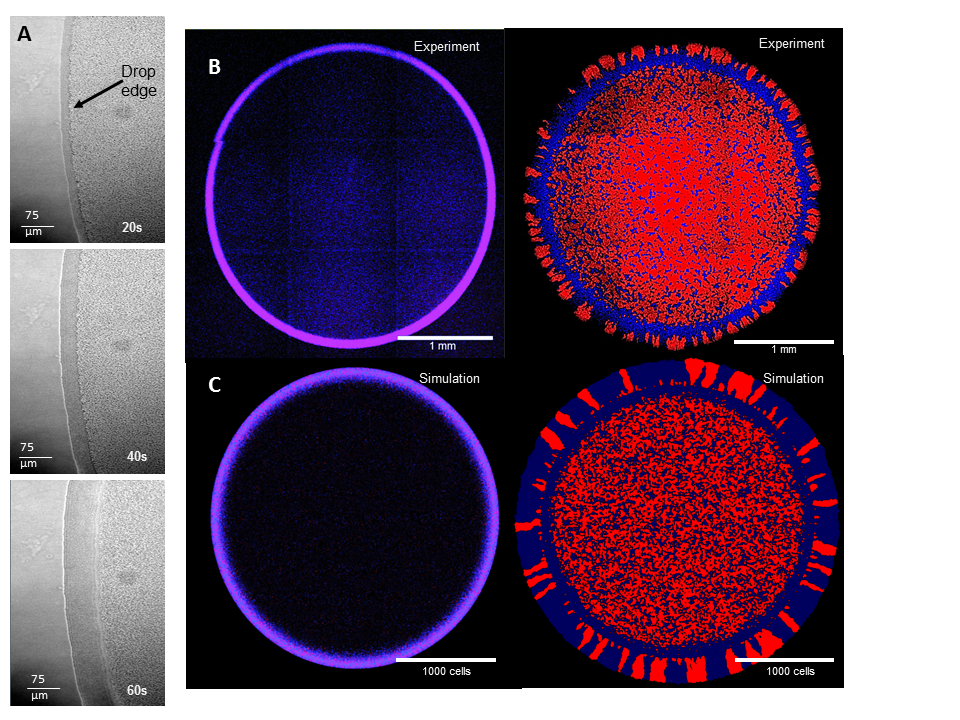
Simulations seeded with spatially uniform concentrations do not replicate the three observed regimes [21] (SI Figure 2). However, a simulated biofilm seeded with the experimentally observed cellular concentration profile (Figure 1 B, SI Figure 3) had both the appearance and distinct morphological features of the experimental biofilm that had been incubated at C for 24 hours (Figure 1 C).
Interestingly, simulations replicate these three regimes with biologically reasonable parameters. They "grow" for 75 time steps, allowing 75 opportunities to double; V. cholerae cells divide every minutes in liquid media, so in a biofilm grown for 24 hours the maximum number of possible reproduction events per cell is consistent with our simulation value of 75. The number of automata we simulate is commensurate with the number of cells in a monolayer of biofilm (). With nearly matched growth rates between the two simulated strains (), and killing rates on the same order of magnitude (), we capture key cellular behaviors with sensible parameters (see ref [22]).
To investigate how a strain with a lower growth rate, lower killing rate, or both, can drive its competitor to (or near) extinction in the coffee ring, we performed further simulations to probe how the following parameters impact competition:
| initial proportion of red cells: |
| killing rate ratio: |
| initial concentration: |
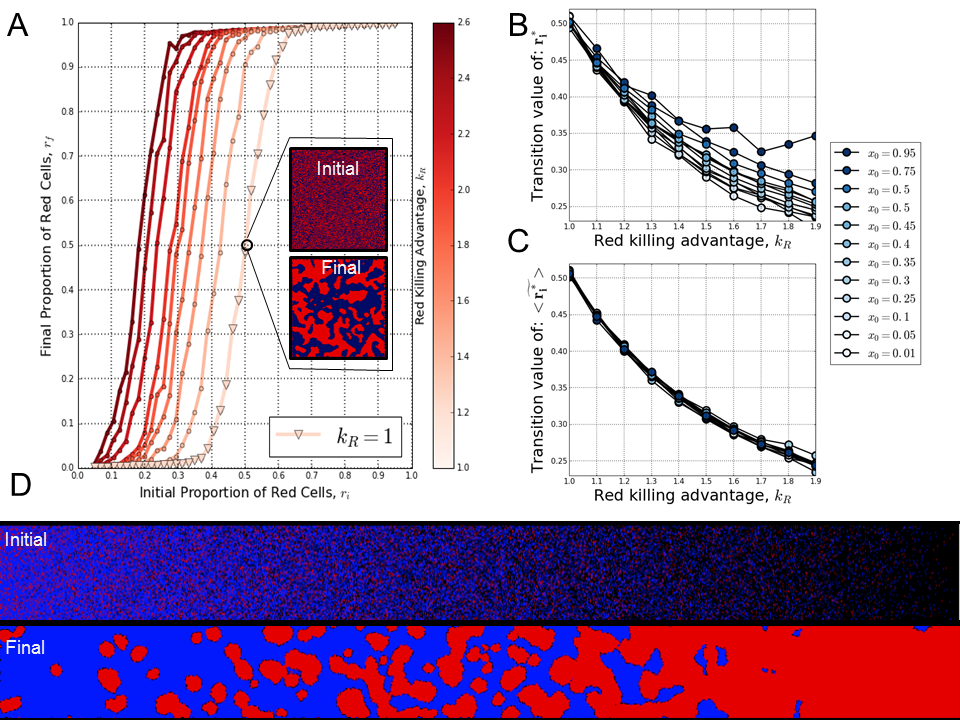
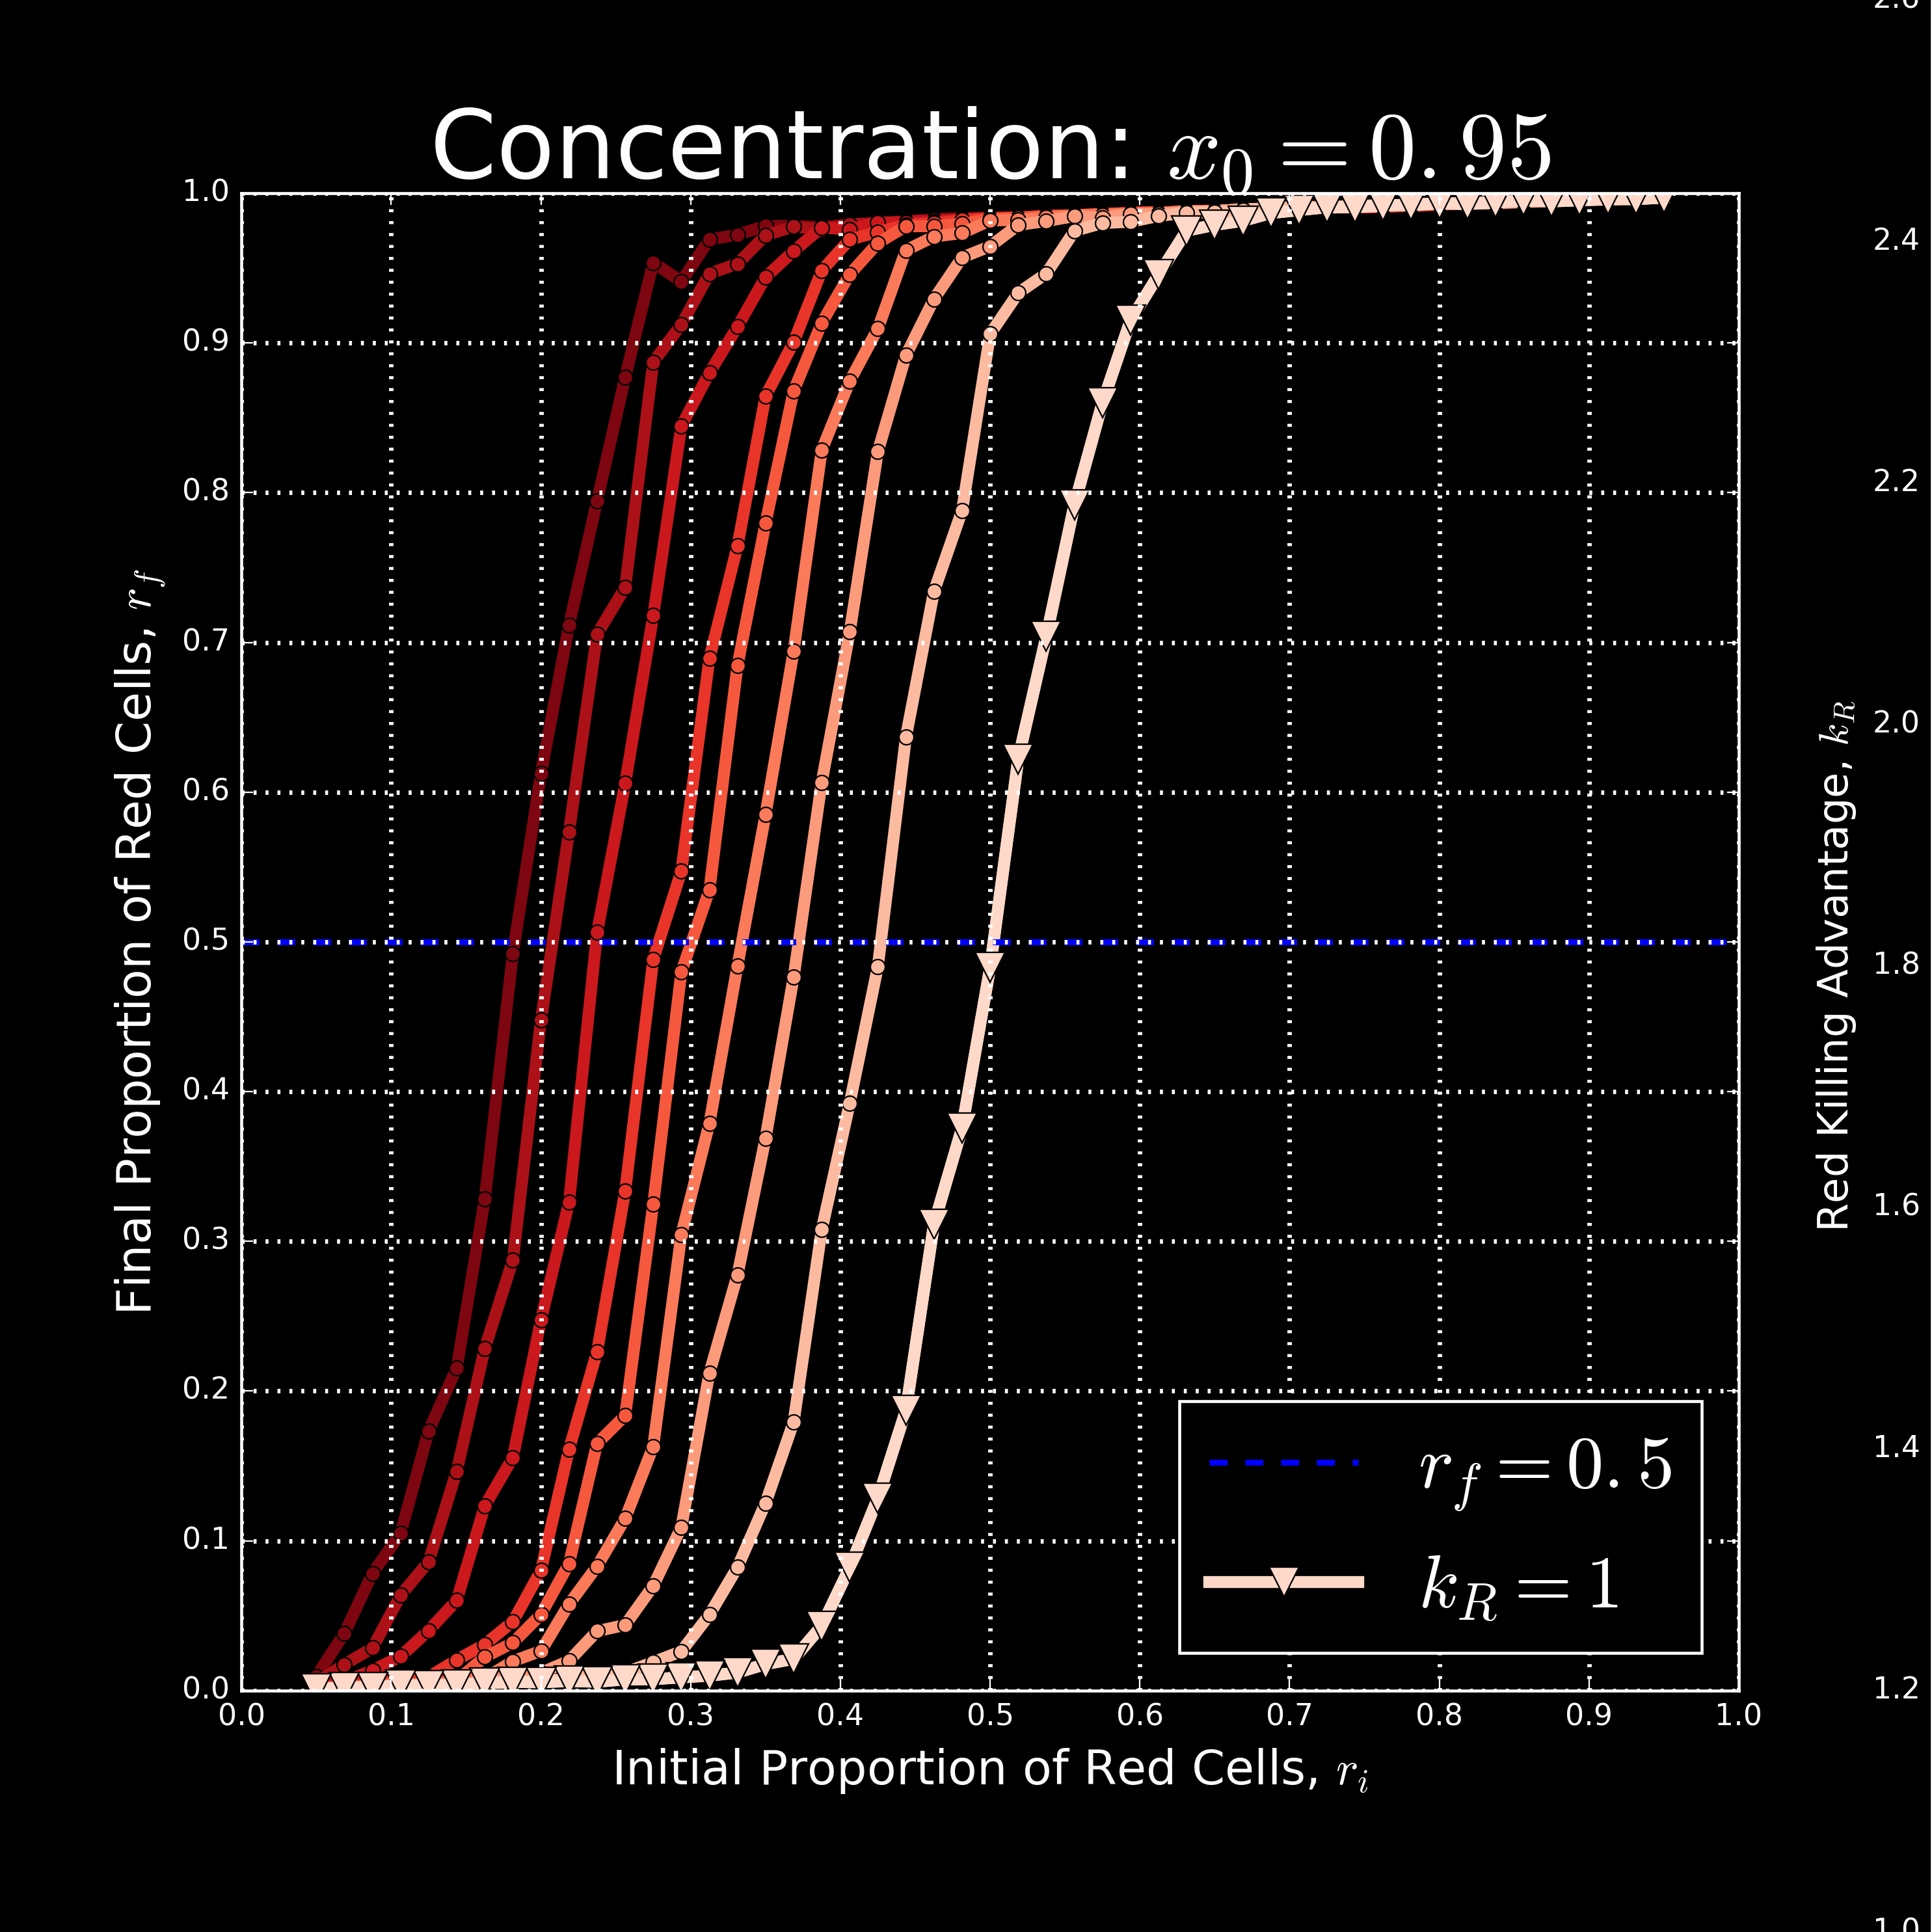
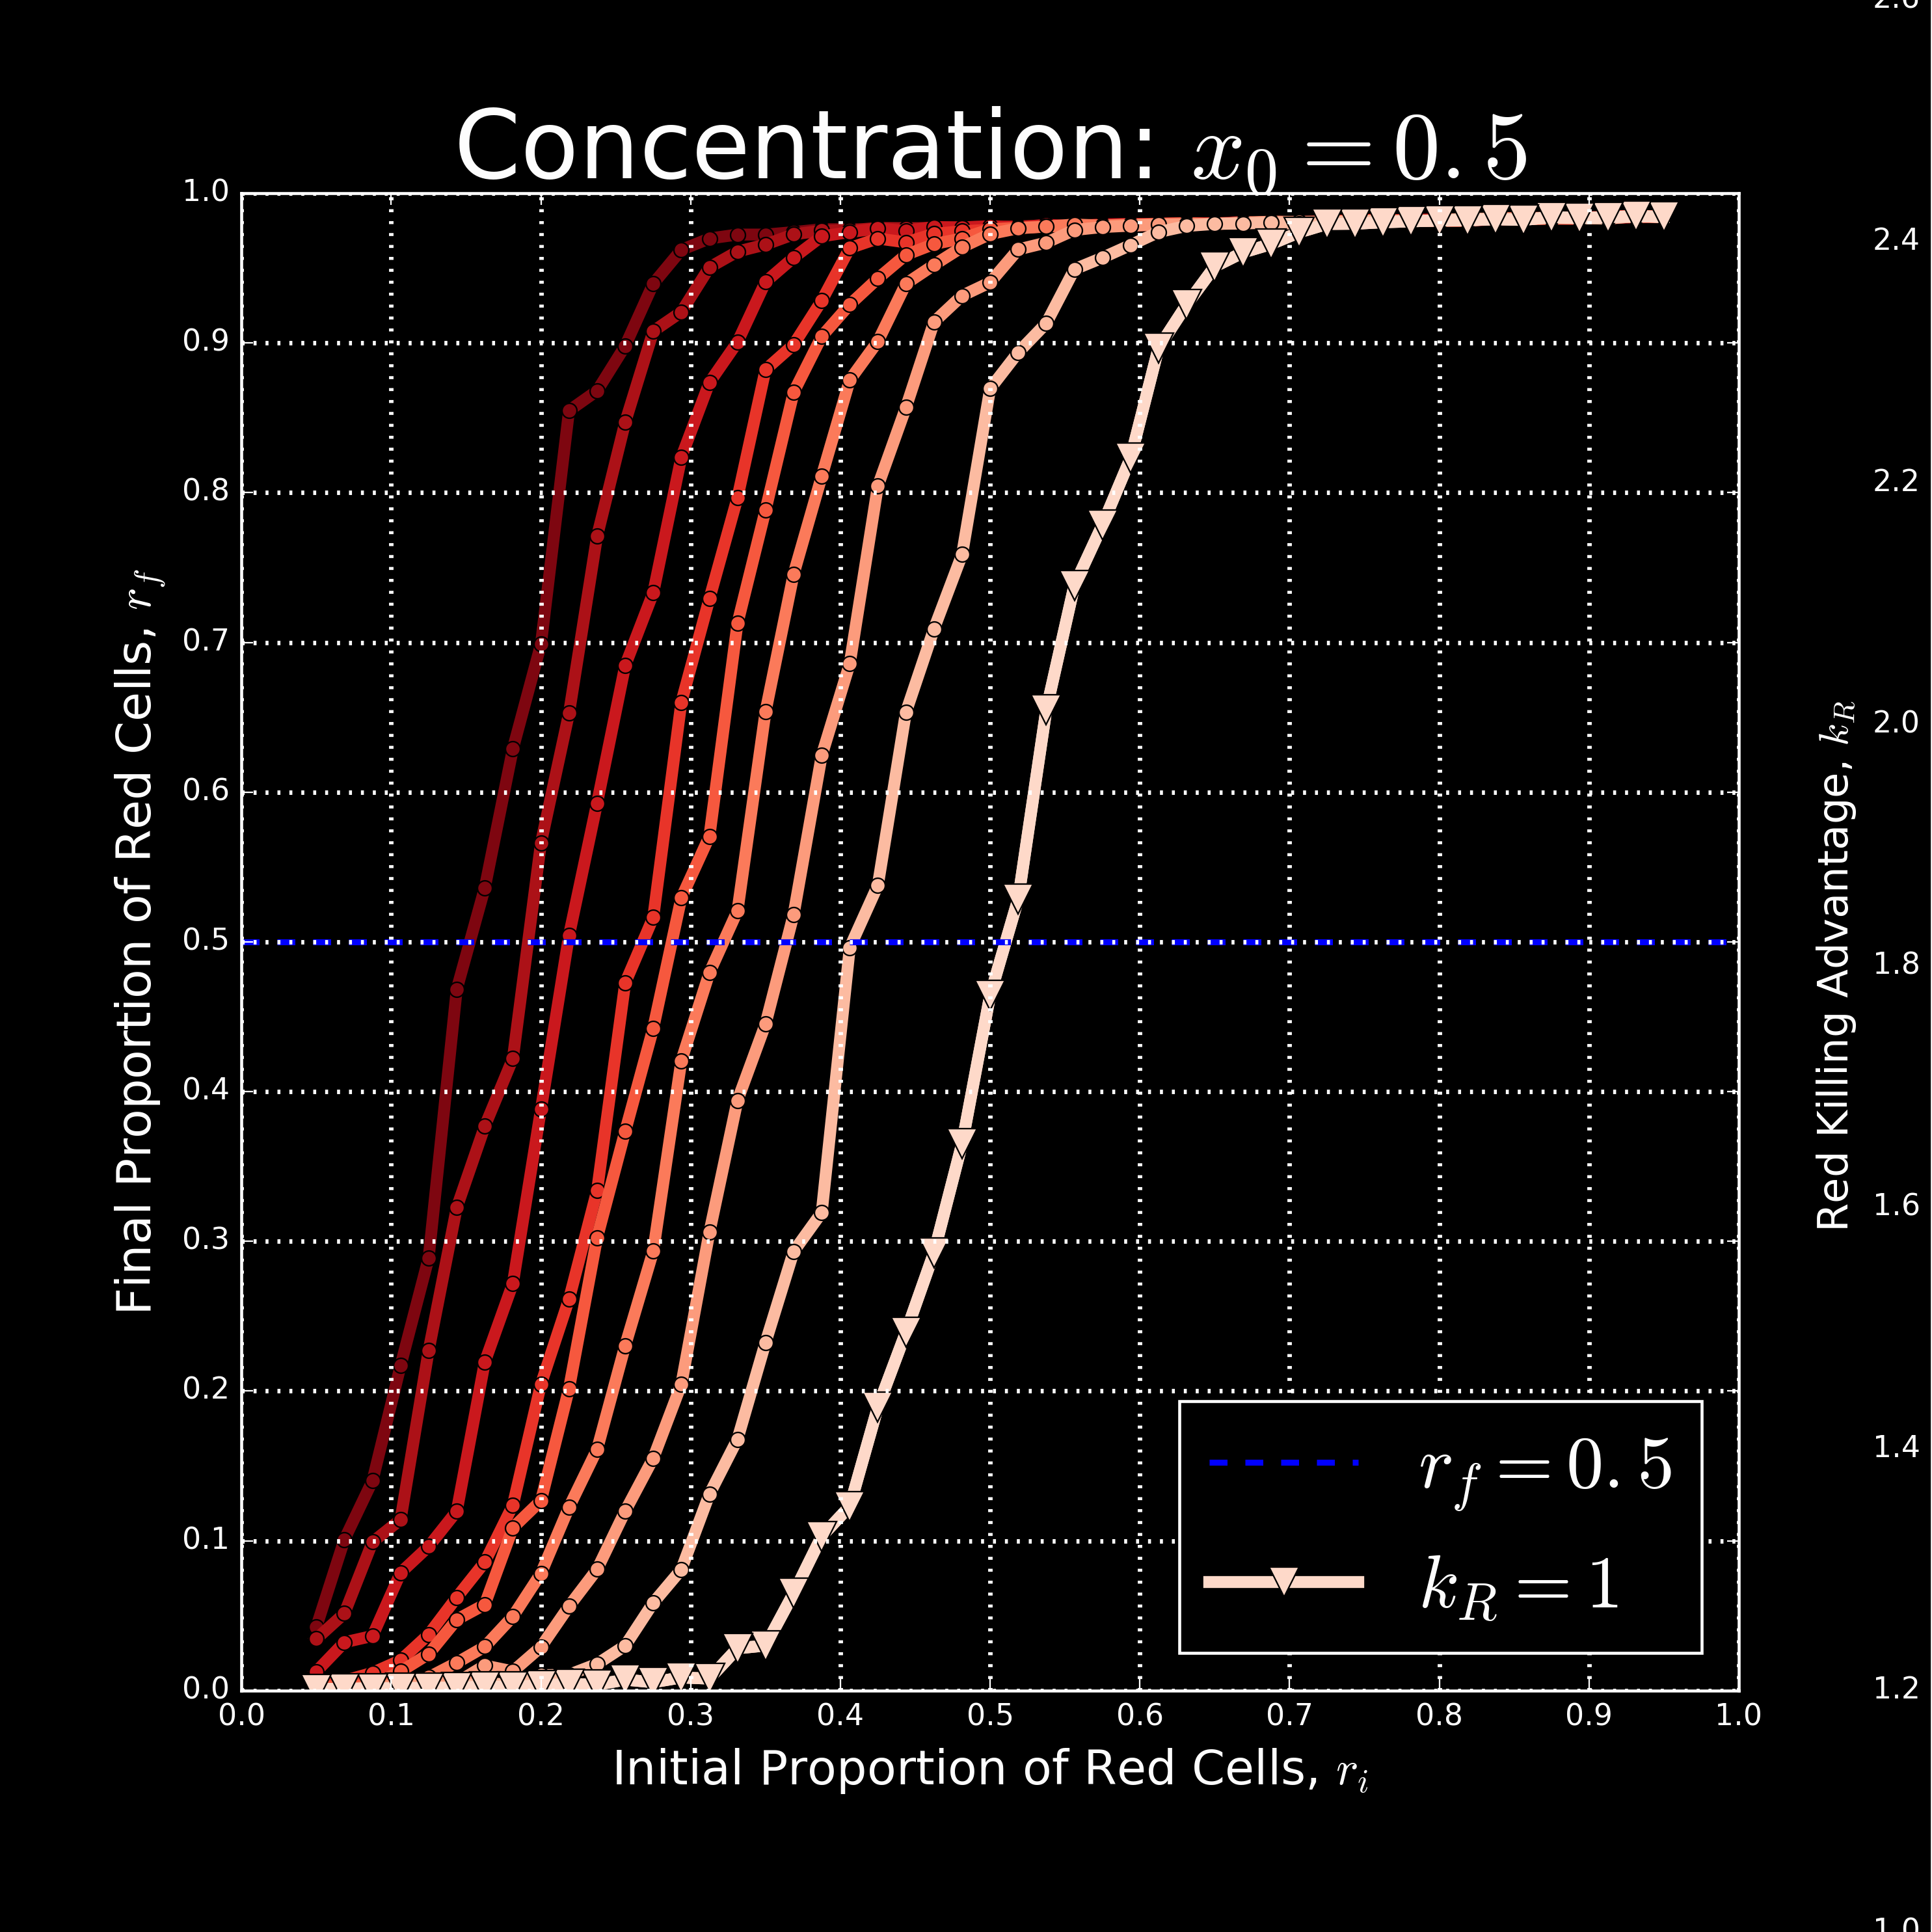
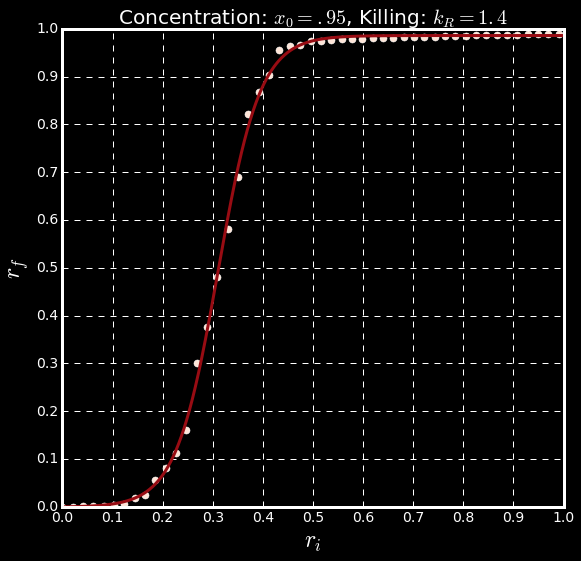
We first investigated the effect of on competition outcomes. Simulations began with completely full square lattices randomly seeded with red and blue cells corresponding to different (see e.g. the blowup in Figure 2 A); after , the final proportion of red cells depends logistically on the initial proportion (Figure 2 A). We tracked the proportion of red cells over time and declared the "winner" of the competition to be the strain which occupies more territory (which corresponds to cell number in a 2D lattice) at the end of the simulation. For example, for strains with equal killing and growth rates, the transition from one winner to the other occurs at a proportion of (Figure 2 A, rightmost curve with triangles). This is unsurprising, as whichever strain has even a slight initial numeric advantage is expected to win this competition.
Next, we investigated the role of the red strain’s relative kill rate, , on competition outcomes. We again started with completely full lattices, but this time varied , along with . Varying affects the transition proportion, ; increasing shifts the entire trend to the left without otherwise effecting qualitative changes (Figure 2 A).
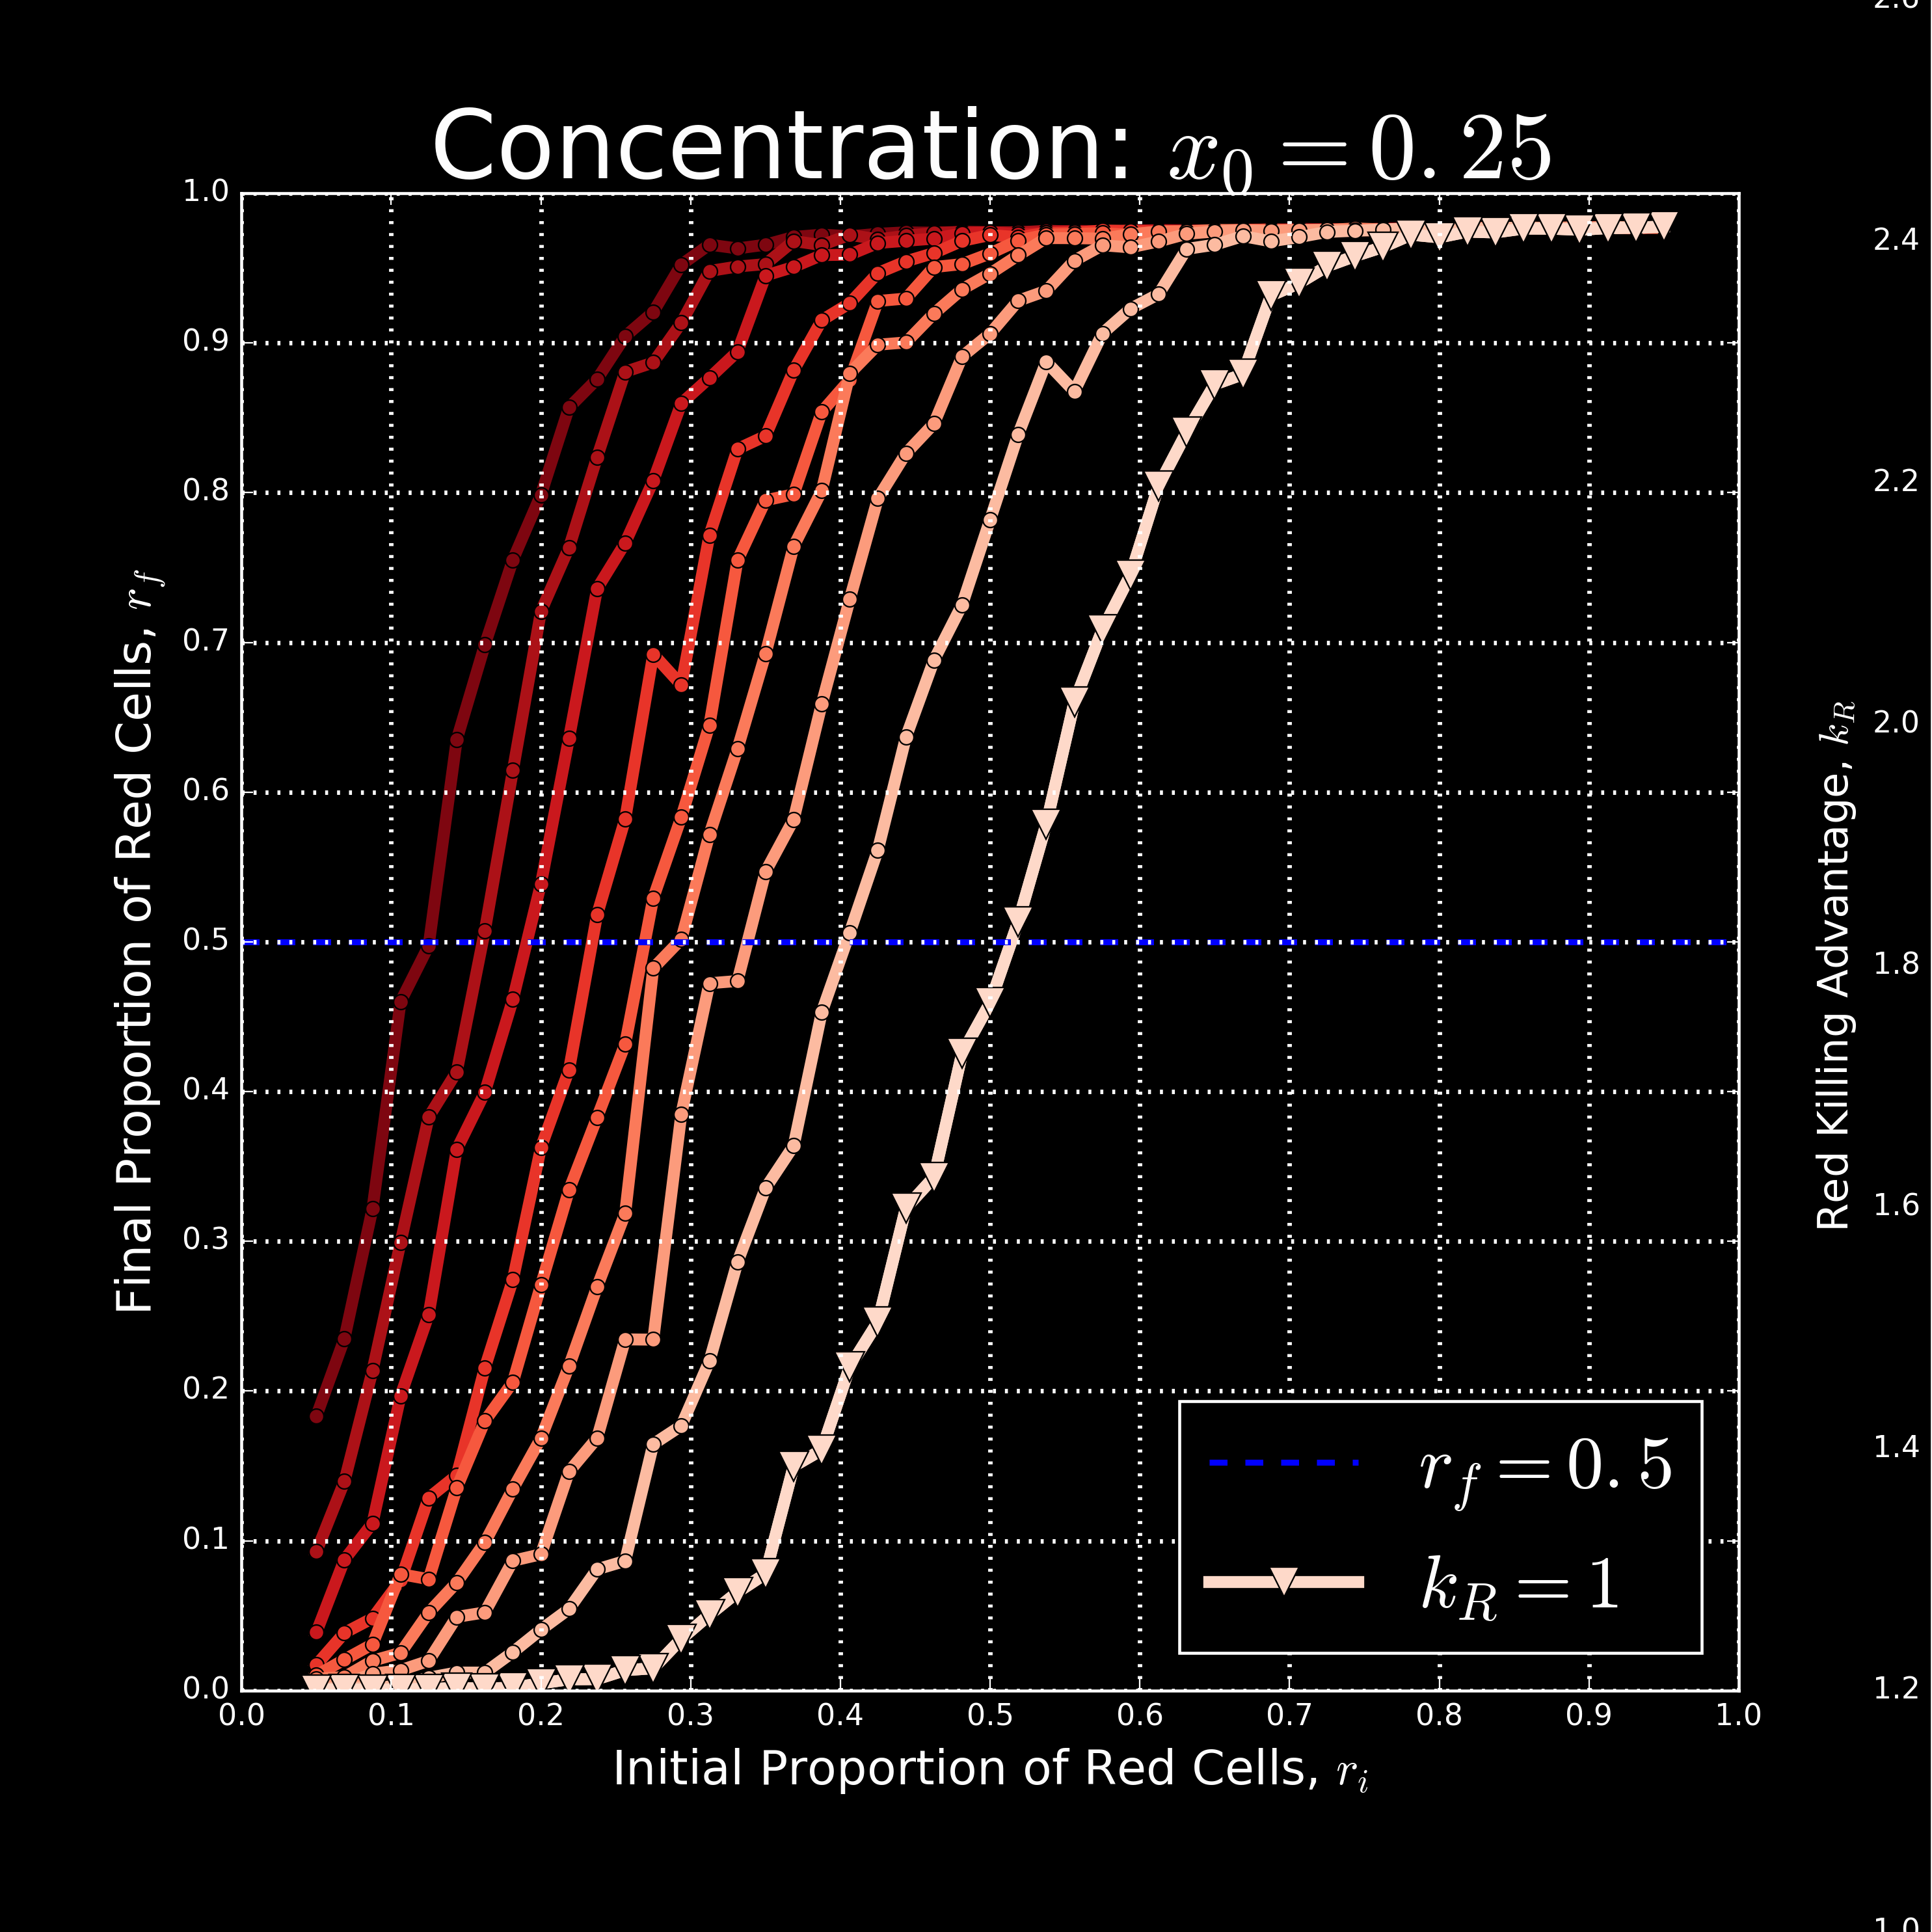
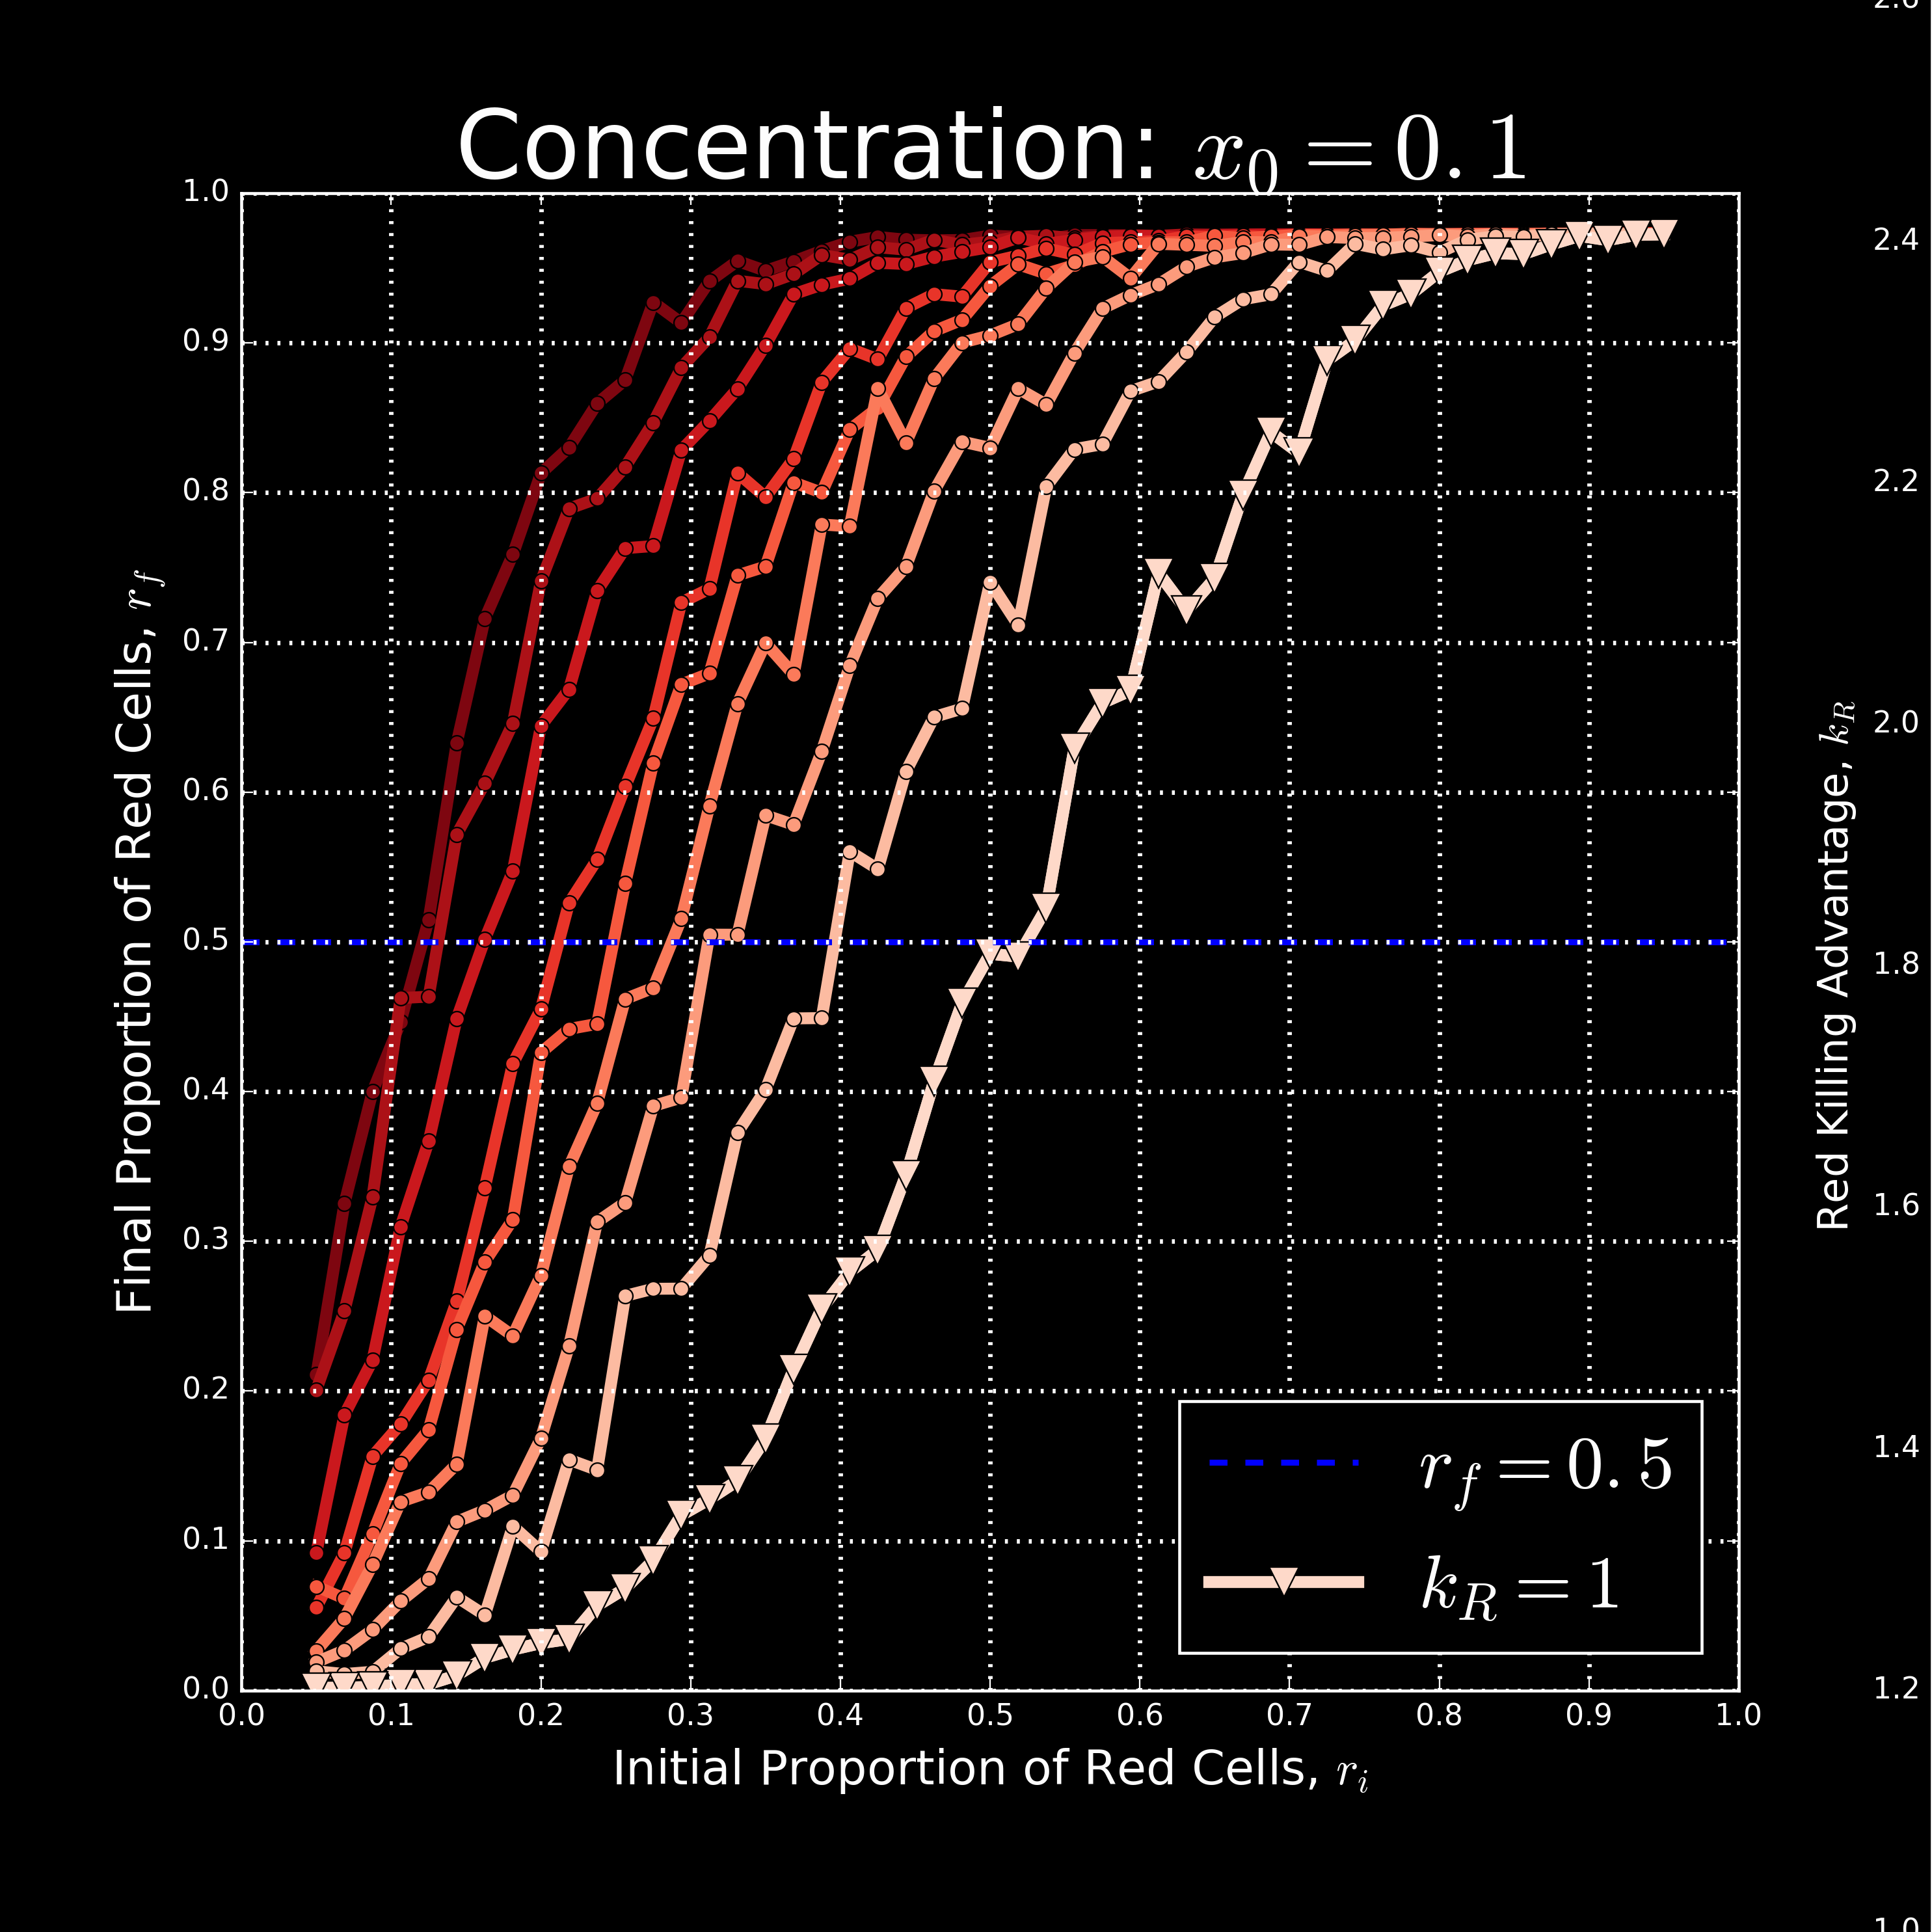
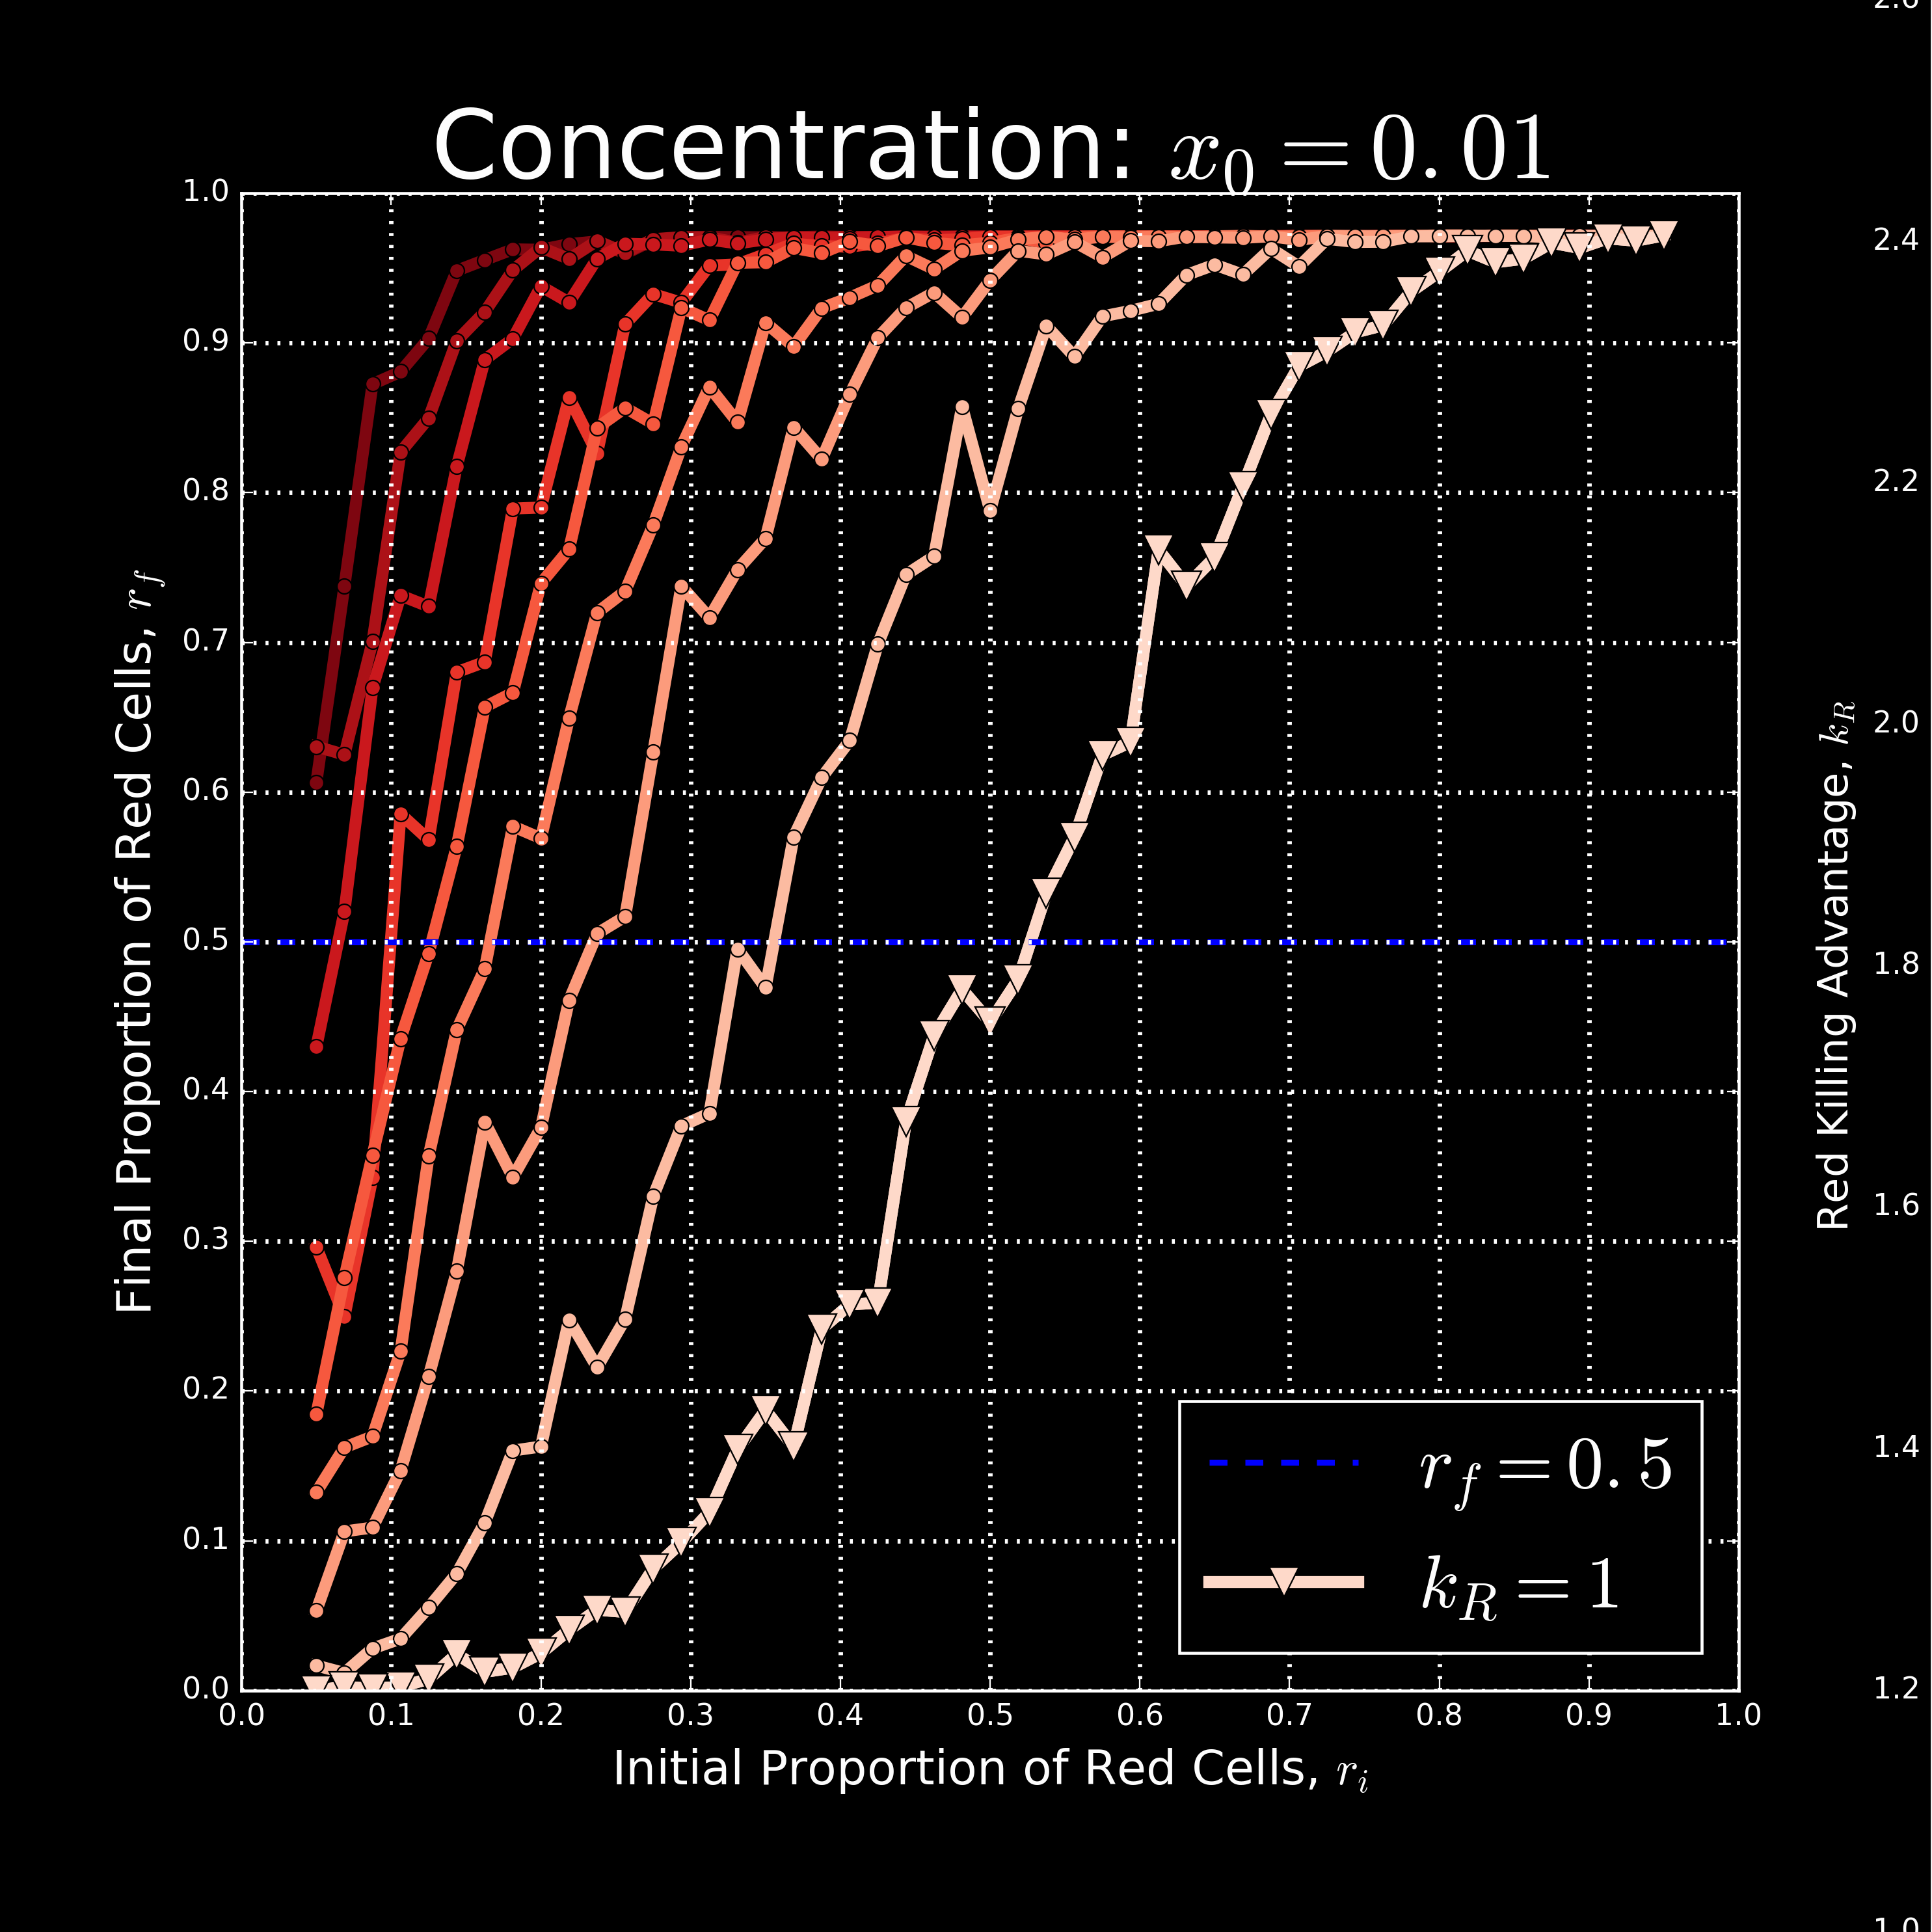
Finally, we investigated the effect of the initial cellular concentration, . The effect is readily visualized in Figure 2D, where a competition was initialized with cellular density decreasing from 100% (left) to 0% (right). Blue (an inferior killer, that is initially more abundant ) cells fare better in initially high concentration regimes. Conversely, low initial density favors the strain with the killing advantage, even when it is initially out-numbered by a significant margin. This effect is quantified in Figure 2 B. Here, we generate a family of logistic curves like the one shown in Figure 2 A by repeating all of the simulations as described above, but seeded with a particular initial concentration of cells, . For each data point, we discern the minimum proportion of red cells needed to win the competition, , for a given and (Figure 2 B). We find that large initial concentrations of cells favor the strain with a numeric advantage, even though it has a significantly inferior killing rate (like the blue strain in Figure 2 D), while small initial concentrations of cells favor the strain with a killing rate advantage.
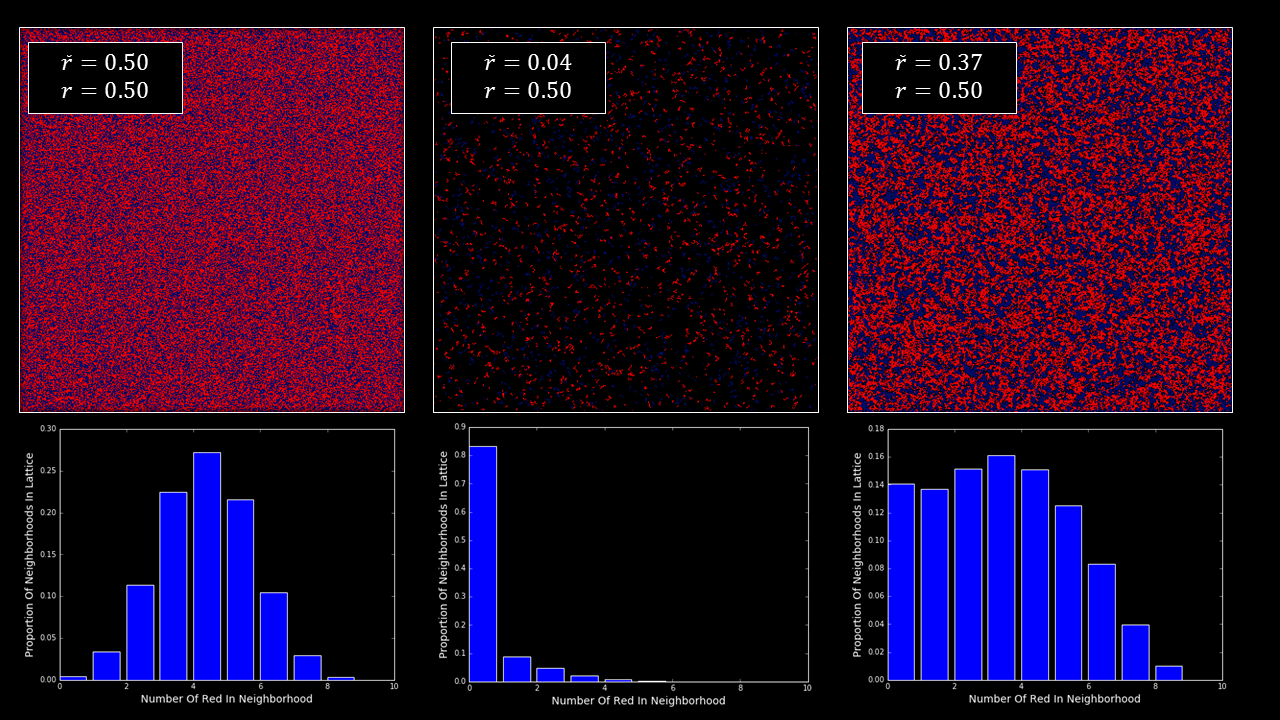
The mechanism behind this counter-intuitive density dependence can be understood by considering the local environment a cell experiences at early times. We measured the average local fraction of red cells timestep after the start of each simulation, , and plotted the value of when red cells win the competition as a function of and . This collapses the curves of Figure 2B onto a single trend line. When a superior but outnumbered cell is deposited into a crowded area it is immediately confronted with its minority status, and any local frequency-dependent selection effects are likely to diminish its long term success. For example, for cells equipped with T6SS, even a strain that kills at twice the per-cell rate as its competitor is nevertheless at a competitive disadvantage if it immediately faces three times as many enemies within killing range. However, a superior but outnumbered cell that is deposited into a sparse area undergoes initially unimpeded clonal outgrowth and soon establishes a local majority wherein frequency dependent effects enhance its viability. Even if the global number ratio of red to blue cells is equivalent in a sparse or dense inoculate, differences in the local number ratio—ultimately the relevant parameter for local interactions—-can effect different outcomes.
† In fact is measured at early but non-zero time ( timesteps), see SI Figure 7.
‡ Here, by local we mean the nine-automaton neighborhood centered at .
4 Conclusions
Drying droplets of water structure surface-attached microbial communities through the coffee-ring effect. Using a bacterial model system, we show how the deposition of V. cholerae cells in the classic ’coffee ring’ pattern changes competitive (and thus evolutionary) outcomes: T6SS-mediated killing is frequency-dependent, causing the superior killer to win in the low-density interior of the biofilm while losing in the high-density coffee ring. This has fundamental implications for understanding the spatial ecology of microbes, and allows for novel predictions: for example, our model predicts that the overall winner of the competition modeled in Figure 1 C can be flipped simply by changing the radius of the droplet (which changes the relative size of the interior relative to the ring). We anticipate the coffee-ring effect will be relevant to a broad swath of microbes that possess frequency and density dependent interactions (e.g., quorum sensing, or the production of extracellular metabolites and biofilm structural components). Given how difficult it is to avoid the coffee-ring effect when drying droplets of cells on agar media, it likely also plays a significant yet under-appreciated role in microbiological experiments.
5 Data Access
All simulations were implemented in Python 3.5, using NumPy and SciPy for numerics, Matplotlib for plotting and the Python Imaging Library to generate images. Simulation source is available at:
https://github.gatech.edu/dyanni3/V.Cholerae.Coffee.Ring/tree/master
6 Author Contributions
Designed and Interpreted Experiments:
David Yanni, Arben Kalziqi, Jacob Thomas, Siu Lung Ng, William C. Ratcliff, Brian K. Hammer, Peter J. Yunker
Helped with writing:
David Yanni,
Arben Kalziqi,
Jacob Thomas,
Siu Lung Ng,
William C. Ratcliff,
Brian K. Hammer,
Peter J. Yunker
Performed Imaging:
David Yanni,
Jacob Thomas
Constructed and/or prepared V. cholerae strains:
Jacob Thomas,
Siu Lung Ng,
Brian K. Hammer
Performed Simulations and Analysis:
David Yanni
7 Competing Interests
None of the submitted material has been published or is under consideration elsewhere. We do not have any related papers in press or under consideration, or any other competing interests.
8 Funding Statement
This work was supported by National Science Foundation grants MCB-1149925 to B.H and IOS-1656549 to P.J.Y. and W.C.R. W.C.R. was also supported by a Packard Foundation Fellowship. P.Y. and W.C.R. were supported by the Georgia Tech Soft Matter Incubator.
9 Acknowledgements
We would like to thank Bryan T. Weinstein for useful discussion.
10 Supplementary Information
10.1 The V. cholerae coffee-ring
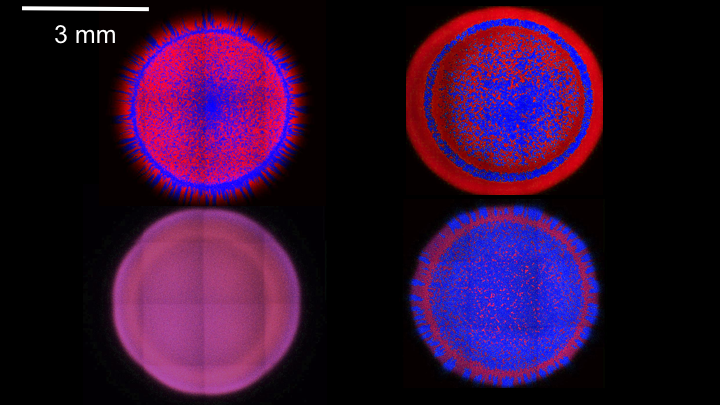
Replicates of the outcome of the competition between two strains of V. cholerae exhibit similar final morphologies (supplemental figure 1). Additionally, color-swapped strains show a similar effect, further suggesting that production of fluorescent proteins does not affect their fitness (supplemental figure 1). Finally, defective-killer versions of these strains only shows a very faint coffee ring (supplemental figure 1).
The coffee-ring, constructed of V. cholerae can clearly be seen in fluorescence (supplemental figure 3) and brightfield images (supplemental figure 4). Fluorescence microscopy also permits measurement of the local number ratio.
10.2 Simulations
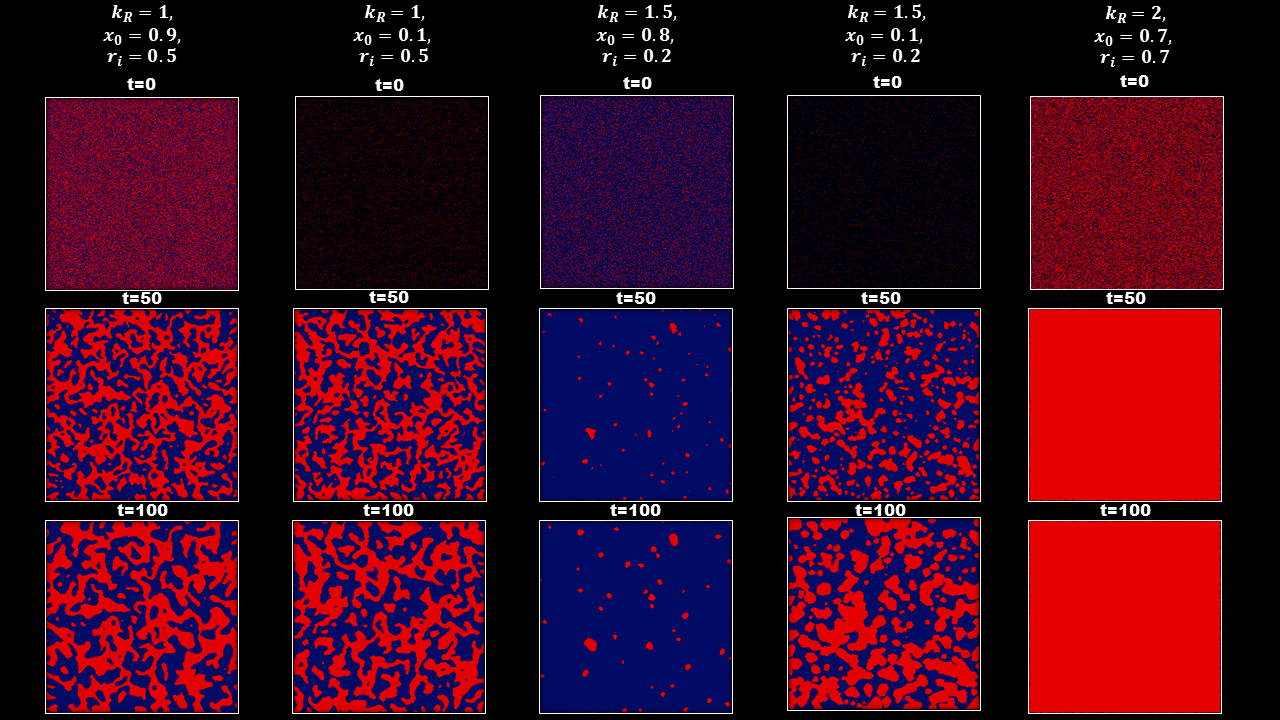
Example images in supplemental figure 2 show the progression of simulations over time for five different sets of parameters. The data in supplemental figure 5 are extracted from simulations shown in supplemental figure 2. Then, a logistic fit, shown in supplemental figure 6, is applied, allowing the extraction of .
Supplemental figure 7 demonstrates how simulations with the same number ratio between red and blue strains, , can appear significantly different, and have very different local number ratios, . Histograms demonstrating the distribution of local configurations are shown as well.
References
- [1] Flemming H, Wingender J, Szewzyk U, Steinberg P, Rice S, Kjelleberg S. Biofilms: an emergent form of bacterial life. Nature Reviews Microbiology. 2016;14(9):563-575.
- [2] Tolker-Nielsen T, Molin S. Spatial organization of microbial biofilm communities. Microbial ecology. 2000 Aug 24;40(2):75-84.
- [3] Nadell C, Drescher K, Foster K. Spatial structure, cooperation and competition in biofilms. Nature Reviews Microbiology. 2016;14(9):589-600.
- [4] Nielsen A, Tolker-Nielsen T, Barken K, Molin S. Role of commensal relationships on the spatial structure of a surface-attached microbial consortium. Environmental Microbiology. 2000;2(1):59-68.
- [5] Van Gestel J, Weissing FJ, Kuipers OP, Kovács AT. Density of founder cells affects spatial pattern formation and cooperation in Bacillus subtilis biofilms. The ISME journal. 2014 Oct 1;8(10):2069-79.
- [6] Costerton JW. Bacterial Biofilms: A Common Cause of Persistent Infections. Science. 1999;284(5418):1318–22.
- [7] Hall-Stoodley L, Costerton JW, Stoodley P. Bacterial biofilms: from the Natural environment to infectious diseases. Nature Reviews Microbiology. 2004;2(2):95–108.
- [8] Kumar C, Anand S. Significance of microbial biofilms in food industry: a review. International Journal of Food Microbiology. 1998;42(1-2):9–27.
- [9] Ledin M. The environmental impact of mine wastes – Roles of microorganisms and their significance in treatment of mine wastes. Earth-Science Reviews. 1996;41(1-2):67–108.
- [10] Davey ME, O’Toole GA. Microbial Biofilms: from Ecology to Molecular Genetics. Microbiology and Molecular Biology Reviews. 2000Jan;64(4):847–67.
- [11] Persat A, Nadell CD, Kim MK, Ingremeau F, Siryaporn A, Drescher K, et al. The Mechanical World of Bacteria. Cell. 2015;161(5):988–97.
- [12] Deegan RD, Bakajin O, Dupont TF, Huber G, Nagel SR, Witten TA. Capillary flow as the cause of ring stains from dried liquid drops. Nature 1997;389 (6653):827-829.
- [13] Deegan RD, Bakajin O,Dupont TF, Huber G, Nagel SR, Witten TA. Contact line deposits in an evaporating drop. Phys. Rev. E (2000): 62,756.
- [14] Deegan RD. Pattern formation in drying drops Phys. Rev. E (2000) 61, 475.
- [15] Yunker, P. J., Still, T, Lohr, M. A., Yodh, A. G. Suppression of the coffee-ring effect by shape-dependent capillary interactions. Nature (2011); 476(7360):308-311.
- [16] Sempels W, De Dier R, Mizuno H, Hofkens J, Vermant J. Auto-production of biosurfactants reverses the coffee ring effect in a bacterial system. Nature Communications. 2013;4:1757.
- [17] Wong T, Chen T, Shen X, Ho C. Nanochromatography Driven by the Coffee Ring Effect. Analytical Chemistry. 2011;83(6):1871-1873.
- [18] Thokchom AK, Swaminathan R, Singh A. Fluid flow and particle dynamics inside an evaporating droplet containing live bacteria displaying chemotaxis. Langmuir. 2014 Oct 8;30(41):12144-53.
- [19] Whitman WB, Coleman DC, Wiebe WJ. Prokaryotes: The unseen majority. PNAS, 1998 Sep;95(12):6578-83.
- [20] Russell A, Peterson S, Mougous J. Type VI secretion system effectors: poisons with a purpose. Nature Reviews Microbiology. 2014;12(2):137-148.
- [21] McNally L, Bernardy E, Thomas J, Kalziqi A, Pentz J, Brown S et al. Killing by Type VI secretion drives genetic phase separation and correlates with increased cooperation. Nature Communications. 2017;8:14371.
- [22] Bernardy E, Turnsek M, Wilson S, Tarr C, Hammer B. Diversity of Clinical and Environmental Isolates of Vibrio cholerae in Natural Transformation and Contact-Dependent Bacterial Killing Indicative of Type VI Secretion System Activity. Applied and Environmental Microbiology. 2016;82(9):2833-2842.
- [23] Hallatschek O, Nelson D. Gene surfing in expanding populations. Theoretical Population Biology. 2008;73(1):158-170.
- [24] Weinstein BT, Lavrentovich MO, Möbius W, Murray AW, Nelson DR. Genetic Drift and Selection in Many-Allele Range Expansions. bioRxiv. 2017Jul;