Abundant Methanol Ice toward a Massive Young Stellar Object
in the Central Molecular Zone
111Based in part on data collected at Subaru Telescope, which is operated by the National Astronomical Observatory of Japan.
Abstract
Previous radio observations revealed widespread gas-phase methanol (CH3OH) in the Central Molecular Zone (CMZ) at the Galactic center (GC), but its origin remains unclear. Here, we report the discovery of CH3OH ice toward a star in the CMZ, based on a Subaru –m spectrum, aided by NASA/IRTF imaging and –m spectra. The star lies au away in projection from a massive young stellar object (MYSO). Its observed high CH3OH ice abundance ( relative to H2O ice) suggests that the m CH3OH ice absorption likely arises in the MYSO’s extended envelope. However, it is also possible that CH3OH ice forms with a higher abundance in dense clouds within the CMZ, compared to within the disk. Either way, our result implies that gas-phase CH3OH in the CMZ can be largely produced by desorption from icy grains. The high solid CH3OH abundance confirms the prominent m shoulder absorption observed toward GC MYSOs arises from CO2 ice mixed with CH3OH.
Subject headings:
astrochemistry — Galaxy: nucleus — ISM: abundances — stars: massive — stars: protostars1. Introduction
Methanol (CH3OH) is a key species in the formation of complex organic molecules. CH3OH is observed in gas phase throughout the Central Molecular Zone (CMZ), the innermost pc region of the Milky Way (see Morris & Serabyn, 1996), with a wide variation in abundance relative to H2 (–; Requena-Torres et al., 2006; Yusef-Zadeh et al., 2013). Complex organic molecules are also observed throughout the CMZ, with high and constant gas-phase abundances, relative to gas-phase CH3OH, that are matched by hot cores in the Galactic disk (Requena-Torres et al., 2006).
Gas-phase production of CH3OH is inefficient, but formation by the hydrogenation of CO ices in dense ( cm-3) and cold ( K) environments, such as dense molecular cores, is very active as shown by laboratory experiments and Monte Carlo simulations (e.g., Watanabe et al., 2003; Cuppen et al., 2009; Coutens et al., 2017). A number of non-thermal desorption mechanisms, including shocks (Requena-Torres et al., 2008), cosmic rays (Yusef-Zadeh et al., 2013), and episodic explosions (Coutens et al., 2017) have been proposed to explain the widespread gas-phase CH3OH (possibly along with other complex molecules; see Rawlings et al., 2013) in the CMZ. However, previous searches for CH3OH ice in the CMZ have been unsuccessful; only upper limits on the abundance of solid CH3OH relative to H2O ice, (CH3OH)/(H2O), have been established from Sgr A* () and the Quintuplet cluster star GCS 3-I (catalog WR~102dd) () (Chiar et al., 2000; Gibb et al., 2004; Moultaka et al., 2015).
Indirect evidence of the presence of solid CH3OH came from mid-infrared spectra of massive young stellar objects (MYSOs) in the Galactic center (GC) region (An et al., 2009, 2011). We identified these GC MYSOs by their wide absorption profile of m CO2 ice, with a strong ‘shoulder’ absorption component centered at m. To date, this 15.4 m shoulder has only been observed toward disk MYSOs (Boogert et al., 2015, and references therein). Laboratory studies attribute the m shoulder absorption to Lewis interaction of CO2 in icy grains with other molecules such as methanol, ethanol, butanol, or diethylether (Dartois et al., 1999a). CH3OH has the highest abundance of these toward Galactic disk MYSOs.
The question emerges as to whether the observed m shoulder CO2 ice absorption in the CMZ is produced by Lewis-base molecules other than CH3OH because of the unusual CMZ conditions. CMZ molecular clouds are warmer, denser, and more turbulent than molecular clouds in the disk. Stronger tidal shear forces and magnetic fields pervade the CMZ (see Morris & Serabyn, 1996, and references therein). The cosmic ray ionization rate is higher than in the disk (Goto et al., 2008). All these effects may complicate and lead to chemical networks that are distinct from those under local cloud conditions.
In this letter, we report the first direct detection of solid CH3OH in the CMZ by searching for the m C–H stretching mode of CH3OH ice in the GC MYSO SSTGC 726327 (catalog SSTGC~726327). The m absorption is almost independent of ice mantle composition (Hudgins et al., 1993; Ehrenfreund et al., 1999), and therefore can be used to reliably measure a column density of solid CH3OH. SSTGC 726327 is one of MYSOs identified in the GC using –m Spitzer/IRS spectra (An et al., 2009, 2011), with both the m shoulder CO2 ice and m gas-phase CO2 absorption. Its silicate feature implies an integrated (both foreground and internal) visual extinction mag, while the foreground extinction from the Galactic disk is mag (Schultheis et al., 2009).
2. Observations and Data Reductions
2.1. IRTF
We acquired -band images of SSTGC 726327 with NSFCAM2 (Shure et al., 1994) at the 3.0 m NASA/IRTF on 2010 July 19 (UT). We took two sets of images in a dither pattern, yielding a total effective exposure time of s for each set. The FWHM of image was . We used standard IRAF222IRAF is distributed by the National Optical Astronomy Observatory, which is operated by the Association of Universities for Research in Astronomy (AURA) under a cooperative agreement with the National Science Foundation. routines to reduce images and extract photometry. SSTGC 726327 is a point source in [3.6] IRAC images (Ramírez et al., 2008). Our higher-resolution image resolves SSTGC 726327 into faint extended emission plus two point sources separated by 2″: SSTGC 726327E (UGPS J174653.31-283201.2 (catalog )) and SSTGC 726327W (UGPS J174653.16-283201.5 (catalog )).
In addition to the images, we obtained a –m spectrum of SSTGC 726327E with SpeX (Rayner et al., 2003) at the NASA/IRTF, on 2009 May 15 (UT). We observed through varying amounts of cirrus in the long cross-dispersed (LXD) mode. The slit width of , matching the seeing, resulted in = . We nodded the telescope along the north–south slit. The total on-source integration time was minutes.
Flat field, argon arc, and telluric standard spectra were taken immediately before and after the observation. The airmass difference between the object and telluric standard spectra was negligible. The spectra were extracted using Spextool, a spectral extraction package for SpeX (Cushing et al., 2004), in the point source extraction mode. We corrected for telluric absorption following the standard procedures in Vacca et al. (2003). We flagged wavelengths with strong atmospheric absorptions from a telluric standard spectrum by taking a difference from its pseudo continuum, which was fit by a -order polynomial in each spectral order. We removed data points with less than atmospheric transmission. The signal-to-noise ratio (S/N) of the final spectrum is at m–m.
2.2. Subaru
We obtained –m high-resolution spectra of SSTGC 726327E and SSTGC 726327W with the echelle mode of IRCS (Kobayashi et al., 2000), combined with an adaptive optics (AO) system, at the 8.2 m Subaru telescope on 2014 June 20 (UT). The sky was mostly clear. The seeing was in FWHM after the AO correction. We nodded the two objects along the slit (, ) for sky subtraction. We used LB-, LB0, and LB+ configurations to have continuous spectral coverage. The total on-source integration time for SSTGC 726327E was hr in LB0, which covers most of the CH3OH ice band, and hr each in LB- and LB+.
We observed a set of A-type stars every hour for wavelength, telluric, and flux calibrations. We grouped individual frames, depending on the time of observations and air masses, and made co-added echelle frames before extraction. We extracted spectra using IRAF routine apall with an extraction aperture of . We corrected for hydrogen absorption lines in the standard star spectra using a smoothed theoretical spectrum of Vega (Castelli & Kurucz, 2004)333http://kurucz.harvard.edu/stars/vega/, and then derived telluric corrections. We flagged and removed data where the atmospheric transmission, relative to an observed psuedo continuum, was . We averaged the flux into nm wide bins in steps of nm. Our final spectrum has and S/N of per binned data point in LB0 and S/N in LB- and LB+. The SSTGC 726327W spectrum was extremely noisy and will not be discussed further.
Our flux calibrated Subaru/IRCS spectra are fainter than IRTF/SpeX -band spectra by almost a factor of two, and show mild flux differences (–) in order overlaps. To correct for this, we scaled the IRCS spectra to match our IRTF spectrum by taking a median difference in logarithmic flux at m–m for each of the three echelle configurations.
3. Results
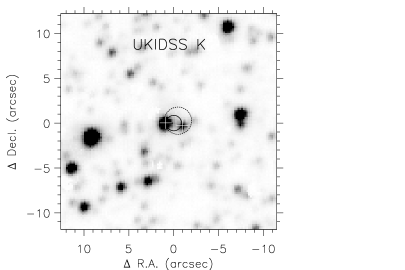
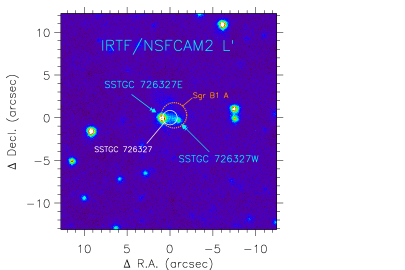
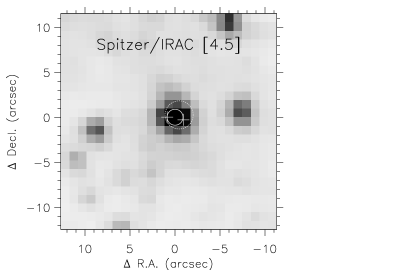
Figure 1 compares our image (middle) with the -band image from the UKIDSS Galactic Plane Survey (Lucas et al., 2008, top), and the Spitzer/IRAC [4.5] channel image (Ramírez et al., 2008, bottom). UKIDSS photometry plus our point-spread function fitting photometry shows that = 9.3 for SSTGC 726327E, with and . The (3.8 m) photometry is in good agreement with [3.6] = 9.3 for SSTGC 726327 (Ramírez et al., 2008). The extended emission we detect at , but not at , roughly coincides with the 3″ (0.12 pc) diameter H II region Sgr B1 A (catalog ) (Mehringer et al., 1992, dotted circle), also known as GPSR5 0.488-0.028 (catalog ) (Becker et al., 1994).
The IRAC source SSTGC 726327 is a composite of flux from SSTGC 726327E, SSTGC 726327W, the H II region, and the MYSO. The IRAC position, relative to SSTGC 726327E, is west at m, but is located further away () at 8.0 m (Ramírez et al., 2008). Morales et al. (2016) find that, when a candidate YSO selected based on Spitzer/IRAC photometry is matched to a UKIDSS source by their spectral energy distributions, 94% of the Spitzer and UKIDSS sources are separated by 0.57″. This suggests SSTGC 726327 and SSTGC 726327E are distinct sources with a projected separation, for a GC distance of kpc, of to au.
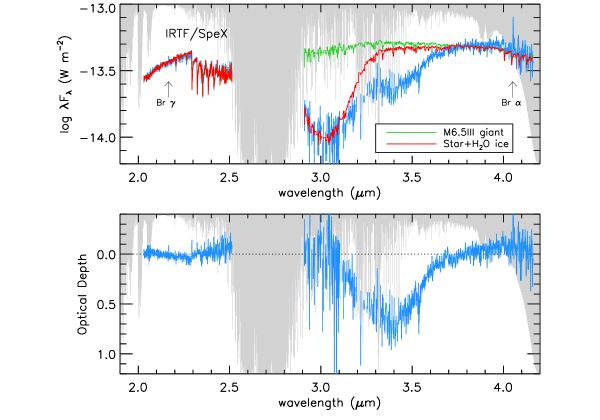
The top panel in Figure 2 shows our –m IRTF/SpeX spectrum of SSTGC 726327E (blue line). The spectrum shows photospheric 2.3 m CO band-head absorption, demonstrating that SSTGC 726327E is probably a background giant star rather than a MYSO. The observed Br (m) and Br (m) emission likely arise in the Sgr B1 A H II region.
We searched for the best-fitting spectral type, the peak optical depth of the m H2O ice band [(H2O)], and foreground dust extinction of SSTGC 726327E, by utilizing the IRTF/SpeX spectral library (Rayner et al., 2009), the optical constants of K amorphous H2O ice on m grains, and the extinction curve derived from the line of sight to a dense core (Boogert et al., 2011). We minimized the reduced () of the fit to the SpeX spectra and and UKIDSS photometry ( and ). We masked Br and Br emission lines, and excluded data points at m m to avoid the m absorption band discussed later. We multiplied the and spectra by a constant factor () to match the UKIDSS -band measurement ().
We found that SSTGC 726327E is likely a M giant or K/M supergiant, along with (H2O) and . The errors represent a range of values within from the minimum (). We found a smaller if we used the GC extinction curve from Fritz et al. (2011) instead; spectral types and (H2O) essentially remain unchanged within the errors. The green line in the top panel of Figure 2 shows our best-fitting spectrum (M6.5 III; HD 142143 (catalog )) with added reddening (). The red line represents the best-fitting spectrum to our IRTF/SpeX data, with the m H2O ice absorption [(H2O)] added to the reddened M6.5 III spectrum. The optical depth spectrum with respect to the best-fitting model is shown in the bottom panel of Figure 2. The strong, broad m absorption band in SSTGC 726327E is a blend of two distinct absorption features from icy molecular cloud grains (Brooke et al., 1999) and foreground diffuse cloud dust (Sandford et al., 1991; Pendleton et al., 1994).
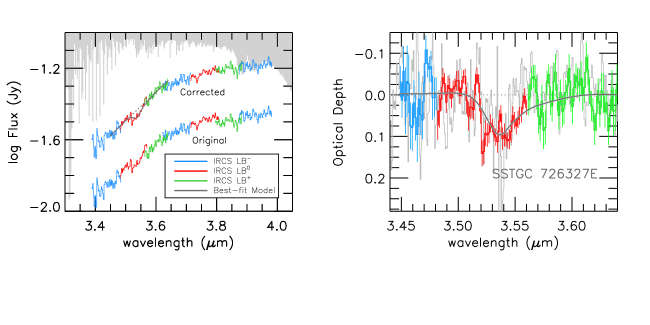
In the left panel of Figure 3, our –m IRCS spectra of SSTGC 726327E are shown before (‘original’) and after scaling the flux to match the IRTF data (‘corrected’). Methanol ice absorption is seen at m in our IRTF spectrum (Figure 2), but it is more clearly observed in the IRCS spectra. We do not detect the weaker CH3OH features at m and m (Dartois et al., 1999b).
We derived a local continuum across the m band using a first order polynomial fitted at m (–) and m (–) in wavenumber space (dotted line). The right panel in Figure 3 shows the optical depth derived by dividing the ‘corrected’ IRCS spectra by the local continuum. We employed a laboratory transmission spectrum of K pure CH3OH ice (Hudgins et al., 1993), in which the m band overlaps with another, wide band, centered at m ( cm-1) from the C–H stretching mode. We fitted a first order polynomial to the laboratory spectrum over the same wavelength intervals adopted for the continuum construction, and isolated the m component by subtracting the local baseline. The solid lines in Figure 3 show our best-fitting model spectrum for CH3OH ice, which has a peak optical depth at m, (CH3OH), of . This agrees with a result from an alternative approach, in which we restricted our fit to m–m and simultaneously searched for the flux scaling factors of individual IRCS orders and the best-fitting laboratory CH3OH ice spectrum.
| Object(s) | ||||||
|---|---|---|---|---|---|---|
| (mag) | cm | cm | ||||
| SSTGC 726327E | –aaA range bracketed by values from our model fitting, either with a dense core extinction curve (Boogert et al., 2011) or a lower from model fitting with a GC extinction law (Fritz et al., 2011). We assumed . | |||||
| Sgr A* (catalog ) | ||||||
| GCS 3 I (catalog WR 102dd) | 29 | |||||
| Massive YSOs | to 0.31 | |||||
| Low-mass YSOs | to 0.25 | |||||
| Quiescent clouds | to 0.12 |
Table 1 summarizes the m CH3OH ice optical depth and column density for SSTGC 726327E. The shape and the intrinsic integrated band strength () for the m C–H stretch mode have a weak dependence on temperature and abundance of ice mantles (e.g., Ehrenfreund et al., 1999; Kerkhof et al., 1999). We averaged values from Hudgins et al. (1993) and Schutte et al. (1996) to adopt cm molecule-1 for CH3OH ice, then derived its column density. We also list (H2O) for SSTGC 726327E. We computed by multiplying (H2O) by FWHM cm-1, and assuming cm molecule-1 (Hagen et al., 1981).
4. Discussion
In this letter, we present the first detection of CH3OH ice absorption toward the CMZ, in the background star SSTGC 726327E. Geballe & Oka (2010) identified m absorption in a background GC star as possibly due to CH3OH ice, but the absence of m CH3OH ice absorption rules out this identification (T. R. Geballe, 2016, private communication). Table 1 compares (CH3OH)/(H2O) toward SSTGC 726327E to previous upper limits from a 14″20″ aperture placed on Sgr A* and from the Quintuplet cluster star GCS 3-I (catalog WR 102dd) (Chiar et al., 2000; Gibb et al., 2004). (CH3OH)/(H2O) is times higher toward SSTGC 726327E than toward Sgr A*.
SSTGC 726327E is au in projection from the MYSO SSTGC 726327 in Sgr B1. The CH3OH ice absorption we detect toward SSTGC 726327E likely arises from the extended envelope of the MYSO, which can extend to – au (e.g., van der Tak et al., 2000b). Pontoppidan et al. (2004) have measured column densities of CH3OH ice from an extended envelope of a low-mass Class 0 protostar, Serpens SMM 4 (catalog NAME Serpens SMM 4), based on the band spectra of 10 pre-main sequence stars. These ‘background’ stars show a constant / at projected distances of – au from Serpens SMM 4, then no CH3OH at a projected distance of au. They conclude, as we do, that some or all CH3OH ice absorption arises from the extended envelope of the YSO.
While we have discovered CH3OH ice in one line of sight to CMZ, CH3OH ice is found in abundance not only in YSOs, but also toward stars behind cold, quiescent molecular clouds and cores in the Galactic disk at mag (Table 1; Boogert et al., 2015). For two disk MYSOs (RAFGL 7009S and W33 A; Brooke et al., 1999; Dartois et al., 1999b), (CH3OH)/(H2O) is higher than the maximum value observed toward stars behind quiescent cores in the disk (0.12; Boogert et al., 2011). This empirical division also makes the case for SSTGC 726327E being behind the envelope of the MYSO SSTGC 726327.
If SSTGC 726327 has physical and chemical structures similar to those of W33 A (van der Tak et al., 2000a, b), the maximum gas density encountered along the line of sight at the projected distance of au is cm-3, which is sufficiently large enough to maintain CH3OH formation in its envelope. However, the gas temperature within the MYSO envelope likely exceeds the sublimation temperature of CO ( K) all the way to the edge of the MYSO, under which additional growth of CH3OH on ice mantles should be suppressed (Watanabe et al., 2003; Cuppen et al., 2009). CMZ clouds are on average warmer than in the disk, but there are dense shielded regions with cold ( K) dust grains (Rodríguez-Fernández et al., 2004; Molinari et al., 2011), where CH3OH can form. Then it is possible that CH3OH ice grains arise in dense molecular clouds within the CMZ, in which case the star SSTGC 726327E is projected by chance next to the MYSO.
The fractional abundance of CH3OH ice with respect to H2 is toward SSTGC 726327E, if our best-fitting is taken with and cm-2 mag-1 (see Hasenberger et al., 2016, and references therein). This order of magnitude estimate is – times larger than the gas-phase CH3OH abundance in the CMZ (Requena-Torres et al., 2006; Yusef-Zadeh et al., 2013). While systematic searches for CH3OH ices should be proceeded before making any firm conclusions, our estimate suggests that gas-phase CH3OH in the CMZ can be largely produced by desorption of CH3OH from icy grains (e.g., Requena-Torres et al., 2008; Yusef-Zadeh et al., 2013; Coutens et al., 2017).
In spite of abundant CH3OH ices in various sight lines, broad CO2 ice bands with the m shoulder absorption have, to date, only been observed toward YSOs (Boogert et al., 2015). About of the CO2 absorption in SSTGC 726327 is attributed to the shoulder CO2 (An et al., 2011). With our measurement of CH3OH abundance, we found (CH3OH)/(CO2 shoulder). We applied the same spectral decomposition procedure to the observed CO2 ice profile of the ISO spectrum of W33 A (Gerakines et al., 1999), and found for the fraction of the shoulder component, which results in (CH3OH)/(CO2 shoulder) based on (CH3OH) in Brooke et al. (1999). Although there exists a factor of three difference in this comparison, systematic errors likely dominate, since our measurement only traces CH3OH ice in the outer part of the MYSO. The similar (CH3OH)/(CO2 shoulder) implies that CH3OH is indeed the best candidate for interacting molecules in the observed m shoulder CO2 toward GC MYSOs (An et al., 2009, 2011), as it is in disk MYSOs. Additional observations are clearly needed to extend a source list, establish their properties, and estimate the variance of CH3OH ice in the CMZ.
References
- An et al. (2009) An, D., Ramírez, S. V., Sellgren, K., et al. 2009, ApJ, 702, L128
- An et al. (2011) An, D., Ramírez, S. V., Sellgren, K., et al. 2011, ApJ, 736, 133
- Becker et al. (1994) Becker, R. H., White, R. L., Helfand, D. J., & Zoonematkermani, S. 1994, ApJS, 91, 347
- Boogert et al. (2015) Boogert, A. C. A., Gerakines, P. A., & Whittet, D. C. B. 2015, ARA&A, 53, 541
- Boogert et al. (2011) Boogert, A. C. A., Huard, T. L., Cook, A. M., et al. 2011, ApJ, 729, 92
- Brooke et al. (1999) Brooke, T. Y., Sellgren, K., & Geballe, T. R. 1999, ApJ, 517, 883
- Castelli & Kurucz (2004) Castelli, F., & Kurucz, R. L. 2004, arXiv:astro-ph/0405087
- Chiar et al. (2000) Chiar, J. E., Tielens, A. G. G. M., Whittet, D. C. B., Schutte, W. A., Boogert, A. C. A., Lutz, D., van Dishoeck, E. F., & Bernstein, M. P. 2000, ApJ, 537, 749
- Coutens et al. (2017) Coutens, A., Rawlings, J. M. C., Viti, S., & Williams, D. A. 2017, MNRAS, 467, 737
- Cuppen et al. (2009) Cuppen, H. M., van Dishoeck, E. F., Herbst, E., & Tielens, A. G. G. M. 2009, A&A, 508, 275
- Cushing et al. (2004) Cushing, M. C., Vacca, W. D., & Rayner, J. T. 2004, PASP, 116, 362
- Dartois et al. (1999a) Dartois, E., Demyk, K., d’Hendecourt, L., & Ehrenfreund, P. 1999a, A&A, 351, 1066
- Dartois et al. (1999b) Dartois, E., Schutte, W., Geballe, T. R., et al. 1999b, A&A, 342, L32
- Ehrenfreund et al. (1999) Ehrenfreund, P., Kerkhof, O., Schutte, W. A., et al. 1999, A&A, 350, 240
- Fritz et al. (2011) Fritz, T. K., Gillessen, S., Dodds-Eden, K., Lutz, D., Genzel, R., Raab, W., Ott, T., Pfuhl, O., Eisenhauer, F., & Yusef-Zadeh, F. 2011, ApJ, 737, 73
- Geballe & Oka (2010) Geballe, T. R., & Oka, T. 2010, ApJL, 209, L70
- Gerakines et al. (1999) Gerakines, P. A., Whittet, D. C. B., Ehrenfreund, P., et al. 1999, ApJ, 522, 357
- Gibb et al. (2004) Gibb, E. L., Whittet, D. C. B., Boogert, A. C. A., & Tielens, A. G. G. M. 2004, ApJS, 151, 35
- Goto et al. (2008) Goto, M., Usuda, T., Nagata, T., Geballe, T. R., McCall, B. J., Indriolo, N., Suto, H., Henning, T., Morong, C. P., & Oka, T. 2008, ApJ, 688, 306
- Hagen et al. (1981) Hagen, W., Tielens, A. G. G. M., & Greenberg, J. M. 1981, Chemical Physics, 56, 367
- Hasenberger et al. (2016) Hasenberger, B., Forbrich, J., Alves, J., et al. 2016, A&A, 593, A7
- Hudgins et al. (1993) Hudgins, D. M., Sandford, S. A., Allamandola, L. J., & Tielens, A. G. G. M. 1993, ApJS, 86, 713
- Kerkhof et al. (1999) Kerkhof, O., Schutte, W. A., & Ehrenfreund, P. 1999, A&A, 346, 990
- Kobayashi et al. (2000) Kobayashi, N., Tokunaga, A. T., Terada, H., et al. 2000, Proc. SPIE, 4008, 1056
- Lucas et al. (2008) Lucas, P. W., Hoare, M. G., Longmore, A., et al. 2008, MNRAS, 391, 136
- Moultaka et al. (2015) Moultaka, J., Eckart, A., & Mužić, K. 2015, ApJ, 806, 202
- Mehringer et al. (1992) Mehringer, D. M., Yusef-Zadeh, F., Palmer, P., & Goss, W. M. 1992, ApJ, 401, 168
- Molinari et al. (2011) Molinari, S., Bally, J., Noriega-Crespo, A., et al. 2011, ApJ, 735, L33
- Morales et al. (2016) Morales, E. F. E., & Robitaille, T. P. 2017, A&A, 598, A136
- Morris & Serabyn (1996) Morris, M., & Serabyn, E. 1996, ARA&A, 34, 645
- Pendleton et al. (1994) Pendleton, Y. J., Sandford, S. A., Allamandola, L. J., Tielens, A. G. G. M., & Sellgren, K. 1994, ApJ, 437, 683
- Pontoppidan et al. (2004) Pontoppidan, K.M., van Dishoeck, E.F., & Dartois, E. 2004, A&A, 426, 925
- Ramírez et al. (2008) Ramírez, S. V., Arendt, R. G., Sellgren, K., et al. 2008, ApJS, 175, 147
- Rawlings et al. (2013) Rawlings, J. M. C., Williams, D. A., Viti, S., Cecchi-Pestellini, C., & Duley, W. W. 2013, MNRAS, 430, 264
- Rayner et al. (2003) Rayner, J. T., Toomey, D. W., Onaka, P. M., et al. 2003, PASP, 115, 362
- Rayner et al. (2009) Rayner, J. T., Cushing, M. C., & Vacca, William D. 2009, ApJS, 185, 289
- Requena-Torres et al. (2006) Requena-Torres, M. A., Martín-Pintado, J., Rodríguez-Franco, A., Martín, S., Rodríguez-Fernández, N. J., & de Vicente, P. 2006, A&A, 455, 971
- Requena-Torres et al. (2008) Requena-Torres, M. A., Martín-Pintado, J., Martín, S., & Morris, M. R. 2008, ApJ, 672, 352
- Rodríguez-Fernández et al. (2004) Rodríguez-Fernández, N. J., Martín-Pintado, J., Fuente, A., & Wilson, T. L. 2004, A&A, 427, 217
- Sandford et al. (1991) Sandford, S. A., Allamandola, L. J., Tielens, A. G. G. M., et al. 1991, ApJ, 371, 607
- Schultheis et al. (2009) Schultheis, M., Sellgren, K., Ramírez, S., Stolovy, S., Ganesh, S., Glass, I. S., & Girardi, L. 2009, A&A, 495, 157
- Schutte et al. (1996) Schutte, W. A., Gerakines, P. A., Geballe, T. R., van Dishoeck, E. F., & Greenberg, J. M. 1996, A&A, 309, 633
- Shure et al. (1994) Shure, M. A., Toomey, D. W., Rayner, J. T., Onaka, P. M., & Denault, A. J. 1994, Proc. SPIE, 2198, 614
- Vacca et al. (2003) Vacca, W. D., Cushing, M. C., & Rayner, J. T. 2003, PASP, 115, 389
- van der Tak et al. (2000a) van der Tak, F. F. S., van Dishoeck, E. F., & Caselli, P. 2000a, A&A, 361, 327
- van der Tak et al. (2000b) van der Tak, F. F. S., van Dishoeck, E. F., Evans, N. J., II, & Blake, G. A. 2000b, ApJ, 537, 283
- Watanabe et al. (2003) Watanabe, N., Shiraki, T., & Kouchi, A. 2003, ApJ, 588, L121
- Yusef-Zadeh et al. (2013) Yusef-Zadeh, F., Cotton, W., Viti, S., Wardle, M., & Royster, M. 2013, ApJ, 764, L19