Molecular gas in the immediate vicinity of Sgr A* seen with ALMA
Abstract
We report serendipitous detections of line emission with ALMA in band 3, 6, and 7 in the central parsec of the Galactic center at an up to now highest resolution (0.7′′). Among the highlights are the very first and highly resolved images of sub-mm molecular emission of CS, H13CO+, HC3N, SiO, SO, C2H, and CH3OH in the immediate vicinity (1′′ in projection) of Sgr A* and in the circumnuclear disk (CND). The central association (CA) of molecular clouds shows three times higher CS/X (X: any other observed molecule) luminosity ratios than the CND suggesting a combination of higher excitation - by a temperature gradient and/or IR-pumping - and abundance enhancement due to UV- and/or X-ray emission. We conclude that the CA is closer to the center than the CND is and could be an infalling clump consisting of denser cloud cores embedded in diffuse gas. Moreover, we identified further regions in and outside the CND that are ideally suited for future studies in the scope of hot/cold core and extreme PDR/XDR chemistry and consequent star formation in the central few parsecs.
keywords:
Galaxy: center, Galaxy: nucleus, Submillimeter: ISM, ISM: molecules, ISM: clouds, ISM: kinematics and dynamics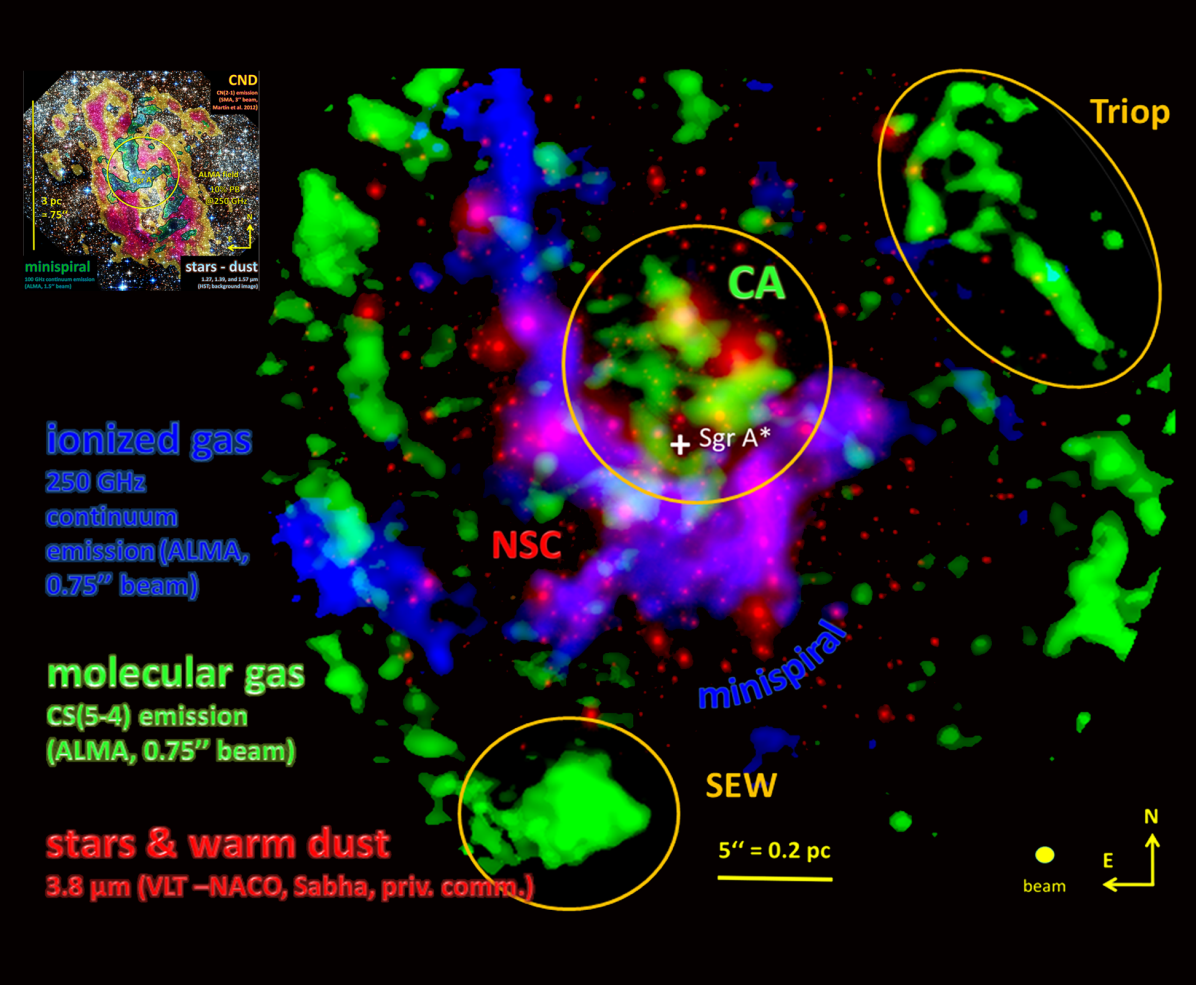
1 Introduction
Sagittarius A* (Sgr A*) at the center (distance: 8 kpc; e.g. [Schödel et al. 2002]) of our Galaxy is the closest supermassive black hole (SMBH) for which we can study its environment on scales less than 1000 AU (4 mpc). The nuclear stellar cluster (NSC; Fig. 1) engulfing Sgr A* comprises several extremely young stars (e.g. [Krabbe et al. 1995]) which raises the question on the star forming potential of the molecular gas in the cavity and at a ring at 1.5 pc distance - the circumnuclear disk (CND; Fig. 1) - and its transport to the center.
In [Moser et al. (2016)], we present Atacama Large Millimeter/ submillimeter Array (ALMA) data (project: 2011.0.00887.S) of the central parsecs of our Galaxy at 100, 250, and 340 GHz and at a to date highest spatial resolution of 1.5′′, 0.75′′, and 0.5′′ (0.02 pc), respectively. Here, we summarize our most important findings regarding the molecular gas emission.
2 Central association of gas clumps
Previous interferometric observations ([Montero-Castaño et al. 2009, Martín et al. 2012]) have indicated the presence of molecular gas close (few arcseconds in projection) to Sgr A*. Our ALMA data confirms this and gives the first high spatial resolution ( 0.75′′) probe of this region in CS(5–4) (brightest; Fig. 1), H13CO+(3–2), HC3N(27–26), SiO(6–5), SO(6–5), C2H(3–2), and CH3OH(7–6). The clumpy structure of this central association (CA) reaches less than 1′′ to the SMBH and covers velocities from about -80 km s-1 southeast to +80 km s-1 northwest of Sgr A*.
Since the line excitation is governed by several, for this region unconstrained factors, we cannot derive any density or temperature ranges of the molecular gas. Instead we can track changes in the interstellar matter (ISM) properties by the help of line luminosity ratios. We find that the CA shows three times higher CS/X (X: any other observed molecule) luminosity ratios than the CND. The NSC offers a variety of explanations: First, it heats the environment, hence a temperature gradient is likely. Second, it has a high infrared (IR) output, so that ro-vibrational transitions can be strongly excited and result in an overpopulation of the rotational levels (IR-pumping of CS, HCN, SiO; [Carroll & Goldsmith 1981]). Third, the NSC produces a strong UV- and X-ray field likely to change the chemical composition as seen in (edges of) Photo-Dissociation Regions (PDR)/X-ray Dominated Regions (XDR). Forth, shock chemistry may occur when the CA gas collides with the stellar winds. No single cause can explain the emission behaviour of each molecule satisfyingly, so that most likely a combination of them is at work. [Goto et al. (2014)] obtained a temperature and density estimated from H and CO spectra towards two positions within the CA of 300 K and cm-3, i.e. the molecular gas is warmer and less dense than the CND ([Requena-Torres et al. 2012, Mills et al. 2013]). This all suggests that the CA is closer to the center than the CND is.
In terms of its velocity, it might be related to the triop (Fig. 1) - a filamentary feature in the CND to the Northwest of Sgr A* between 20 - 120 km s-1. Another explanation is offered by a streamer detected in OH absorption by [Karlsson et al. (2015)]: This feature extends inside and along the southwestern CND (projection!) to the north and heads to the center from the southwest. Its compact ”head” has a mass of 65 and is consistent in shape, position and velocity distribution with the CA. We estimated the mass of the CA analogue to [Karlsson et al. (2015), Karlsson et al. (2015], i.e. a homogeneous ellipsoid with cm-3) and obtain 5 . The density traced by the OH transition could easily be a factor of 10 less than assumed by them, since OH can already be excited at much lower densities. Hence, the masses are roughly consistent. All in all, the OH steamer corroborates our scenario of an infalling clump consisting of denser cloud cores that are embedded in diffuse gas.
3 Triop and the SEW cloud
Despite its thin structure, the triop (Fig. 1) in CND northwest of Sgr A* shows comparably bright emission in all molecules in this as well as in previous observations (e.g. [Christopher et al. (2005), Montero-Castaño et al. 2009, Martín et al. 2012]). The luminosity ratios we derived correspond to the CND average. The range of detected transitions includes complex molecules, UV-sensitive species, and high energy transitions (i.e. HC3N(27–26) with 165 K). Furthermore, the triop harbours the closest (to Sgr A*) class I methanol maser (44 GHz; [Yusef-Zadeh et al. (2008), Sjouwerman et al. 2010]). With all these properties, the triop could show signs of an early phase of star formation/hot core.
In contrast to this, the bright compact cloud at the western tip of the Southern Extension of the CND (SEW; Fig. 1) shows line ratios similar to the CA, but not as high. Either we are witnessing a slightly attenuated impact of the NSC on the gas in the SEW or there is another source of the PDR/XDR or a shock.
4 Infrared-dark clouds
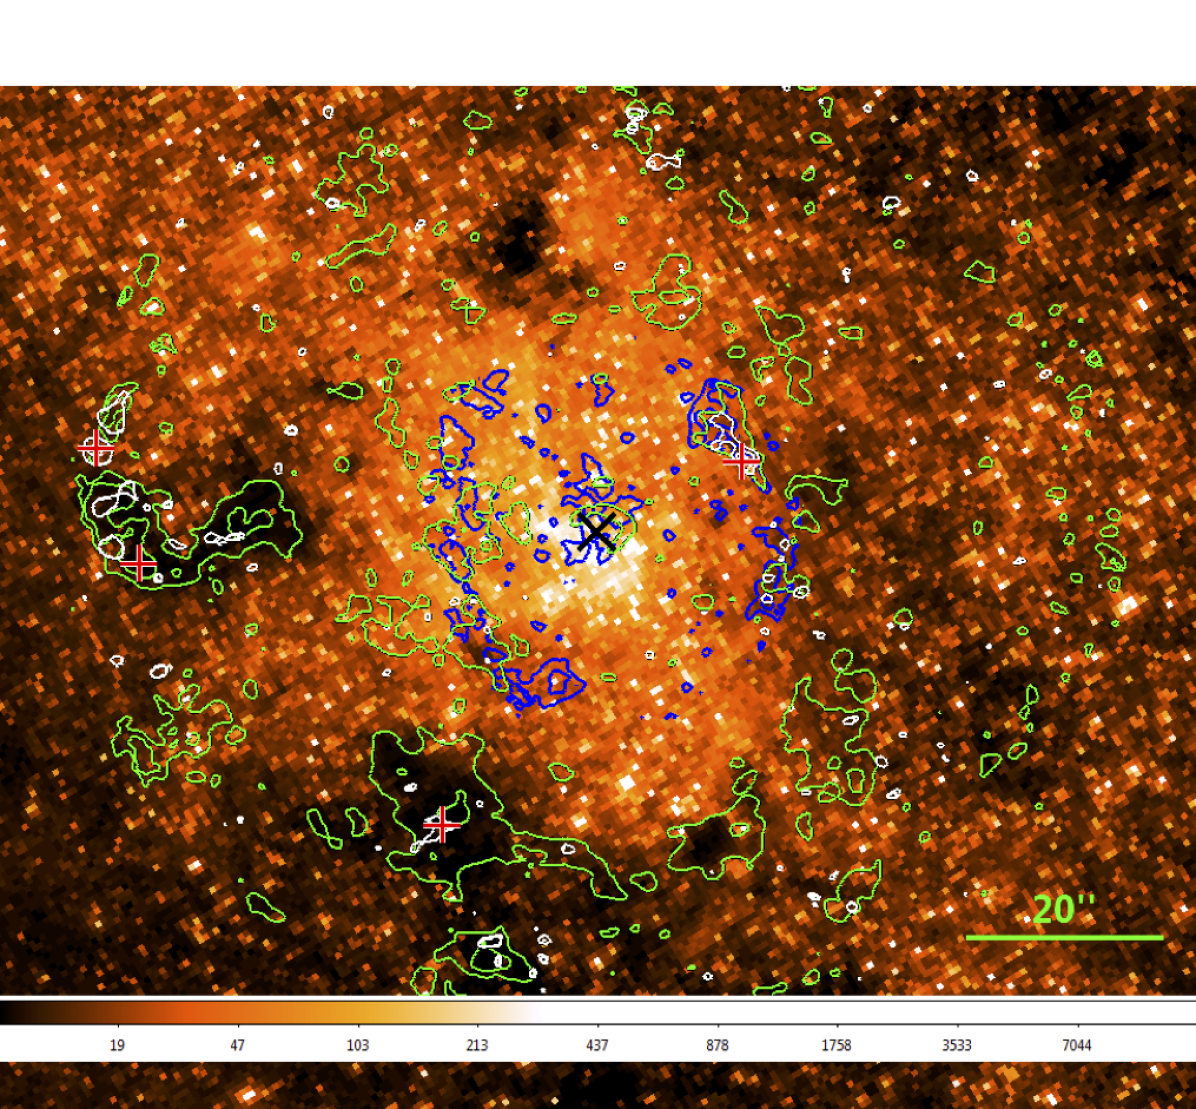
In [Moser et al. (2014)], we reported the detection of N2H+ and CH3OH in the prominent infrared-dark clouds (IRDCs) east of the CND. The high resolution of this ALMA data set shows how closely the N2H+ outlines these IRDCs (Fig. 2). The presence of both, a tracer of cold ( K; [Vasyunina et al. 2012]), quiescent, dense gas and the high opaqueness in the IR, indicates suitable conditions for prestellar (cold) cores and earliest stages of star formation. This could be supported by the class I methanol maser (36 & 44 GHz; [Yusef-Zadeh et al. (2008), Sjouwerman et al. 2010, Pihlström et al. 2011]) in these regions (Fig. 2). However, the masers might rather be related to collisions between the giant molecular clouds (GMCs) in the east with the Sgr A East supernova remnant (SNR) shell as also the widespread SiO emission around these maser locations suggests (e.g. [Moser et al. (2014), Moser et al. 2014]).
References
- [Carroll & Goldsmith 1981] Carroll, T. J. & Goldsmith, P. F. 1981, ApJ, 245, 891
- [Christopher et al. (2005)] Christopher, M. H., Scoville, N. Z., Stolovy, S. R., & Yun, M. S. 2005, ApJ, 622, 346
- [Goto et al. (2014)] Goto, M., Geballe, T. R., Indriolo, N., et al. 2014, ApJ, 786, 96
- [Karlsson et al. (2015)] Karlsson, R., Sandqvist, A., Fathi, K., & Martín, S. 2015, A&A, 582, A118
- [Krabbe et al. 1995] Krabbe, A., Genzel, R., Eckart, A., Najarro, F. Lutz, D., et al. 1995, ApJL, 447, L95
- [Martín et al. 2012] Martín, S., Martín-Pintado, J., Montero-Castaño, M., et al. 2012, A&A, 539, A29
- [Mills et al. 2013] Mills, E. A. C., Güsten, R., Requena-Torres, M. A., et al. 2013, ApJ, 779, 47
- [Montero-Castaño et al. 2009] Montero-Castaño, M., Herrnstein, R. M., & Ho, P. T. P. 2009, ApJ, 695, 1477
- [Moser et al. (2014)] Moser, L., Eckart, A., Borkar, A., García-Marin, M., et al. 2014, IAUS, 303, 86
- [Moser et al. (2016)] Moser, L., Sánchez-Monge, Á., Eckart, A., et al. 2016, A&A, submitted
- [Pihlström et al. 2011] Pihlström, Y. M., Sjouwerman, L. O., & Fish, V. L. 2011, ApJL, 739, L21
- [Requena-Torres et al. 2012] Requena-Torres, M. A., Güsten, R., Weiß, A., et al. 2012, A&A, 542, L21
- [Schödel et al. 2002] Schödel, R., Ott, T., Genzel, R., Hofmann, R., et al. 2002, Nature, 419, 694
- [Sjouwerman et al. 2010] Sjouwerman, L. O., Pihlström, Y. M., & Fish, V. L. 2010, ApJL, 710, L111
- [Vasyunina et al. 2012] Vasyunina, T., Vasyunin, A. I., Herbst, E., & Linz, H. 2012, ApJ, 751, 105
- [Yusef-Zadeh et al. (2008)] Yusef-Zadeh, F., Braatz, J., Wardle, M., & Roberts, D. 2008, ApJL, 683, L147