Electric-field induced shape transition of nematic tactoids
Abstract
The occurrence of new textures of liquid crystals is an important factor in tuning their optical and photonics properties. Here, we show, both experimentally and by numerical computation, that under an electric field chitin tactoids (i.e. nematic droplets) can stretch to aspect ratios of more than , leading to a transition from a spindle-like to a cigar-like shape. We argue that the large extensions occur because the elastic contribution to the free energy is dominated by the anchoring. We demonstrate that the elongation involves hydrodynamic flow and is reversible, the tactoids return to their original shapes upon removing the field.
pacs:
Valid PACS appear hereI Introduction
When dispersed in a solvent, a wide variety of chemical and natural substances, from polypeptides to viral particles and intracellular actin filaments, spontaneously organise in liquid-crystalline nematic phases. The nematic phase usually appears within the disordered isotropic phase through the nucleation and growth of birefringent droplets, termed tactoids Zocher (1925).
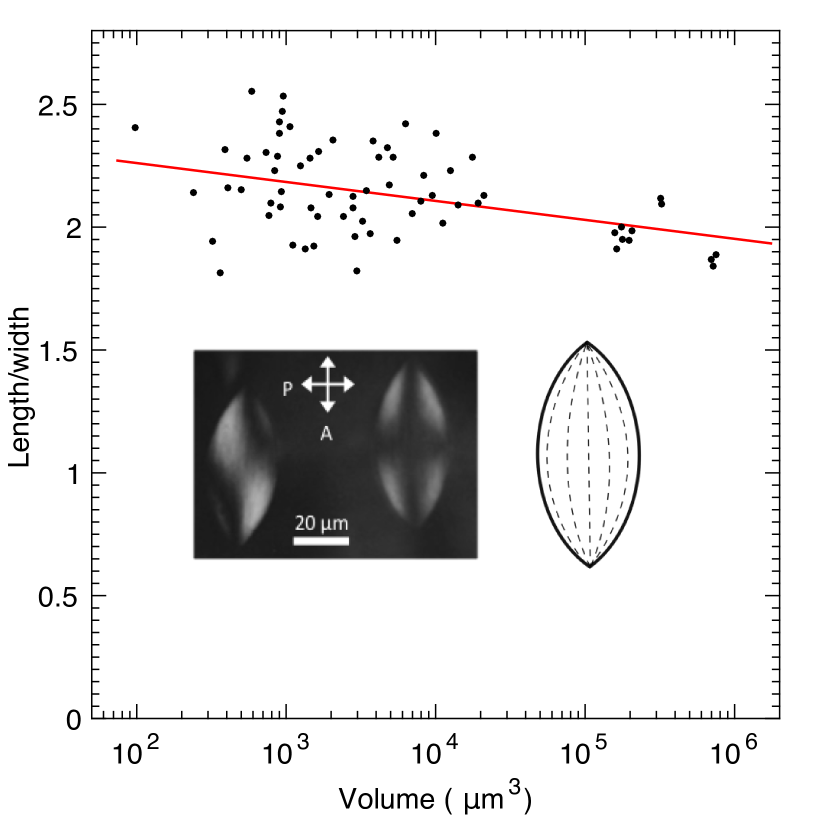
These nematic droplets have characteristic shapes that have already been the subject of several theoretical studies Kaznacheev et al. (2002); Prinsen and van der Schoot (2003); Lettinga et al. (2005, 2006); van Bijnen et al. (2012); Otten and van der Schoot (2012); Everts et al. (2016) and experiments on systems such as vanadium pentoxide (V2O5) Sonin (1998); Kaznacheev et al. (2002), carbon nanotubes Puech et al. (2010); Jamali et al. (2015), rod-like viruses Dogic (2003); Modlinska et al. (2015), F-actin in cells Oakes et al. (2007), chromonic liquid crystals Kim et al. (2013), and cellulose nano-crystals Revol et al. (1994); Park et al. (2014); Wang et al. (2016). These investigations showed that the typical tactoid shapes, for example the so-called spindle-like shape with a bipolar director field (see the right inset in Fig. 1), are determined by the balance between a low surface tension, strong anchoring, and the elasticity of these lyotropic nematics. Such distinctive shapes are not usually found in the case of thermotropic nematics that have very large surface tension, leading to almost spherical drops, even though the director field can be bipolar Volovik and Lavrentovich (1983).
Like most liquid crystals, tactoids are very sensitive to external magnetic or electric fields but only a few studies have so far dealt with this phenomenon. The most obvious effect of the field on a tactoid is usually the overall orientation of its long axis with respect to the field direction Kaznacheev et al. (2002). Subjecting tactoids of plate-like colloidal particles to sufficiently large magnetic fields induces a sudden rearrangement of the director field and leads to stable split-core defect structures Verhoeff et al. (2011), while tactoids of rod-like colloids can also be slightly stretched without qualitative change of the internal structure of the director field Kaznacheev et al. (2002).
Here we present experimental results to show that, for large electric fields, chitin tactoids with a bipolar director field can elongate to aspect ratios of more than , forming cigar-shaped droplets with a uniform director configuration except for at the tips. We find that the elongation process is entirely reversible upon removal of the electric field to recreate the original tactoid shapes. By comparing the experiments and numerical simulations we argue that the substantial elongations are the results of weak elasticity and strong anchoring.
II Materials and Methods
Chitin extracted and purified from crab shells was kindly provided by Katakura Chikkarin Co. Ltd. as a white flaky powder. Chitin flakes (1 g) were hydrolysed in a round flask with 20 mL 3 M HCl at the boil for 90 minutes and then quickly cooled down on ice. After thorough dialysis against deionised water until a pH of about 4 was reached, dispersion of the particles was achieved by sonication (using a Branson sonicator) for 30 minutes. Remaining aggregates were eliminated by low speed centrifugation. The suspensions were then concentrated by dialysis against a 50 gL-1 solution of PEG 35000 gmol-1 in water acidified with HCl (pH 4). Stock suspensions were brought to a concentration of about 10% in weight, measured precisely by evaporation and weighing. Final dilution was achieved by adding to the stock suspensions the appropriate amount (in weight) of the corresponding aqueous solvent. The chitin suspension had a concentration of circa 3 wt%, which corresponds to the biphasic isotropic-nematic region of the phase diagram, close to the isotropic border Belamie et al. (2004). Considering a density of 1.425 gcm-3 for chitin nanocrystals, the chitin volume fraction in the suspension is thus 0.02. This value represents the overall volume fraction of the suspension which actually demixes into coexisting isotropic and nematic phases, with respective volume fractions = 0.018 and = 0.028.
For electro-optical studies, samples were filled into optically flat glass capillaries (VitroCom) of thickness 200 m that were flame-sealed. Nematic tactoids form and slowly sediment over a few hours as the macroscopic isotropic-nematic phase separation proceeds. The response of the tactoids to the electric field was measured during sedimentation to avoid their interaction with the inner surfaces of the capillary.
The set-up used for the application of the electric field in the sample has been described in detail elsewhere Dozov et al. (2011). A high frequency (typically f = 300-700 kHz) sinusoidal a.c. voltage with amplitude U0 was applied to the suspension using two external electrodes made up from aluminium foil and placed directly on the outside wall of the capillary with inter-electrode gap Le = 1.06 mm. This geometry of the experiment enabled us to apply strong and uniform electric fields without direct contact of the electrodes with the suspension, avoiding electrolysis and other electrochemical artifacts and minimising the Joule heating of the sample. The r.m.s. value of the field penetrating in the sample is E = CC(f)E, where E = U0/(L) is the externally applied field, and the coefficients C 0.48 and 0 C(f) 1 take into account respectively the field attenuation due to the dielectric mismatch between the capillary glass wall and the suspension, and the screening of the field by the conductivity charges in the suspension. During the experiment, the sample was placed on the stage of a polarising microscope Olympus BX 51 and the evolution of the tactoids was observed and periodically photographed using a CCD camera for the measurement of their length L and diameter D as a function of the time and field strength. When possible, the evolution of each tactoid was followed individually from one photograph to the next one. Otherwise, for long times and/or strong fields, the follow-up was only statistical, because, in these conditions, the individual tracking was hindered by the convective flow due to the Joule heating of the sample.
Two distinct series of experiments were performed on similar batches of chitin aqueous suspensions. Qualitatively the results are similar, but in the first series the response to the field was stronger and saturated at lower frequency than in the second series. The frequency and the strength of the applied field were therefore set to slightly different values in the two experiments in order to maximise the response of the sample to the field and to minimise the Joule heating and the related convective flows. In the first series, the frequency of the applied voltage was f = 300 kHz (with C 1) and the maximum field strength was E = 160 Vmm-1; in the second series, the frequency was f = 700 kHz (with C 0.7) and the maximum field strength was E = 450 Vmm-1. The optimal frequency was determined in an auxiliary study of the field-induced nematic order in the isotropic phase of the same colloidal dispersion. The results were not influenced by the frequency variation when the frequency-dependent losses for penetration of the field in the sample were taken into account.
The frequency dependence of the screening coefficient C(f) was measured in the isotropic phase of the suspensions. From the same experiment, the nematic order parameter Dozov et al. (2011) induced by the maximum field of 450 Vmm-1 was estimated to be only S = 0.04, which confirms that the main effect of the electric field is to align the nematic director inside the tactoid, with only a minor perturbation of the isotropic fluid around it.
III Experimental Results
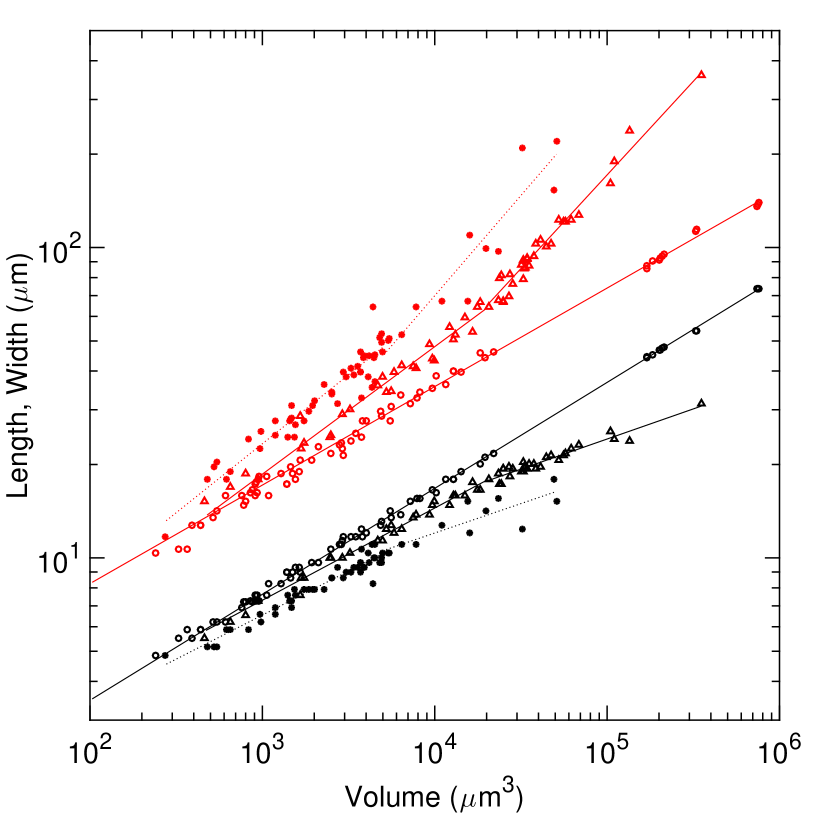
In the absence of any applied field, the tactoids that spontaneously form upon the isotropic-nematic transition have a spindle-like shape and bipolar morphology, independent of their size (see the insets in Fig. 1). They are randomly oriented throughout the sample. Moreover, their aspect ratio, L/D 2 where L is the length and D the diameter, is only weakly dependent on the volume (see Fig. 1). The interfacial anchoring and the surface tension scale with the surface area of the tactoids, while the elasticity scales with the volume. The constant aspect ratio observed here therefore suggests that the interfacial anchoring and the surface tension dominate in this system. We note that this is in contrast to previous works, where aspect ratios of tactoids were shown to decrease with increasing volume Bernal and Fankuchen (1941); Kaznacheev et al. (2002); Modlinska et al. (2015); Jamali et al. (2015), in reasonable agreement with theoretical predictions Kaznacheev et al. (2002, 2003); Prinsen and van der Schoot (2003); Jamali et al. (2015) for models where elasticity is relevant.
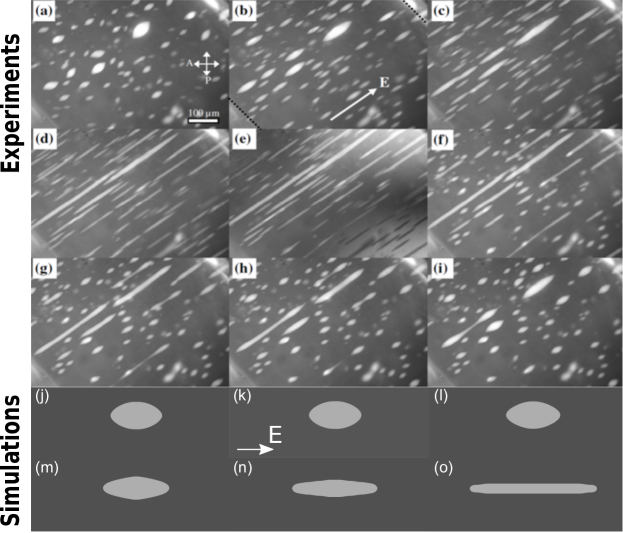
Before the first application of the field, the tactoids are completely disoriented. When the electric field is applied, a reorientation of the director along the field is observed inside the tactoid, except in the close vicinity of the nematic-isotropic interface. This purely elastic process is very fast (response times 1s) and is reversible upon field removal. At much longer time scales (10-100 seconds) the tactoids slowly reorient along the field, rotating approximately as rigid bodies. Simultaneously, but at even longer time scales (100-1000 seconds), the tactoids become distorted as their aspect ratio increases. Therefore, short pulses of electric field, separated by relaxation times, were first applied to orient all the tactoids along the electric field direction and avoid any distortion of their shape. A population of tactoids of very different volumes but of same shape and orientation was thus produced (Fig. 2a).
When submitted to an a.c. electric field of constant amplitude, the tactoids strongly deformed and became highly elongated along the field direction (Fig. 2b-e). With time, the largest tactoids evolved from the bipolar structure to a tubular shape with conical tips (Fig. 2d-e). In the simulations, described in more detail below, this behaviour is nicely recovered (see Fig. 2j-o). The deformation is reversible as the tactoids became bipolar again and their aspect ratio returned to its initial value in 103s after the electric field was switched off (Fig. 2f-i). This behaviour is significantly different from previous work on tactoids where the aspect ratio only increased by 10% under a 1T magnetic field and the tactoid structure remained strictly bipolar Sonin (1998); Kaznacheev et al. (2002, 2003).
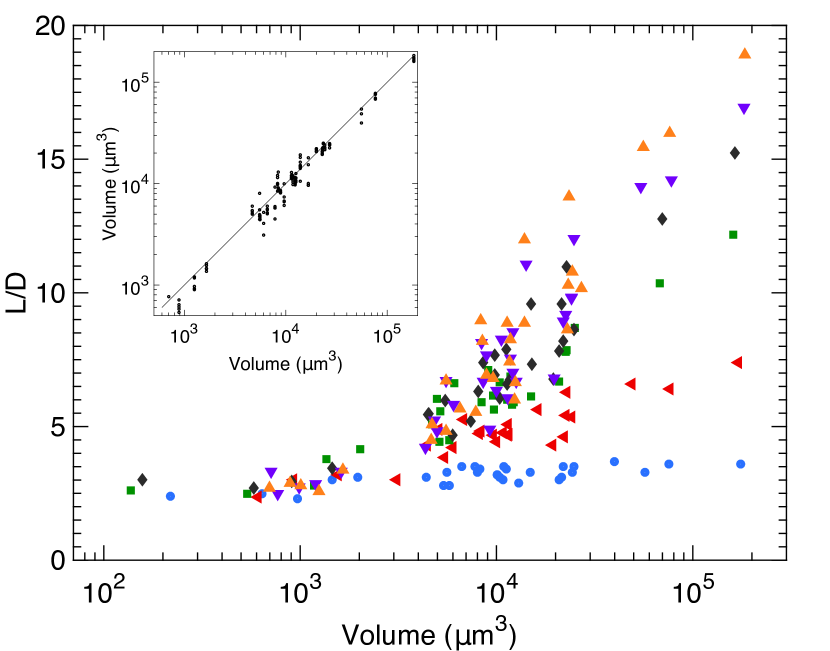
The deformation of the tactoids in the field strongly depends on their volume (see Fig. 3). For example, small tactoids of volume 102 - 103 m3 did not deform much on the time scale of the experiment (30 minutes), while the aspect ratio of large tactoids (105 m3) doubled in 5 minutes and reached L/D 15 in 30 minutes. The volume of the tactoids remained almost constant during the deformation process (see the inset in Fig. 3).
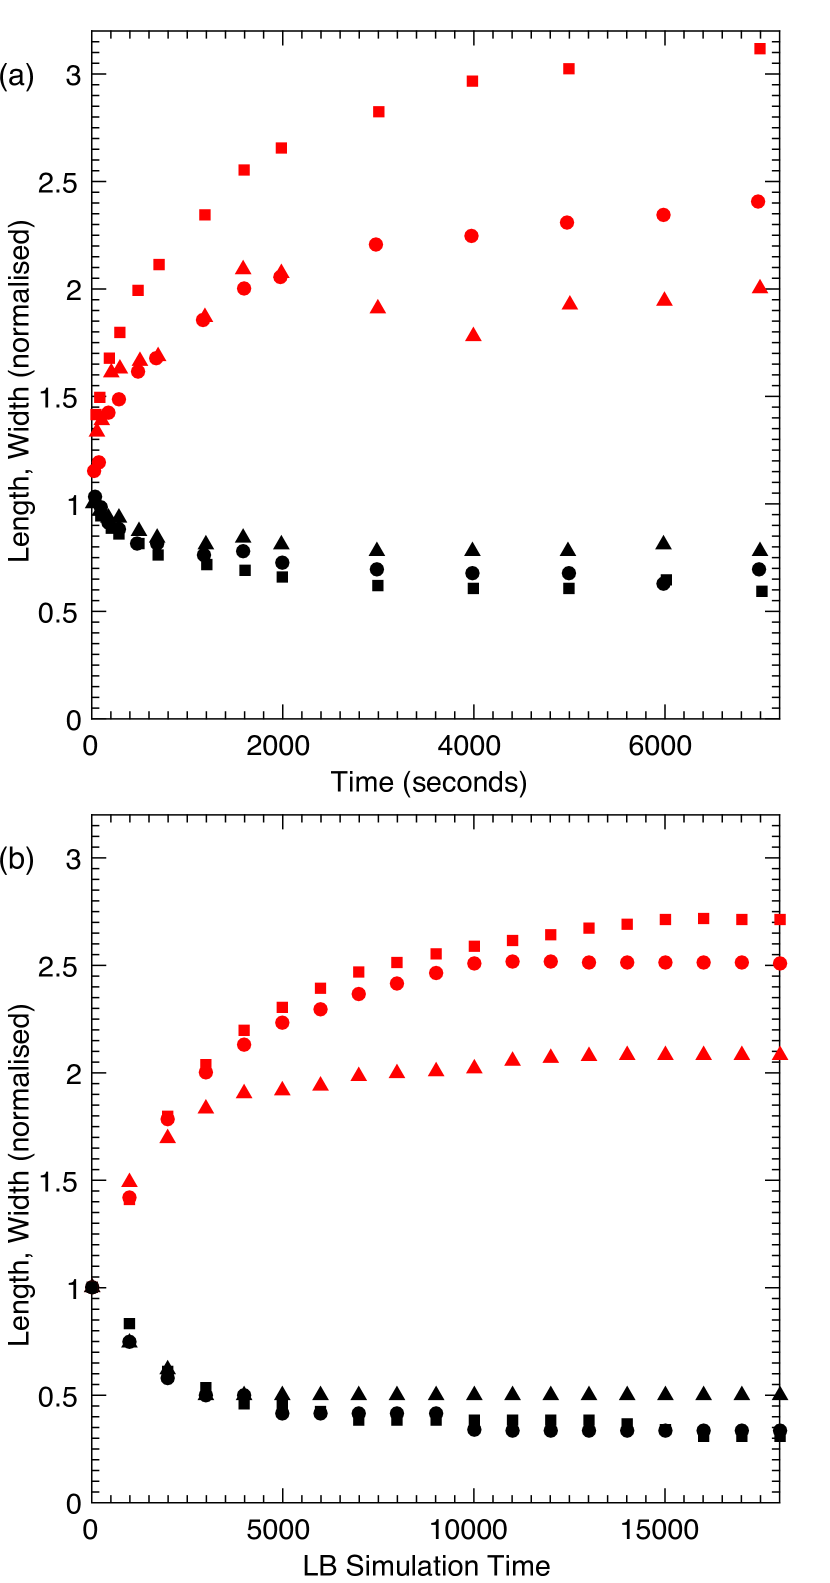
The evolution of the tactoid shapes when a field is applied is summarised in Fig. 4a which shows the time evolution of the tactoid length and diameter for different tactoid volumes. Small tactoids undergo small deformations but on the relatively fast time scale of a few hundred seconds. By contrast, the largest tactoids show very large deformations occurring on time scales of several thousands of seconds. The large time scale suggests that flows are involved in the deformation of large tactoids under the electric field. The same qualitative behaviour was observed for field amplitudes between 100 and 450 Vmm-1.
Without a field, the length and diameter of the tactoids scale with the cube root of their volume (see Fig. 5), which is expected because all tactoids have the same aspect ratio. Under the electric field, the tactoid diameter decreases with increasing tactoid volume, showing a crossover from a cube root behaviour to a weaker dependence as a function of volume. The value of the crossover volume, V, depends on the electric field amplitude; it is V 2x10⁴ m3 at E = 154 Vmm-1 and V 5x10³ m3 at E = 309 Vmm-1. There is a larger corresponding increase in the tactoid length leading to aspect ratios as high as 15. Moreover, we observed the qualitative change of the tactoid morphology from the usual spindle-like shape with bipolar structure to a tubular shape. This consists of an almost cylindrical central region with uniform director distribution ending with two conical tips with an approximately bipolar director field.
To our knowledge, these features have not been reported in any other system. For comparison, under a 1T magnetic field, large V2O5 tactoids are aligned along the field and are slightly elongated, with an aspect ratio increasing by only about 10%, without any change of their bipolar structure Kaznacheev et al. (2002). In a similar way, the axial ratio of lens-like tactoids formed by gibbsite platelets only slightly varies (by 30%) under a 1T magnetic field Verhoeff et al. (2011), in good agreement with theoretical models Verhoeff et al. (2011); Otten and van der Schoot (2012).
The action of the magnetic field is due to the coupling of the field with the magnetic anisotropy of the nematic phase; this effect can only be expected if (at least) one of the coexisting phases is anisotropic. This is no longer the case when an electric field is applied to biphasic systems. Apart from the direct coupling of the electric field with the dielectric anisotropy of the nematic phase, given by the energy term (E.n)2/2, where = - is the dielectric anisotropy, there are additional energy terms that are unrelated to the phase anisotropy. These terms are relevant even for coexisting isotropic phases. They are due to the different dielectric constant ( ) and conductivity (K K) inside and outside of the droplet interface. Under a field, electric charges accumulate on the interface, respectively as bound (polarisation) or mobile (conductivity) charges. Their surface density is anisotropic and depends on the orientation and shape of the droplet O’Konski and Thacher Jr (1953); O’Konski and Harris (1957); Melcher and Taylor (1969); Vizika and Saville (1992); Saville (1993). Therefore, an initially spherical isotropic droplet elongated under field, becomes ellipsoidal, and orients with its main axis along the field. This process minimises the electric energy cost at the price of increasing the interface area and the interface energy. This phenomenon is well known for isotropic droplets and, when the dielectric and/or conductivity contrast is large, a droplet elongation of 15% has been reported Vizika and Saville (1992).
The same mechanisms are involved in the electric-field-induced elongation of thermotropic nematic droplets in coexistence with their isotropic melt or with another liquid Park et al. (1994); Lev et al. (2000, 2001); Auernhammer et al. (2009). Usually for thermotropic nematics, the surface tension is much larger than the anchoring energy and the droplets are (approximately) spherical without a field. Under a field, the nematic director in the droplet is aligned along the field (assuming that ) and the effective dielectric and conductivity contrasts at the interface are now respectively - and K∥-K. When these contrasts are strong and the surface tension of the nematic is relatively weak (as usual), the droplet aspect ratio can be quite large, up to 3, especially for low frequencies, f 1 kHz, where the conductivity mechanism is dominant Park et al. (1994); Lev et al. (2001). However, even in this case, the shape of the droplet is not spindle-like but ellipsoidal because, as in the isotropic case, there is only competition between the electric and surface tension energies, the anchoring energy being negligible. Yet, the flow induced by the friction drag exerted by the electric current in the liquid is an artifact that can induce cusp-like distortions of the droplet in d.c. or very low frequency a.c. fields Lev et al. (2001).
All these auxiliary mechanisms are irrelevant in our experiment. Indeed, working with external electrodes, without direct contact with the liquids, requires the use of very high frequencies to achieve enough penetration of the field in the liquid. We use frequencies much higher than the relaxation frequency of the conductivity (Maxwell-Wagner mechanism Wagner (1914)) so that this effect can be neglected. For the same reason, the flow directly induced by the electric current drag is also negligible. Moreover, the dielectric contrast - is very small ( ) in chitin suspensions and its influence on the tactoid shape is negligibly small.
The only remaining electric-field contribution to the tactoid energy is the direct coupling with the dielectric anisotropy of the nematic phase, like the magnetic field case. Nevertheless, for large tactoids, deformations were observed two orders of magnitude larger than reported for V2O5 in a magnetic field.
The most unexpected result is the field-induced transition from a spindle-like to a tubular shape for large tactoids. Theoretical models explain the spindle-like shape by the competition between the bend and splay elastic energies, the surface tension and the anchoring energy Kaznacheev et al. (2002); Prinsen and van der Schoot (2003); Kaznacheev et al. (2003). Under application of an external field the energy balance is modified, leading to variation of the tactoid aspect ratio. However, the models predict that the shape should remain spindle-like, as in the absence of field, contrary to our observations.
At least at a qualitative level, one does not expect significant differences in elastic properties and surface tension between chitin suspensions and other aqueous lyotropic colloids of rod-like particles. However, we argued above that the independence of the tactoid shape on its volume suggests that the elastic contribution to the free energy is small compared to the surface tension and anchoring contributions. Moreover close examination of the orientation of the director in the bulk and at the interface of the tubular tactoids in strong fields revealed that although the director orientation is completely uniform in the bulk (and parallel to the electric field), close to the tips the director remains strictly parallel to the surface and relaxes over a length of about 3 m. This demonstrates that the anchoring is actually very strong and any tilt of the director from the surface can be neglected at the droplet boundary, even in strong fields.
Since, at this stage, the physical origin of this novel shape remains unknown and since its description seems out of reach of the analytical models available to date, numerical simulations were employed. Moreover, the complex dynamical evolution of the tactoids in an electric field is difficult to model analytically but it can be captured by a numerical approach.
IV Numerical Simulations
In order to understand the nature of the shape change of the tactoids and to scrutinise the underpinning physical mechanism for their large elongation under electric fields, we employ a nematohydrodynamics approach. We use a hybrid lattice Boltzmann-finite difference method Doostmohammadi et al. (2016) to solve the equations of motion describing a mixture of a nematic liquid crystal with an isotropic fluid, and work in two dimensions. The symmetric traceless tensor Q is used to describe the nematic order of the fluid De Gennes and Prost (1995). The second order parameter used in the model is the liquid crystal concentration . The isotropic and nematic phases coexist, and the amount of each is conserved, as observed experimentally. The free energy of the system is
| (1) |
where
| (2) |
where , , , and are all positive constants. The first term in is the bulk free energy for a binary fluid, with equilibria at corresponding to the isotropic and nematic phases, respectively Orlandini et al. (1995). The second term describes a first-order, isotropic-nematic transition at Matsuyama et al. (2002). This contribution is weighted by , since only the nematic phase contributes in this way to the free energy. The third term is the Frank elastic free energy density. We use the one elastic constant approximation, corresponding to having the splay and bend Frank elastic constants equal. This approximation holds well since, as discussed earlier, and confirmed numerically, the weak dependence of the aspect ratio on the tactoid volume (Fig. 1) indicates that the tactoid formation is primarily controlled by the competition of the anchoring on the surface of the nematic droplet and the interfacial tension between the nematic and isotropic phases. The fourth term is the contribution from an electric field E, with the dielectric anisotropy. The fifth term penalises gradients in the concentration and provides an interfacial tension. The last term couples the concentration gradient to the liquid crystal orientation, modelling interfacial anchoring of the liquid crystal. encourages the director to align parallel to the isotropic–nematic interface (planar anchoring), whereas encourages perpendicular (homeotropic) anchoring Sulaiman et al. (2006). To reproduce the experimental results qualitatively, we choose =1.5, =0.28, =0.093, =1, =0.05 and =0.06.
The evolution of the order parameters and Q is dictated by the Cahn-Hilliard and Beris-Edwards equations respectively Cahn and Hilliard (1958),Beris and Edwards (1994),
| (3) |
| (4) |
where characterises the response of the nematic tensor to velocity gradients Beris and Edwards (1994). and are the symmetric and antisymmetric parts of the velocity gradient tensor , and is the tumbling parameter. is a rotational diffusivity and is the molecular field, modelling the relaxation towards a free energy minimum while remains traceless. In equation (3) is the mobility and is the chemical potential.
The velocity evolves according to the generalised Navier-Stokes equations
| (5) | ||||
| (6) |
where is the stress tensor. The stress consists of a viscous stress , an elastic stress , and a capillary stress , where is the fluid viscosity and is the bulk pressure. We use =0.5, =0.7, =0.7 and =0.25 to obtain qualitative agreement with the experiments.
The simulations are set up starting with a circular nematic droplet, with a uniform director field and with radius between 8 and 16 lattice units, situated on a 240 120 rectangular lattice. Before the electric field is turned on the droplet is equilibrated for 64000 time steps. It relaxes to a shape with sharp tips, an aspect ratio of about two, and a bipolar director field, recovering the characteristic properties of the experimentally observed tactoids (Fig. 2j). When the field is turned on, the tactoid becomes highly extended, taking on a cylindrical shape with conical tips as shown by the series of snapshots in Fig. 2k-o. This shape is in agreement with the experiments (Fig. 2e).
Simulation results for the time evolution of tactoids of different area are compared to experiment in Fig. 4, showing similar behaviour. When hydrodynamic flow was not included in the simulations it was not possible to regain the dynamics observed in the experiments, providing evidence that the long time-scales observed in the stretching of the larger tactoids are of hydrodynamic origin.
The experimental observation that the tactoid shape is independent of its volume suggests that the elastic contribution to the free energy balance is small compared to those from the surface tension and anchoring in the chitin system. For simulation parameters which reproduce the experimental results the free energy contributions due to anchoring and surface tension are similar, whereas that from the elasticity is about ten times lower in the zero field configuration.
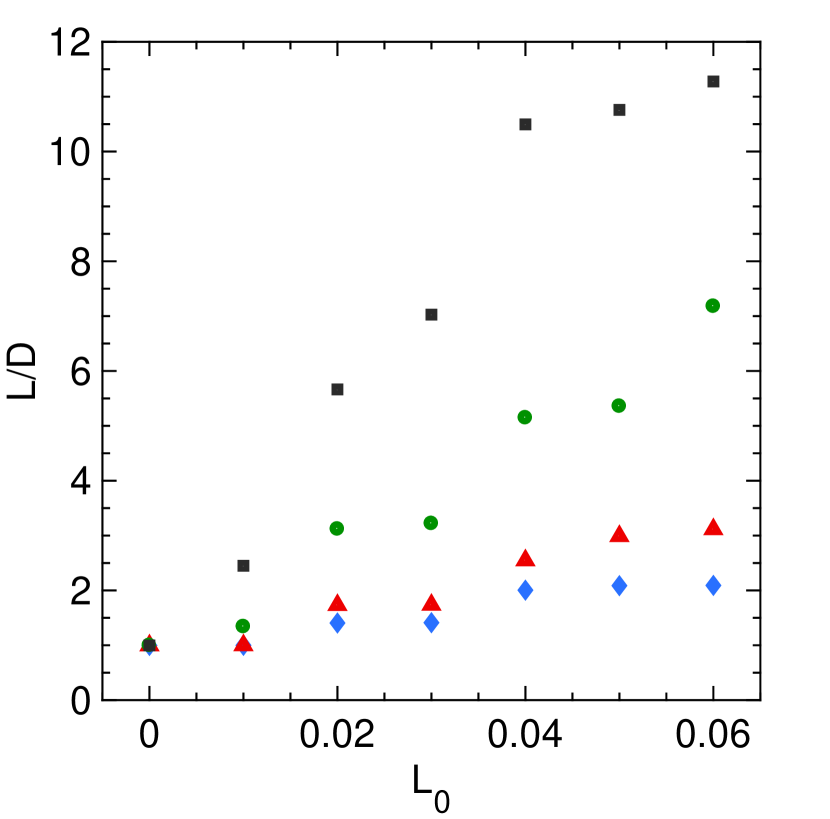
Having validated the simulations against the experiments we can use them to investigate how the final tactoid extension depends on the anchoring strength and the strength of the applied electric field. The results, shown in Fig. 6, show that the extension increases strongly with anchoring strength. In zero field tactoids with zero anchoring strength are round with a uniform director field and they are unperturbed by the field, as expected. For larger anchoring strengths (0.04 to 0.06 in simulation units) the tactoids become spindle-like with a bipolar director configuration in zero field. Applying an electric field leads to increases in the aspect ratio, of up to a few hundred percent for .
We saw no evidence of elongation at field strengths below 0.04 (in simulation units), independent of the tactoid volume, suggesting that there is a small energy barrier to the initiation of stretching. To check that this was not due to the lattice pinning the long, straight interface we repeated the calculations for spherical droplets and found the same qualitative behaviour. We hypothesise that the energy barrier occurs because the strongly anchored directors at the interface need a minimum field to be able to distort the interface so that they can align with the field direction. This is supported by the fact that the energy barrier decreases with decreasing anchoring.
V Summary
In summary, we have shown experimentally and by numerical simulations that the application of an electric field to nematic tactoids induces a transition from the common spindle-like shape with a bipolar director field to a cigar-like shape with an almost uniform director field. The drops extend in the direction of the field to reach aspect ratios of over ten. We argue that this is a consequence of the low elasticity and strong anchoring of the chitin tactoids.
From a practical point of view, subjecting tactoids to shear flow has been shown to improve the optical properties of liquid crystal films by enhancing the alignment of the particles Park et al. (2014), and using electric fields can achieve this same effect in a much more controllable environment. Indeed, when doped with acrylamide monomers, these biphasic aqueous chitin suspensions could easily be polymerised under electric field, as was recently demonstrated in the case of clay suspensions Paineau et al. (2012).
To further investigate the morphological properties of liquid crystals, and their tunability, it would be interesting to look at the coalescence of tactoids. In the experiments it was occasionally observed that tactoids may coalesce while elongating, to break up again during retraction. Since bigger tactoids react more strongly to an electric field, coalescence may be an important factor in improving alignment. Furthermore chitin tactoids offer an easily accessible confined liquid crystal environment for studying fundamental properties of liquid crystal solutions.
This project has received funding from the European Union’s Horizon 2020 research and innovation programme under the DiStruc Marie Skłodowska-Curie grant agreement No. 641839, the ERC Advanced Grant MiCE 291234, and the Agence Nationale pour la Recherche ANR (France) grant NASTAROD. We thank Paul van der Schoot and Pavlik Lettinga for helpful discussions.
References
- Zocher (1925) H. Zocher, Zeitschrift für Anorganische und Allgemeine Chemie 147, 91 (1925).
- Kaznacheev et al. (2002) A. V. Kaznacheev, M. M. Bogdanov, and S. A. Taraskin, J. Exp. Theor. Phys. 95, 57 (2002).
- Prinsen and van der Schoot (2003) P. Prinsen and P. van der Schoot, Phys. Rev. E 68, 021701 (2003).
- Lettinga et al. (2005) M. P. Lettinga, K. Kang, A. Imhof, D. Derks, and J. K. G. Dhont, J. Phys. Condens. Matter 17, S3609 (2005).
- Lettinga et al. (2006) M. P. Lettinga, K. Kang, P. Holmqvist, A. Imhof, D. Derks, and J. K. G. Dhont, Phys. Rev. E 73, 011412 (2006).
- van Bijnen et al. (2012) R. M. W. van Bijnen, R. H. J. Otten, and P. van der Schoot, Phys. Rev. E 86, 051703 (2012).
- Otten and van der Schoot (2012) R. H. J. Otten and P. van der Schoot, J. Chem. Phys. 137, 154901 (2012).
- Everts et al. (2016) J. Everts, M. Punter, S. Samin, P. van der Schoot, and R. van Roij, J. Chem. Phys. 144, 194901 (2016).
- Sonin (1998) A. S. Sonin, J. Mater. Chem. 8, 2557 (1998).
- Puech et al. (2010) N. Puech, E. Grelet, P. Poulin, C. Blanc, and P. van der Schoot, Phys. Rev. E 82, 020702 (2010).
- Jamali et al. (2015) V. Jamali, N. Behabtu, B. Senyuk, J. A. Lee, I. I. Smalyukh, P. van der Schoot, and M. Pasquali, Phys. Rev. E 91, 042507 (2015).
- Dogic (2003) Z. Dogic, Phys. Rev. Lett. 91, 165701 (2003).
- Modlinska et al. (2015) A. Modlinska, A. M. Alsayed, and T. Gibaud, Nat. Sci. Rec. 5, 18 (2015).
- Oakes et al. (2007) P. W. Oakes, J. Viamontes, and J. X. Tang, Phys. Rev. E 75, 061902 (2007).
- Kim et al. (2013) Y.-K. Kim, S. V. Shiyanovskii, and O. D. Lavrentovich, J. Phys. Condens. Matter 25, 404202 (2013).
- Revol et al. (1994) J.-F. Revol, L. Godbout, X.-M. Dong, D. G. Gray, H. Chanzy, and G. Maret, Liq. Cryst. 16, 1 (1994).
- Park et al. (2014) J. H. Park, J. Noh, C. Schutz, G. Salazar-Alvarez, G. Scalia, L. Bergstrom, and J. P. F. Lagerwall, Chem. Phys. Chem. 15, 1477 (2014).
- Wang et al. (2016) P.-X. Wang, W. Y. Hamad, and M. J. MacLachlan, Nat. Commun. 7, 11515 (2016).
- Volovik and Lavrentovich (1983) G. E. Volovik and O. D. Lavrentovich, Zh. Eksp. Teor. Fiz. 85, 6 (1983).
- Verhoeff et al. (2011) A. A. Verhoeff, R. H. J. Otten, P. van der Schoot, and H. N. W. Lekkerkerker, J. Chem. Phys. 134, 044904 (2011).
- Belamie et al. (2004) E. Belamie, P. Davidson, and M. M. Giraud-Guille, J. Phys. Chem. B 108, 39 (2004).
- Dozov et al. (2011) I. Dozov, E. Paineau, P. Davidson, K. Antonova, C. Baravian, I. Bihannic, and L. J. Michot, J. Phys. Chem. B 115, 24 (2011).
- Bernal and Fankuchen (1941) J. Bernal and I. Fankuchen, J. Gen. Physiol. 25, 1 (1941).
- Kaznacheev et al. (2003) A. Kaznacheev, M. Bogdanov, and A. Sonin, J. Exp. Theor. Phys. 97, 1159 (2003).
- O’Konski and Thacher Jr (1953) C. T. O’Konski and H. C. Thacher Jr, J. Phys. Chem. 57, 9 (1953).
- O’Konski and Harris (1957) C. T. O’Konski and F. E. Harris, J. Phys. Chem. 61, 9 (1957).
- Melcher and Taylor (1969) J. Melcher and G. Taylor, Annu. Rev. Fluid Mech. 1, 1 (1969).
- Vizika and Saville (1992) O. Vizika and D. Saville, J. Fluid Mech. 239, 1 (1992).
- Saville (1993) D. Saville, Phys. Rev. Lett. 71, 2907 (1993).
- Park et al. (1994) C. S. Park, N. A. Clark, and R. D. Noble, Phys. Rev. Lett. 72, 1838 (1994).
- Lev et al. (2000) B. Lev, V. Nazarenko, A. Nych, and P. Tomchuk, JETP Lett. 71, 6 (2000).
- Lev et al. (2001) B. Lev, V. Nazarenko, A. Nych, D. Schur, P. Tomchuk, J. Yamamoto, and H. Yokoyama, Phys. Rev. E 64, 021706 (2001).
- Auernhammer et al. (2009) G. K. Auernhammer, J. Zhao, B. Ullrich, and D. Vollmer, Eur. Phys. J. E 30, 4 (2009).
- Wagner (1914) K. W. Wagner, Archiv für Elektrotechnik 2, 371 (1914).
- Doostmohammadi et al. (2016) A. Doostmohammadi, S. P. Thampi, and J. M. Yeomans, Phys. Rev. Lett. 117, 048102 (2016).
- De Gennes and Prost (1995) P. De Gennes and J. Prost, The Physics of Liquid Crystals, 2nd ed. (Oxford University Press, Oxford, 1995).
- Orlandini et al. (1995) E. Orlandini, M. R. Swift, and J. M. Yeomans, Europhys. Lett. 32, 463 (1995).
- Matsuyama et al. (2002) A. Matsuyama, R. M. L. Evans, and M. E. Cates, Eur. Phys. J. E 9, 1 (2002).
- Sulaiman et al. (2006) N. Sulaiman, D. Marenduzzo, and J. M. Yeomans, Phys. Rev. E 74, 041708 (2006).
- Cahn and Hilliard (1958) J. W. Cahn and J. E. Hilliard, J. Chem. Phys. 28, 258 (1958).
- Beris and Edwards (1994) A. Beris and B. Edwards, Thermodynamics of Flowing Systems (Oxford University Press, Oxford, 1994).
- Paineau et al. (2012) E. Paineau, I. Dozov, I. Bihannic, C. Baravian, M.-E. M. Krapf, A.-M. Philippe, S. Rouzière, L. J. Michot, and P. Davidson, ACS Appl. Mater. Interfaces 4, 8 (2012).