An Analysis of Human-Centered Geolocation
Abstract
Online social networks contain a constantly increasing amount of images - most of them focusing on people. Due to cultural and climate factors, fashion trends and physical appearance of individuals differ from city to city. In this paper we investigate to what extent such cues can be exploited in order to infer the geographic location, i.e. the city, where a picture was taken. We conduct a user study, as well as an evaluation of automatic methods based on convolutional neural networks. Experiments on the Fashion 144k and a Pinterest-based dataset show that the automatic methods succeed at this task to a reasonable extent. As a matter of fact, our empirical results suggest that automatic methods can surpass human performance by a large margin. Further inspection of the trained models shows that human-centered characteristics, like clothing style, physical features, and accessories, are informative for the task at hand. Moreover, it reveals that also contextual features, e.g. wall type, natural environment, etc., are taken into account by the automatic methods.
1 Introduction
The increasing amount of low-cost camera-capable devices released on the market and the popularity of online social networks have produced an almost exponential increase in the amount of visual data uploaded to the Web. A large subset of this data consists of “human-centered images”, i.e. images whose content is mostly focused on a single individual. A side effect of this human-centered characteristic is that the amount of background information is reduced, thus, limiting the possibilities of inferring the location where the image was taken in a direct manner, i.e. by recognizing the place. Two questions then arise: Is it still possible to geolocate the image?, and if so, what are the useful visual cues for this task?.
Here we start from the hypothesis that cultural and climate factors have an influence on the fashion trends and physical appearance of individuals of different countries. For example, individuals from tropical locations are more likely to have a tanned skin color than those living in polar regions. As to their clothing, people near the poles are more likely to wear warm clothing than individuals living near the Equator. Likewise, people at seaside towns may dress differently than those in dense urban areas. We investigate to what extent such cues can be exploited to predict the geographic location, i.e. the city, where a picture was taken.
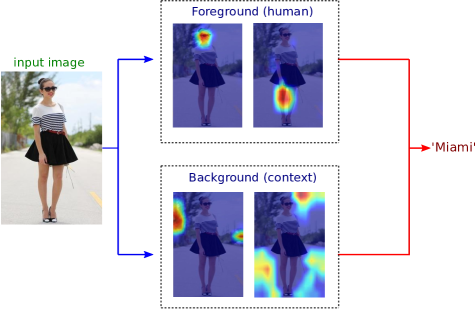
We formulate the geolocation problem as a classification task where the city names are the classes to be inferred from human-centered images. Firstly, we let people guess, serving as a baseline, providing an idea about human performance, and illustrating the difficulty of the task. Secondly, we conduct a series of experiments with automatic classification methods based on Convolutional Neural Networks (ConvNet). Finally, we analyze the origin of the visual features learned by the ConvNet-based methods (Fig. 1). More specifically, we verify whether the learned features are focused on the foreground (human-region) or the background (context). Our automatic methods surpass human performance by a large margin for this task. Moreover, our analysis suggests that human-centered features are being used. In addition, despite their less dominant nature, contextual features, e.g. wall type, natural environment, etc., are taken into account by the automatic methods.
Being able to geolocate human-centered images is not just of academic interest. Knowing the relation between geographic location and clothing is of commercial importance as well. For example, online shops can leverage this type of information to provide geography-based recommendations. Likewise, multinational retailers can use it to decide which type of products to put on their shelves.
The main contributions of this paper are two-fold:
-
•
Our extensive experiments provide significant empirical evidence of the feasibility of geolocalization from human-centered images. To the best of our knowledge this is the first work addressing the visual geolocalization problem from a human-centered perspective.
-
•
In addition to reporting quantitative performance of several automatic methods, we propose an inspection method in order to identify the origin of the features learned by the network.
This paper is organized as follows: in Section 2 we position our work w.r.t. earlier work. Section 3 presents the methodology followed in our analysis. In Sections 4 & 5, we conduct a series of experiments and discuss the observations and findings made throughout our evaluation. Finally, in Section 6, we draw conclusions from the analysis.
2 Related Work
We position our work w.r.t. related work on the topics of photo geolocation, fashion analysis, and inspection of ConvNets.
Photo geolocation Photo-based geolocation has been studied from different perspectives. Some authors focus on landmarks of cities [1, 17, 31], some on street view images [5, 10, 29], and some on arbitrary photos [8, 9, 26]. These contributions can be divided into two groups: a first coming from retrieval [1, 5, 8, 9, 24], and a second from classification [26]. We treat our problem as a classification task and employ a ConvNet instead of handcrafted features. Differently from [26], we predict city-related classes instead of discrete GPS coordinates. Moreover, we target human-centered photos.
Fashion analysis Simo-Serra et al. [20] exploit a large amount of data from chictopia.com, a large social network for fashion style sharing. Based on user posts and tags, they train a model to predict how fashionable a person looks from a photo and suggest a way to dress better. Similarly, Bossard et al. [3] train a random forest to classify the clothing style of people in natural images. Murillo et al. [16] and Wang et al. [25] predict a person’s occupation based on the clothing cues and contexts from a photo. Wang et al. apply hand-crafted features to represent human body parts. Using sparse coding [13, 28], they learn representative patterns for each occupation. Similar to us, they consider foreground and background information for the classification.
Inspecting ConvNets ConvNets have been shown to be powerful tools for feature representation. However, without further analysis they remain somewhat of a black box. Simonyan et al. [21] tackled this problem by finding the images that activate specific ConvNet nodes. Similarly, Zeiler et al. [30] proposed a DeconvNet-based network to visualize activations. Later, Springenberg et al. [22] introduced a new variant of DeconvNet-based approach called guided backpropagation for feature visualization. Compared with the DeconvNet, the guided backpropagation provides a sharper and cleaner visualization for higher layers of the network. [32] proposes a weighted sum over the spatial locations of the activations of the filters from the last convolutional layer to generate an activation map. Finally, a heatmap is generated by upsampling the activation map to the size of the input image. Similarly, [2] proposed to exhaustively match the internal upsampled activations of every filter from the convolutional layers against a dataset with pixel-wise annotated concepts in order to measure interpretability. Similar to [2, 32], we use upsampled activations from the last convolutional layer as means to identify the features that the network has learned. Moreover, we exploit the spatial information encoded in this layer in order to verify whether the features considered by the network come from the persons in the images or from the background.
3 Methodology
As said earlier, we formulate the geolocation problem as a classification problem, with the goal of assigning to a given image a city class label, from a fixed set of cities . Following the landmark work of [11], we address this problem through Convolutional Neural Networks (ConvNets). In the following sections we describe several ConvNet-based image classification schemes.
3.1 Image Classification with ConvNets
A deep ConvNet is a powerful mechanism for learning representations. Standard ConvNet architectures are usually composed of a set of feed-forward operations, with convolutional layers followed by fully connected layers. The first convolutional layers capture some basic features like color, gradient strength, edge orientation, etc., while the fully connected layers extract more abstract, complex semantic features [18]. In addition, [18] indicates that ConvNet extracted features outperform hand-crafted ones.
We investigate three methods to geolocate our images automatically. To this end we evaluate three ConvNets variants [4, 11] as described below. We focus on the case when the available data is not sufficient to train a deep ConvNet from scratch.
3.1.1 Pre-trained ConvNet + SVM (Pretrained+SVM)
This method is inspired by [6]. The main idea is that given an input image and a pre-trained ConvNet , when is pushed through , every layer of produces an activation response. The activations at a specific layer(s) are regarded as the features of an input image, . Then, having a set of image - label pairs , we extract the features from each image. Using the feature - label pairs , we train a multiclass classifier , i.e. a Multiclass Support Vector Machine (SVM), used at test time to predict the class label .
Following this methodology, the pre-trained network becomes a feature extraction mechanism, on top of which a SVM classifier is used to assign city labels to human-centered images. Hence, .
3.1.2 Fine-tuning a pre-trained ConvNet (Finetuned)
A deep neural network has millions of parameters to tune, which means that it will need a huge dataset in order to set these parameters properly. For instance, for “VGG-F” [4] 138GB of image data were used for training, 6.3GB of image data for validation and 13GB of image data for testing.
Fine-tuning is an alternative for situations when a large dataset is not available to train a network from scratch. Moreover, it has already been proved to yield a better performance than when training a network from scratch with insufficient data [12]. It follows the same architecture as the pre-trained model , but changes the last layers to satisfy the new classification task, thus producing a new network . Different from the previous method, given an image , we focus on the output of (over the set of classes of interest) as the predicted class label .
3.1.3 Fine-tuned ConvNet + SVM (Finetuned+SVM)
This method is a combination of the previous two methods. It follows a similar procedure as Pretrained+SVM, i.e. the class labels are predicted as . However, different from Pretrained+SVM, here we replace by its fine-tunned counterpart (Finetuned) and use activation responses from as features. Hence, .
3.2 Inspecting Features Learned by the Network
One of the main strengths of deep models is their ability to learn features that produce high performance for a task of interest. This is achieved by iteratively modeling abstract concepts through ensembles of simpler ones. Looking at these simpler concepts, i.e. internal activations, can provide an insight on the visual features that the deep model is taking into account when making predictions. Further processing of these internal activations will allow us to reach some understanding of what the model is actually looking at when classifying our human-centered images. To this end, we analyze the proportion of activations within the image region depicting the persons. The objective is to identify whether the features considered during the prediction come from either the foreground, i.e. the person depicted in the image, or the background, i.e. the context. Towards this objective, we compute the proportion between the feature response within the bounding box around the person with respect to the response on the whole image. Then we estimate the probability density function per filter. We expect that features correlated with the persons will have higher proportion than those in the context.
As discussed in Section 2, there are two families of methods that can be followed in order to visualize the strength of internal activations. On the one hand, methods based on DeconvNets [7, 21, 22, 30] generate heatmaps by backpropagating the activations on given layer-filter location back to the input image space. These methods produce detailed pixel-level visualizations at the cost of additional computations. On the other hand, methods based on upsampled activation maps [2, 32] generate relatively coarser visualizations with the advantange of only requiring a relatively simpler additional upsampling operation. Based on these observations, we follow the line of work from [2, 32] and generate “heatmaps” of internal features by upsampling the activations of every filter in the last convolutional layer. More specifically, we focus on the activation maps produced after the Rectifier Linear Unit (ReLU) operation. Then, from these heatmaps we compute the proportion of activations within the region around the person depicted in the image.
4 Evaluation
In the following section we present the protocol followed to investigate the problem at hand. Then, we present two directions to address this problem, i.e. a user study (Section 4.1) and a series of experiments based on automatic methods (Sections 4.2, 4.3, 4.4 & 4.5). We conclude this section with a deeper inspection of the features learned by the networks (Section 4.6).
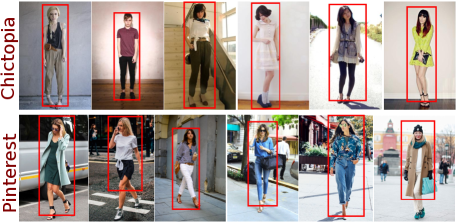
Datasets: We use three different datasets in our experiments. The first one is the Fashion 144k dataset [20] which contains 144,169 images posted from the largest fashion website chictopia.com. These images are ”human-centered”: a photograph of the person who posted it wearing an outfit, with an outdoor or indoor background. There are 3,443 different photographing locations but the number of photographs of each location varies considerably: some locations like Los Angeles have thousands of posts while most locations only contain less than 100 images. To keep the data balanced, we chose 12 different locations with more than 1,000 images. This produced a dataset composed by 12,448 images covering 12 city classes, i.e. ’LA’, ’London’, ’Madrid’, ’Melbourne’, ’Miami’, ’Montreal’, ’Moscow’, ’North Europe region’, ’NYC’, ’Paris’, ’San Francisco’ and ’Vancouver’. The second and third datasets are quite similar. We collected them ourselves from chictopia.com and pinterest.com. Both contain the same 12 locations, with 13,332 and 12,671 images in total, respectively. In terms of photographing style, Pinterest images represent ”instant” photos taken on the fly, while images from Chictopia are more planned, i.e. a user is posing (like a model) for the photo. See Figure 2 for some example images from these datasets. In addition, we define a Mix dataset that combines our two self-collected datasets (i.e. based on Chictopia ánd Pinterest).
We divide each dataset into three independent parts: 70% for training, 15% for validation and 15% for testing.
Performance metric: After training the classifiers, we evaluate their performance on the testing dataset. The mean accuracy for the 12 locations was calculated and we use this mean class accuracy (mCA) as the performance metric.
4.1 Exp.1: Human Performance Study
We start our evaluation by performing a study on how well people perform the task of geolocation from human-centered images. It will also provide an indication for the difficulty of the geolocation task.
We conducted a survey asking people to determine where a given photo was taken. We randomly select 24 images from each city from our self-collected datasets (Chictopia and Pinterest), producing a total of 288 images for our online questionnaire. Each time, one image is presented to the participant and the participant is asked to select one city from the list of 12 possibilities. In total, we received 6,505 responses from 153 participants with ages between 20 - 30, with an average of 23 votes given for every image. Among these responses, 3,258 are for the images from the Chictopia dataset while 3,247 are for the Pinterest dataset. In addition, we conducted an extended survey in which four participants were given access to annotated training images. We calculated the mean class accuracy (mCA) from those responses. The quantitative results can be found in Table 1. For reference, we present in Figure 3, the cumulative distribution of the accuracy obtained by the participants of the survey.
| Chictopia | Mix | ||
|---|---|---|---|
| Human | 11.60 | 12.29 | 11.94 |
| Human (extended) | 23.86 | 18.75 | 21.20 |
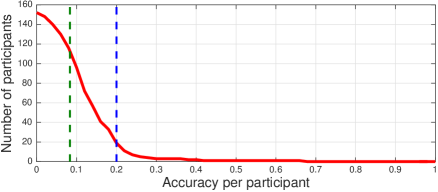
Discussion: Results from our survey suggest that performance between female and male participants is similar (0.39% difference) on the geolocation task. From Table 1, we can see that for the initial survey, the human performance on Pinterest dataset is slightly higher than on Chictopia. The reason might be because the photos of Pinterest tend to offer a bit more background context. Users may gain more cues from the background to determine the geographic location. It is remarkable that, for this survey, on both datasets human performance is only slightly better than a random guess over 12 classes (8.33%). In addition, we notice that for the case of the extended survey, human performance increases to 0.21 mCA. This suggests that the task is difficult. This is further stressed by Figure 3 (blue line), where it is noticeable that more than of the participants obtained an accuracy below 0.2. Moreover, we can notice a very small number of participants reaching accuracy scores above 0.5.
4.2 Exp.2: Automatic Geolocation via ConvNets
In this section we evaluate the performance of the automatic methods presented in Section 3.1. We select ”VGG-F” [4] as architecture for the implementation of our automatic methods. VGG-F is a feed-forward 21-layer ConvNet with 15 convolutional layers, five fully connected layers and one softmax layer. For the case of Pretrained+SVM (Section 3.1.1), considering the activation from internal layers as a feature, we take the activations from the last fully connected layer (fc7) of a VGG-F network pretrained on ImageNet. This produces a feature vector with length 4,096 per image that we use to train a multiclass SVM. Cross-validation is adopted to get the best parameters for the SVM.
For the case of Finetuned (Section 3.1.2), the dimension of the output layer is modified to 12 instead of the original 1,000 in order to produce an output focused on our classes of interest. The weights of this last layer are initialized with random values from a Gaussian distribution. Additionally, two more dropout layers are added between fc6 and fc7 and between fc7 and fc8. We tested two fixed learning rates (1e-4 and 1e-5) and a range of adaptive rates (1e-8 to 1e-4) to find the best one. For the case of Finetuned+SVM (Section 3.1.3), we first fine-tune the network, as done for Finetuned, and use the fine-tuned network as feature extraction mechanism (Finetuned+SVM).
During training, for the case of our self-collected Chictopia and Pinterest datasets, we use the Mix dataset to train ConvNets/classifiers by adopting the above three methodologies and evaluate the ConvNets/classifiers on each of the subsets, i.e. Chictopia, Pinterest and the Mix dataset, respectively. For the case of the Fashion 144k dataset [20], we use the pre-defined image sets for training and testing. All our models111Publicly available at http://github.com/shadowwkl/An-Analysis-of-Human-centered-Geolocation are trained using the MatConvNet framework [23]. Table 2 shows the quantitative performances for this experiment.
| Chictopia | Mix | Fashion 144k | ||
|---|---|---|---|---|
| Pretrained+SVM | 33.97 | 25.22 | 29.94 | 37.16 |
| Finetuned | 40.75 | 28.13 | 34.75 | 39.15 |
| Finetuned+SVM | 35.45 | 24.25 | 30.26 | 35.60 |
| Human | 11.60 | 12.29 | 11.94 | – |
| Human (extended) | 23.86 | 18.75 | 20.92 | – |
Discussion: From Table 2, we can observe that the automatic methods perform the best on the Chictopia dataset. Moreover, their performance is substantially higher than human performance, and this seems to be a trend for all three datasets. On the Chictopia dataset, the automatic methods have a much higher mCA than human whose mCA is 21 percentage points (pp), for the extended survey. Finetuned has the best performance among the three automatic methods with its highest mCA 40.75%. Finetuned+SVM follows with 35.45% mCA while Pretrained+SVM has the lowest mCA (33.97%). Therefore, the features extracted from the fine-tuned model yield a better performance than the pre-trained model when using the same classification technique. Overall these results show that predicting the geographic location where the analyzed ”human-centered” photos are taken is - to some extent - possible.
4.3 Exp.3: Human-based Feature Pooling
In the previous experiment we followed an image-based feature pooling approach, i.e. features were extracted by considering the whole image as input. Since the context information from the background may serve as a strong cue for determining the geographic location, in this experiment we investigate to what extent the problem can be solved if we only pool features from the persons appearing in the images. Towards this objective, we apply the Faster R-CNN [19] detector to localize the person appearing in the picture (See Figure 2). After the detection, we clip the image according to the predicted bounding box and obtain image regions focusing on the individuals appearing on the images. These image regions will now serve as input to the network. We perform this process on every image from the Chictopia and Pinterest datasets. We refer to this procedure as human-based feature pooling.
Similar to Section 4.2, we evaluate the same three methods with the difference that we feed the image regions produced by the Faster R-CNN as inputs. The quantitative results of this experiment are shown in Table 3.
| Chictopia | Mix | Fashion 144k | ||
|---|---|---|---|---|
| Pretrained+SVM | 28.07 | 19.54 | 24.06 | 33.28 |
| Finetuned | 35.00 | 22.00 | 28.79 | 35.20 |
| Finetuned+SVM | 29.66 | 19.26 | 24.69 | 30.44 |
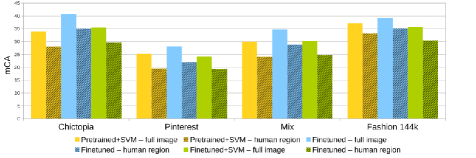
Discussion: From Table 3, we again see that Finetuned performs best on the Fashion 144k (35.20%) and Chictopia (35%) datasets, but also that the accuracy drops about four percent compared to Exp.2. By comparing the quantitative performance between human-based feature pooling and image-based feature pooling (Section 4.2), we can see a general trend of performance decrease by four to six percent (Figure 4). This shows that the context information does play a role in determining the final decision, but that it is not critical since the performance after removing most background information is still two times better than that of humans.
4.4 Exp.4: Classification vs. Retrieval -based Human-centered Geolocation
In its current form our Finetuned variant could be considered a simplified version of the classification-based method from [26] where instead of predicting discrete GPS coordinates our model predicts city classes. In order to provide some insight on the performance that retrieval-based methods can achieve on the geolocation of human-centered images, we evaluate an additional method following the retrieval-oriented IM2GPS approach proposed recently in [24]. In this case, all the examples from the training set are encoded using the Finetuned network and considered as reference data for k-Nearest Neighbors (k-NN) search within IM2GPS. In addition, since we do not predict GPS-related labels as output, we modify the output to produce a weighted vote of the class (city) labels corresponding to the retrieved k-NN examples from the reference set. We refer to this method as Deep-IM2GPS. We compare the performance of this Deep-IM2GPS variant w.r.t. our top performing classification-based method Finetuned. We report quantitative results in Figure 5.
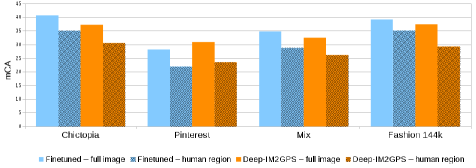
Discussion:
A quick inspection to Figure 5 reveals that classification-based methods are almost always better than their retrieval-based counterparts except for the case of the Pinterest dataset.
We hypothesize that this might be related to the fact that images from the Pinterest dataset have more contextual information and that retrieval-based methods might be better suited to exploit this type of feature.
In addition, we notice that also for Deep-IM2GPS it is still clear
the trend that classification performance is superior when using image-based
feature pooling (Section 4.2).
4.5 Exp.5: Considering a larger number of classes
In order to verify whether our observations hold when considering a larger number of classes, we consider the cities from the Fashion144K dataset [20] that have more than 100 images examples per class.
This leads us to a set of 70k images covering 164 cities (classes).
Based on the results obtained in the previous experiment, we take the top-performing automatic method, i.e. Image-based Feature Pooling with a Finetuned Network architecture.
In addition, we report performance for the retrieval-based method Deep-IM2GPS [24].
We present quantitative results in Table 4.
For completeness, we report performance on both geolocation methods, i.e. Finetuned and Deep-IM2GPS, when using image-based feature pooling (Image-bFP) and
human-based feature pooling (Human-bFP).
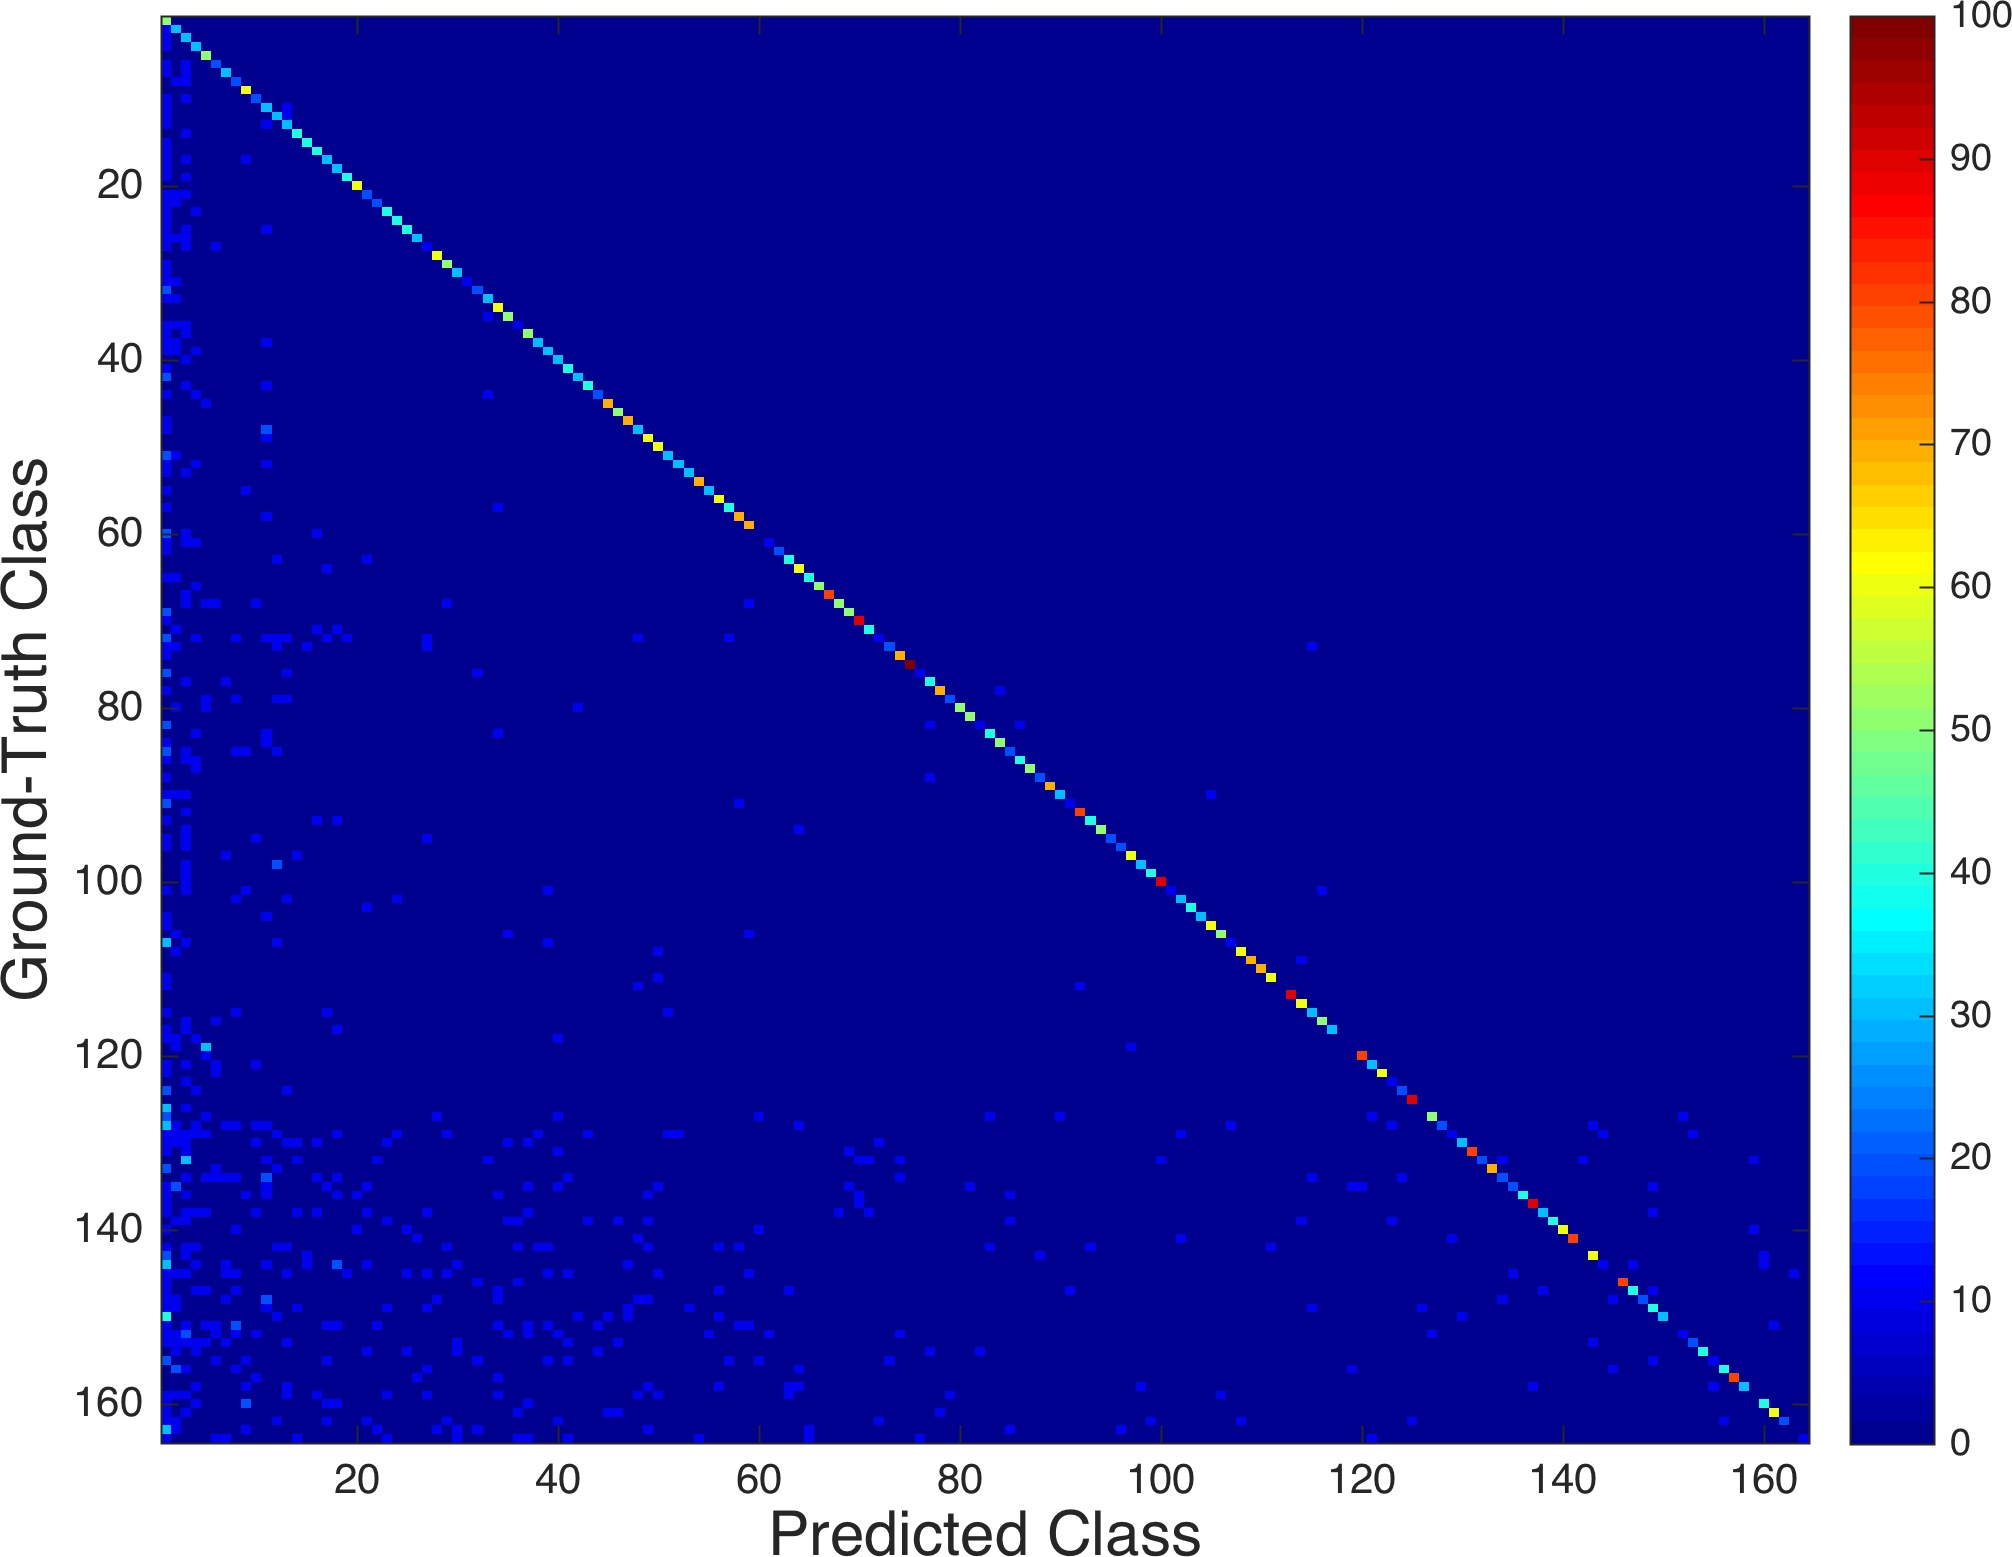
The confusion matrix of our Finetuned method is presented in Figure 6.
Classes are sorted by the number of examples they contain in decreasing order.
Discussion: For the case of the Finetuned method combined with image-based feature pooling, we notice a drop of 1% when compared with the experiment that considers 12 cities (Table 2). This low difference is somewhat surprising. A deeper inspection of the data revealed that as we go to classes with lower numbers of examples, i.e. more remote locations, the number of users uploading images from those locations is significantly smaller. Thus, even when additional classes are added, classifying these is a simpler problem. We can verify this in Figure 6 where classes with lower number of examples (larger class-id) seem to have superior performance. We notice that in this larger-scale experiment the classification-based method, Finetuned, still outperforms its retrieval-based counterpart, Deep-IM2GPS [24]. In addition, in this significantly more complex large-scale experiment the Human performance initially obtained for the 12-class experiment (Section 4.1) is expected to have a significant drop. Finally, the trend that image-based feature pooling (Image-bFP) provides superior performance over its human-based counterpart (Human-bFP) is still clear.
| Image-bFP | Human-bFP | |
|---|---|---|
| Finetuned | 38.26 | 35.16 |
| Deep-IM2GPS [24] | 33.49 | 24.88 |
4.6 Exp.6: Verifying the Origin of the Features Learned by the Network
In this experiment we further investigate the origin, i.e. foreground (human-region) or background (context), of the visual cues considered by the network. We take a deeper look at the visual patterns that the automatic models take into account when predicting geographic locations. More specifically, we focus on the network activations in the last convolutional layer from Finetuned trained on the Fashion 144k dataset based on image-based feature pooling (Section 4.2). In addition, following the procedure described in Section 3.2, we analyze the proportion of activations of the features within the bounding boxes predicted by the Faster R-CNN detector [19].
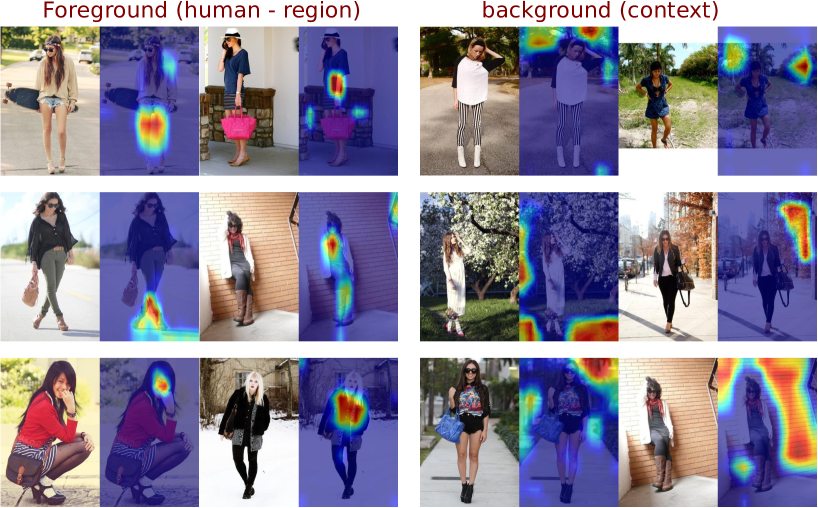
In Figure 8, we show the probability density of this proportion color coded in jet scale. For clarity, the features are sorted in the order of decreasing proportion from left to right along the x-axis. In the y-axis we indicate the proportion of activations occurring within bounding box. Finally, Figure 7 shows qualitative visualizations of the features considered by the last convolutional layer of the network grouped by their origin.
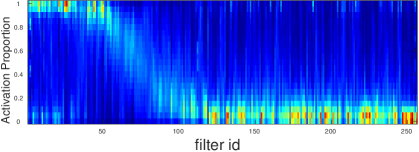
Discussion: Going back to the question of whether these relevant features lie on the background (context) or on the foreground (human-region), Figure 8 shows that these features are found grouped in two clusters. On the top-left corner, we can note a group of activations for filters that occur mostly in the foreground. We can notice group of features (filter id: 1-60) with more than 80% occurrence on the foreground. In the bottom-mid-right, we can see a spread-out group (filter id: 120-256). These are activations of filters that lie in the background. Finally, on the center (filter id: 60-100), we can notice a set of activations from filters that are almost equally shared between foreground and background. It is visible that these shared features have a lower intensity that those located either on the foreground (top-left) or in the background (bottom-right).
To complement the observations made previously, we qualitatively evaluate the features considered by the network in the last convolutional layer. In Figure 7 we visualize some of the upscaled activation maps from these features. We can notice that some features seem to be directly related to the individuals present in the image (Figure 7 (left)). For instance, for ’L.A.’ and ’Miami’, we see filters with strong activations near faces, arms, and uncovered knees/legs. This implies the fact that these two locations are relatively warmer. Likewise, we can notice that some other filters have strong activations related to clothing, some fire on jackets, scarfs, and nearby shoes. For instance, in ’Paris’ and ’Moscow’ beige and blue colors seem to be popular for clothing, respectively. In Figure 7 (right), we can clearly see that some of the learned features focus on aspects from the context. For instance, for ’Melbourne’ and ’North Europe’ green and white color features highlight vegetation and snow that appear in their respective landscapes. It is likely that there is a correlation between these features and the classes (cities) modelled by the network. This shows that indeed, there are some features on human-centered images that can be informative for geographic localization. In future work, we will take a deeper look and analyze where these relevant features come from, either from the physical characteristics of the persons or from the clothing they wear. In this regard, methods of clothing parsing/segmentation [14, 27] might be a possible direction to achieve ”clothing-based” feature pooling. Moreover, we will further investigate whether the scene type, i.e. indoors vs. outdoors, has an effect on automatic visual geolocation performance.
5 Discussion
In this paper we analyze the problem of geolocation from images by looking at the people therein. Our main objective is to analyze the task from this particular aspect of image content, but it stands to reason to do the same for e.g. buildings, vegetation, text, etc. that may be present, and then exploit whatever useful class that is available. We believe that such class-specific avenue will lead to improved results for a problem that is considered important (e.g. the subject of a DARPA research program). Given that this type of human-centered data has been rarely considered for geolocation - although it is quite instructive according to our results - our analysis at the same time produces a baseline to foster such work. The contribution of the paper does not lie in its technical novelty, and no claim to that effect was made. Further possible applications of the evaluated methods that were mentioned, will be examined as part of future work.
In Section 4.1, we conducted a Web survey and let people determine the location of a given image. Partcipants of the survey obtained a quite low mCA of 12% (Table 1). This reflects the difficulty of the problem when focusing on human-centered images, a good portion of which are indoors and/or provide arbitrary background information. The large disparity between human performance and the automatic methods can be attributed to the lack of training or expertise that the participants of the survey have when compared to the automatic methods. While the participants of the survey were asked to provide a guess on the location of an image, and in some cases had access to training images, the automatic methods had the advantage of observing several thousands of training images in advance. Moreover, when inspecting the confusion matrix computed from the results of the Web survey, we noticed that there were some cities that were usually confused, e.g. (’Miami’, ’LA’); (’Paris’, ’London’); (’North Europe’, ’Moscow’). This might be caused by a perceived similarity between these cities.
Perhaps, with a longer ”training” time for the surveyed participants human performance might be increased. However, given some of the similarities between some classes and the lack of popular landmark information, we expect this improvement to be insufficient to reach that of the automatic methods. A similar observation was reached in the user study conducted in [26]. Moreover, as observed in the user study conducted in [15], when performing visual geolocation, humans mostly rely on natural cues (e.g. sun position, animal types, natural landmarks, etc.) as well as man-made structures (e.g. architecture, road signs, traffic rules) which are significantly reduced in the human-centered images that are the focus of our analysis. It was observed that some mistakes were caused by erroneous preconceptions used by some participants. For instance, some participants of our Web survey mentioned that they were looking for a beach scene for the ’Miami’ class. Likewise, there was an expectation of finding snow in classes related to Canada, i.e. ’Montreal’ and ’Vancouver’. These initial preconceptions could bias the decision of the participants and affect the overall human performance given the fact that the occurrence of the mentioned cues are almost non-existent on the images of the mentioned classes. Please refer to [15] for a detailed description on human factors for visual geolocation.
6 Conclusion
We have investigated the problem of predicting the geographic location where a human-centered photo was taken. We have conducted an analysis of several aspects to this challenge. Our results suggest that it can be resolved successfully to some extent in an automatic fashion, which even surpasses human performance. A close inspection of the trained models shows that indeed, there are some human-centered characteristics, e.g. clothing style, physical features, accessories, which are informative for the task. Moreover, it reveals that, despite their apparent low occurrence, contextual features, e.g. wall type, natural environment, etc., are also taken into account by the automatic methods.
Acknowledgments: This work was partially supported by the KU Leuven PDM Grant PDM/16/131, the KU Leuven GOA project CAMETRON, and a NVIDIA Academic Hardware Grant.
References
- [1] Y. Avrithis, Y. Kalantidis, G. Tolias, and E. Spyrou. Retrieving landmark and non-landmark images from community photo collections. In ACM Multimedia, 2010.
- [2] D. Bau, B. Zhou, A. Khosla, A. Oliva, and A. Torralba. Network dissection: Quantifying interpretability of deep visual representations. In Computer Vision and Pattern Recognition (CVPR), 2017.
- [3] L. Bossard, M. Dantone, C. Leistner, C. Wengert, T. Quack, and L. V. Gool. Apparel classification with style. In Asian Conference on Computer Vision (ACCV), 2012.
- [4] K. Chatfield, K. Simonyan, A. Vedaldi, and A. Zisserman. Return of the devil in the details: delving deep into convolutional nets. In British Machine Vision Conference (BMVC), 2014.
- [5] D. M. Chen, G. Baatz, K. Köser, S. S. Tsai, R. Vedantham, T. Pylv’́an’́ainen, K. Roimela, X. Chen, J. Bach, M. Pollefeys, B. Girod, and R. Grzeszczuk. City-scale landmark identification on mobile devices. In Conference on Computer Vision and Pattern Recognition (CVPR), 2011.
- [6] J. Donahue, Y. Jia, O. Vinyals, J. Hoffman, N. Zhang, E. Tzeng, and T. Darrell. Decaf: a deep convolutional activation feature for generic visual recognition. In International Conference on Machine Learning (ICML), 2014.
- [7] F. Grün, C. Rupprecht, N. Navab, and F. Tombari. A taxonomy and library for visualizing learned features in convolutional neural networks. In International Conference on Machine Learning (ICML) Visualization for Deep Learning Workshop, 2016.
- [8] J. Hays and A. A. Efros. im2gps: estimating geographic information from a single image. In Conference on Computer Vision and Pattern Recognition (CVPR), 2008.
- [9] J. Hays and A. A. Efros. Large-scale image geolocalization, pages 41–62. Springer International Publishing, 2015.
- [10] H. J. Kim, E. Dunn, and J.-M. Frahm. Predicting good features for image geo-localization using per-bundle vlad. In International Conference on Computer Vision (ICCV), 2016.
- [11] A. Krizhevsky, I. Sutskever, and G. E. Hinton. Imagenet classification with deep convolutional neural networks. In Conference on Neural Information Processing Systems (NIPS), 2012.
- [12] T.-Y. Lin, Y. Cui, S. Belongie, and J. Hays. Learning deep representations for ground-to-aerial geolocalization. In Conference on Computer Vision and Pattern Recognition (CVPR), 2015.
- [13] H. Liu, M. Palatucci, and J. Zhang. Blockwise coordinate descent procedures for the multi-task lasso, with applications to neural semantic basis discovery. In International Conference on Machine Learning (ICML), 2009.
- [14] S. Liu, X. Liang, L. Liu, X. Shen, J. Yang, C. Xu, L. Lin, X. Cao, and S. Yan. Matching-cnn meets knn: quasi-parametric human parsing. In Conference on Computer Vision and Pattern Recognition (CVPR), 2015.
- [15] S. Mehta, C. North, and K. Luther. An exploratory study of human performance in image geolocation. In GroupSight workshop at Conference on Human Computation and Crowdsourcing (HCOMP) 2016, 2016.
- [16] A. C. Murillo, I. S. Kwak, L. Bourdev, D. Kriegman, and S. Belongie. Urban tribes: analyzing group photos from a social perspective. In Conference on Computer Vision and Pattern Recognition (CVPR) Workshop on Socially Intelligent Surveillance and Monitoring (SISM), 2012.
- [17] T. Quack, B. Leibe, and L. V. Gool. World-scale mining of objects and events from community photo collections. In Campus Information and Visitor Relations (CIVR), 2008.
- [18] A. S. Razavian, H. Azizpour, J. Sullivan, and S. Carlsson. CNN features off-the-shelf: an astounding baseline for recognition. arXiv:1403.6382, 2014.
- [19] S. Ren, K. He, R. B. Girshick, and J. Sun. Faster R-CNN: towards real-time object detection with region proposal networks. In Conference on Neural Information Processing Systems (NIPS), 2015.
- [20] E. Simo-Serra, S. Fidler, F. Moreno-Noguer, and R. Urtasun. Neuroaesthetics in fashion: modeling the perception of fashionability. In Conference on Computer Vision and Pattern Recognition (CVPR), 2015.
- [21] K. Simonyan, A. Vedaldi, and A. Zisserman. Deep inside convolutional networks: visualising image classification models and saliency maps. arXiv:1312.6034, 2013.
- [22] J. T. Springenberg, A. Dosovitskiy, T. Brox, and M. A. Riedmiller. Striving for simplicity: the all convolutional net. arXiv:1412.6806, 2014.
- [23] A. Vedaldi and K. Lenc. Matconvnet: Convolutional neural networks for matlab. In ACM Multimedia, 2015.
- [24] N. N. Vo, N. Jacobs, and J. Hays. Revisiting IM2GPS in the deep learning era. arXiv:1705.04838, 2017.
- [25] M. Wang, S. Yan, Z. Song, and X.-S. Hua. Predicting occupation via human clothing and contexts. In International Conference on Computer Vision (ICCV) 2011, 2011.
- [26] T. Weyand, I. Kostrikov, and J. Philbin. Planet - photo geolocation with convolutional neural networks. In European Conference on Computer Vision (ECCV), 2016.
- [27] K. Yamaguchi, H. Kiapour, L. E. Ortiz, and T. L. Berg. Parsing clothing in fashion photographs. In CVPR, 2012.
- [28] X. Yuan, X. Liu, and S. Yan. Visual classification with multitask joint sparse representation. IEEE Trans. Image Processing, 21(10):4349–4360, 2012.
- [29] A. R. Zamir and M. Shah. Image geo-localization based on multiple nearest neighbor feature matching using generalized graphs. IEEE Trans. Pattern Anal. Mach. Intell., 36(8):1546–1558, 2014.
- [30] M. D. Zeiler and R. Fergus. Visualizing and understanding convolutional networks. In European Conference on Computer Vision (ECCV), 2014.
- [31] Y.-T. Zheng, M. Zhao, Y. Song, H. Adam, U. Buddemeier, A. Bissacco, F. Brucher, T.-S. Chua, and H. Neven. Tour the world: building a web-scale landmark recognition engine. In Conference on Computer Vision and Pattern Recognition (CVPR), 2009.
- [32] B. Zhou, A. Khosla, L. A., A. Oliva, and A. Torralba. Learning Deep Features for Discriminative Localization. In Computer Vision and Pattern Recognition (CVPR), 2016.