11email: {jorgemendes,saraiva}@di.uminho.pt
Tabula: A Language to Model Spreadsheet Tables
Abstract
Spreadsheets provide a flexible and easy to use software development environment, but that leads to error proneness. Work has been done to prevent errors in spreadsheets, including using models to specify distinct parts of a spreadsheet as it is done with model-driven software development. Previous model languages for spreadsheets offer a limited expressiveness, and cannot model several features present in most real world spreadsheets.
In this paper, the modeling language Tabula is introduced. It extends previous spreadsheet models with features like type constraints and nested classes with repetitions. Tabula is not only more expressive than other models but it can also be extended with more features. Moreover, Tabula includes a bidirectional transformation engine that guarantees synchronization after an update either in the model or spreadsheet.
Keywords:
tabula, spreadsheet, model-driven engineering1 Introduction
The size and complexity of software has been quickly increasing in the last years. A paradigmatic example is the size of the software included in the aerospace industries: while the space shuttle developed in the 80’s contained about lines of source code111https://www.nasa.gov/mission_pages/shuttle/flyout/flyfeature_shuttlecomputers.html, the modern Airbus A380 built in this century includes more than millions lines of code [13]. In such large and complex systems it is unfeasible to reason about the software just by looking/understanding its source code [13].
Model-Driven Software Development (MDSD) has emerged as an important software engineering discipline allowing developers to reason about complex software by providing simple/concise abstractions - the software model. Very much like a civil engineer develops “human-scale” models of a bridge, before the real bridge is constructed, in MDSD a software engineer reason about his complex software by analyzing a simpler model.
Spreadsheets are no exception, and, indeed, they tend to evolve into large and complex software systems, which are difficult to understand, to maintain, and to evolve. The combination of complexity with the lack of abstraction mechanisms, is the main cause of the (too) many errors caused by spreadsheets [12, 11, 1].
Model-driven spreadsheet development was introduced in spreadsheets [9, 8, 7, 3] with two main goals: Firstly, to provide a powerful abstraction of the business logic of spreadsheets so that users can reason about their spreadsheets by analyzing simple models, instead of very large and complex data. Secondly, to provide a type system for spreadsheets: the model is incorporated into a regular spreadsheet so that it limits the data/formulas that can be defined in the spreadsheet cells. In such a model-driven spreadsheet engineering setting, the spreadsheet data (i.e., the instance) has always to conform to the spreadsheet model (i.e., the type), thus steering users in introducing correct data.
ClassSheets were introduced by Engels and Erwig as a powerful domain-specific modeling language for spreadsheets [7]. ClassSheets define both the computation and layout of spreadsheet tables. In previous work we have extended the ClassSheet formalism to improve its expressiveness [5]. Moreover, we conducted empirical studies using real-world model-driven spreadsheets that showed an improvement in users’ performance, while reducing the error rate [2]. This latter work also showed the limitations of (extended) ClassSheets: the business logic and layout of several real-world spreadsheets could not be modeled by a ClassSheet. In other cases, the ClassSheet model was not the natural way to express the layout/logic of the spreadsheet.
In this paper we present a new modeling language for spreadsheets tables: Tabula. This language is inspired by the ClassSheet modeling language, namely its visual notation, but it provides more expressive features like type constraints and nested classes with repetitions enabled by a different abstract representation. Moreover, Tabula includes a bidirectional transformation engine that guarantees synchronization after an update either in a Tabula model or spreadsheet. Much like our previous work on ClassSheets, the usage of model-driven spreadsheets targets repeated use of spreadsheets with a well-defined structure and logic. Tabulae are to be defined by a specialist in the domain with knowledge on modeling with Tabula, but usage of the respective spreadsheets targets usual spreadsheet users. We used the Tabula visual language to model a widely used budget spreadsheet that is provided by Microsoft as a budget template. Moreover, we also model the business logic of that spreadsheet using a ClassSheet model, and we compare the expressiveness of both spreadsheet modeling languages.
This paper is organized as follows: Section 2 gives a short introduction to model-driven spreadsheets and discusses the ClassSheet modeling language. Section 3 introduces in detail the Tabula modeling language and briefly describes its bidirectional transformation engine. In Section 4, we evaluate the expressiveness of Tabula when modeling a budget spreadsheet. We also compare the Tabula and the ClassSheet models for this spreadsheet instance. Finally, Section 5 includes our conclusions.
2 Model-Driven Spreadsheet Development
Before we propose a new modeling language for spreadsheets let us discuss in more detail the state of the art on model-driven spreadsheet engineering.
Several different approaches to use MDE in spreadsheets have been proposed in literature. The first model-driven spreadsheet specification language was Model Master [9]: an object-oriented textual specification of a spreadsheet that can be compiled into a concrete spreadsheet and also to be decompiled from a spreadsheet. It has a mathematical background, conceived from category theory concepts.
Spreadsheet templates [8] were the first approach to define a MDE spreadsheet language with a visual representation which allows to specify spreadsheets in a spreadsheet-like manner. On top of these spreadsheet templates, Engels and Erwig proposed ClassSheets [7]: a high-level, object-oriented formalism to specify the layout and business logic of spreadsheets. The visual representation of ClassSheets is close to what spreadsheets users are familiar with. ClassSheets are supported by their own application and then compiled to spreadsheets. As a result, model and instance are supported by different software systems, limiting the synchronization whenever one artifact (model or instance) evolves. In order to minimize this drawback, ClassSheets have been embedded in spreadsheet system [3, 2], bringing spreadsheet modeling closer to end users, and allowing model/instance co-evolution. Moreover, these embedded ClassSheets have been extended with additional features to improve their expressiveness [5].
To show the expressiveness of ClassSheets, and also their limitations, let us consider a simple spreadsheet to keep track of the inventory of products, as shown in Fig. 2. In its simplest form, the inventory is just a list of items. Each item defines the name of the product (column ) and the available quantity (column ). The last row contains the total of products: the sum of the quantities of listed products. Figure 2 contains the ClassSheet (in its visual notation [7]) that models the business logic and layout of this spreadsheet: it consists of a class, named Items, that includes two attributes (desc of type string, and stock of type number, with default values the empty string and , respectively). The total of products is defined by a formula that refers to attribute names (and not the usual column/row references). Finally, the layout is specified by the vertical dots, meaning that values of the above attributes can repeat vertically.
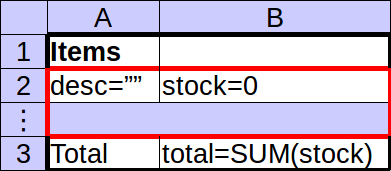
In the context of MDE we say that the spreadsheet instance presented in Fig. 2 conforms to the spreadsheet model in Fig. 2. We can also say that the spreadsheet data in Fig. 2 has type Items ClassSheet.
Let us consider now that we wish to distinguish different categories of products, namely, fruits and legumes. Figure 4 presents a possible spreadsheet that structures the inventory in this way. However, this new inventory spreadsheet is not easily specified using ClassSheets, because they do not support nested repetition of classes. Figure 4 contains a ClassSheet that does model the new inventory, but, as we can see, some of the data (the categories) must be defined at the model level. As a result, models tend to grow and resemble the instance, which limits the expressiveness of the approach: when a new product category has to be considered both the model and instance have to be updated!
| A | B | ||
|---|---|---|---|
| 1 | Inventory | ||
| 2 | |||
| 3 | Fruit | ||
| 4 | apple | 5 | |
| 5 | banana | 2 | |
| 6 | cherry | 8 | |
| 7 | |||
| 8 | Legumes | ||
| 9 | beans | 7 | |
| 10 | peas | 10 | |
| 11 | |||
| 12 | Total | =SUM(B4:B6,B9:B10) |
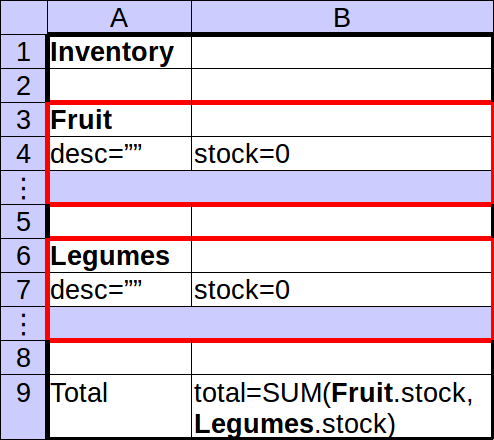
The key feature lacking in the ClassSheet modeling language is the possibility to define nested repeated classes/attributes. Thus, in ClassSheets, it is not possible to express the fact that we have categories of products that repeat vertically, each of which has a list of items (pairs of product name and quantity) that also repeat vertically.
Inventory category="" desc="" stock=0 : >=0 Total total=SUM(stock) Inventory Category Item
The inventory spreadsheet can be modeled using Tabula as shown in Fig. 5. In this case, categories can also be abstracted in the model and all the data is defined in the spreadsheet, only. A key advantage of Tabula over ClassSheets is the ability to describe nested repetitions. In our running example, it defines one for the category (as indicated by the downwards arrow on the left of the left brace) and a nested one for the category items is indicated by the other downwards arrow (on the right of the left brace). This feature is not only possible for vertical repetitions like in this example, but also for horizontal repetitions. Moreover, Tabula allows to define type constraints leading to a better characterization of the data the spreadsheet should hold, and, as a consequence it prevents user errors. In our example, the attribute stock has its values restricted to non-negative numbers. A detailed description of the Tabula modeling language is presented in the next section.
3 The Tabula Spreadsheet Modeling Language
A spreadsheet comprehends both the logic and the layout of a program. The Tabula modeling language specifies both of those elements, having a definition of the computation a spreadsheet has to perform, and how such computation is shown to users. Tabula include also a bidirectional evolution engine that guarantees model/instance synchronization after a transformation in one of these software artifacts. In the next section we define the Tabula modeling language. After that, we briefly describe the Tabula evolution engine.
3.1 Specification of Layout and Logic
A Tabula is defined as a type with a name, a list of classes and a grid. We express it in the Haskell programming language by the following abstract data type:
data Tabula = Tabula Name [Class] (Grid TCell)
Classes provide a meta-information about the cells in their range, while the grid defines the layout and contents of the spreadsheet. For that, classes are defined as
data Class = Class Name Range Expansion
The range of type Range is defined as the pair of its top-left coordinate and its
bottom-right one.
type Range = (Point, Point)
The expansion information, of type Expansion, defines if the class can expand
in any direction and thus have multiple objects in the instance.
data Expansion = None | Down | Right | Both
There are several options:
-
•
the class can only have a single object, called a singleton, and thus does not expand, defined by the value
None; -
•
the class can have multiple objects that repeat downwards, defined by the value
Down; -
•
the class can have multiple objects that repeat to the right, defined by the value
Right; and, -
•
the class can have multiple objects that repeat both to the right and downwards, defined by the value
Both.
The layout is presented by a grid, where each cell in the Tabula grid
represents one or more cells in the spreadsheet. There are three kinds
of Tabula cells, represented by the type TCell: input, formula and label.
An input cell is specified with the contents in the format “name=default”, where name is the name of the attribute it represents and default is the default value for the respective cells in the spreadsheet. This value is also used to define the type of the contents, where a numeric value implies the type being a number and a quoted text (possibly empty) implies the type being textual.
A formula cell is similar to an input cell. It is defined using the format “name=formula”, where name is the name of the attribute it represents and formula is the formula it defines. References in the formula are made using attribute names defined by input cells or by other formula cells.
A label cell is any cell that is neither of kind input nor formula. The content of the respective cells in the spreadsheet are exactly the same content as in the Tabula cell. In this kind of cells fall empty cells, numeric cells and any other textual cell.
The logic is as specified by the classes and the attributes defined in the grid. Each class in the Tabula represents a kind of object present in the spreadsheet, where the attributes are the ones in the grid contained in the class’ range.
The spreadsheet of our running example can be defined with a Tabula containing a two-by-six grid with two classes, where one class contains the list of items and another class contains each item:
inventory =
  Tabula  "Inventory"
          -- classes
          [  Class "Inventory"  ((0,0), (1,5))  None
          ,  Class "Category"   ((0,2), (1,4))  Down
          ,  Class "Item"       ((0,3), (1,3))  Down]
          -- grid
          (Grid.fromLists  [  ["Inventory", ""]
                           ,  ["",          ""]
                           ,  ["desc=\"\"", "stock=0 : >=0"]
                           ,  ["",          ""]
                           ,  ["Total",     "total=SUM(stock)"]])
A concise and graphical representation of this Tabula is presented in Fig. 5. It describes the grid in its tabular format and uses the background color to identify the classes each cell belongs to222We assume that colors are available in the electronic version of this document,. On the side there is a legend relating the color to the class since the name is not always present in the table: the class Inventory (in yellow) has a label in its top-left cell but the classes Category and Item (in green and blue, respectively) do not. Moreover, in some cases, the label can be different from the class name. The arrow pointing down on the left of the attribute desc indicates that the class Item expands down and the one on the left of the left brace indicates that the class Category also expands down, with the left brace removing any visual ambiguity that might arise about what is repeated.
The layout of a Tabula can also expand horizontally and the expansion area can contain multiple columns or rows. This configuration is displayed in Fig. 7, where the inventory for one item (apple) along the years is presented. Thus, a new class Year is created, containing the attributes year, stock and sold to represent the year an object refers to, the stock of the item at the end of the year and the number of items sold that year, respectively.
| A | B | C | D | E | F | ||
| 1 | Items | 2012 | 2013 | ||||
| 2 | stock | sold | stock | sold | Average sold | ||
| 3 | apple | 5 | 12 | 4 | 16 | =AVERAGE(C3,E3) |
Inventory year=2000 stock sold Average sold apple stock=0 sold=0 avg=AVERAGE(sold) Inventory Year
In Fig. 9, the conjugation of the configurations presented in Figs. 5 and 7 is shown, providing a more complex example. The result contains additional classes that relate the expandable classes from both of the previous examples. Thus, the Tabula contains the class Inventory from both examples, the class Item from Fig. 5 and the class Year from Fig. 9. Moreover, it contains two new classes to represent the attributes that are in the relation between:
-
•
Category and Year, named CategoryYear; and,
-
•
Item and CategoryYear, named ItemCategoryYear.
Both of these classes expand in both directions: horizontally and vertically. This Tabula is specified as follows:
inventoryYear =
  Tabula
    "InventoryYear"
    -- classes
    [  Class "Inventory"    ((0,0), (3,5))  None
    ,  Class "Year"         ((1,0), (2,5))  Right
    ,  Class "Category"     ((0,2), (3,4))  Down
    ,  Class "CategoryYear" ((1,2), (2,4))  Both
    ,  Class "Item"         ((0,3), (3,3))  Down
    ,  Class "ItemYear"     ((1,3), (2,3))  Both]
    -- grid
    (Grid.fromLists
      [["Inventory",  "year=2000",   "",           ""]
      ,["",           "",            "",           ""]
      ,["cat=\"\"",   "stock",       "sold",       "Average sold"]
      ,["desc=\"\"",  "stock=0:>=0", "sold=0:>=0", "avg=AVERAGE(sold)"]
      ,["",           "",            "",           ""]
      ,["Total",      "total=SUM(stock)", "",      ""]])
or graphically as in Fig. 9.
| A | B | C | D | E | F | ||
| 1 | Inventory | 2012 | 2013 | ||||
| 2 | |||||||
| 3 | Fruit | stock | sold | stock | sold | Average sold | |
| 4 | apple | 5 | 12 | 4 | 16 | =AVERAGE(C4,E4) | |
| 5 | banana | 2 | 10 | 3 | 12 | =AVERAGE(C5,E5) | |
| 6 | cherry | 8 | 9 | 1 | 3 | =AVERAGE(C6,E6) | |
| 7 | |||||||
| 8 | Legumes | stock | sold | stock | sold | Average sold | |
| 9 | beans | 7 | 5 | 9 | 7 | =AVERAGE(C9,E9) | |
| 10 | peas | 10 | 10 | 8 | 9 | =AVERAGE(C10,E10) | |
| 11 | |||||||
| 12 | Total |
=SUM(B4:B6,
B9:B10) |
=SUM(D4:D6,
D9:D10) |
Inventory
year=2000
cat=""
stock
sold
Average sold
desc=""
stock=0 : >=0
sold=0 : >=0
avg=AVERAGE(sold)
Total
total=SUM(stock)
Inventory
Category
Year
CategoryYear
Item
ItemCategoryYear
Classes are laid out in a layered fashion, where the class that is used by another is at a higher level than the one that uses it. Thus, classes are not broken down by other classes, but instead have parts of themselves covered by other classes. This characteristic is demonstrated in Fig. 10 with the ordering relation between the classes show in Fig. 11.
In order to have a valid model, some rules in laying the classes must be followed:
-
•
There must always be a base class with the size of the Tabula grid. In the running example, this base class is Inventory.
-
•
Inner classes must either use the whole height or the whole width of the class below. In the former case, the class is called a vertical class, possibly expanding to the right, and in the latter case the class is called an horizontal class, possibly expanding down. This rule prevents spreadsheet layout deformation when adding new instances of a class.
-
•
An horizontal class must leave a line above and another below of the class below. A vertical class must leave a column to the left and another one to the right of the class below. This rule prevents ambiguity in the layer order and allows for a simpler visual representation. Note that there is no need to leave space between two classes at the same level.
-
•
Two classes are allowed to intersect when one is contained by the other, i.e., the intersection area is the area of the contained class, or when a class is a vertical one and the other is an horizontal class.
-
•
When a vertical class intersects with an horizontal one, a relation class must use the intersection area.
-
•
Only relation classes can expand both to the right and down at once.
Note that this rules have a similar objective as the tiling rules for ClassSheets.
The notion of layers and class ordering is also used to define which class an attribute belongs to. Thus, an attribute belongs to the top-most class over that cell. The name resolution and translation to cell references in the instance works like in ClassSheets.
3.2 Model-Driven Spreadsheet Evolution
In a model-driven spreadsheet development environment, spreadsheet users can reason about large and complex data just by looking at the model. In this setting, spreadsheet users are not only able to edit/transform the instance (as in regular spreadsheet systems), but also to edit/transform the model. However, after a transformation in one of the software artifacts (model or instance), the model-driven environment has to guarantee their synchronization. That is to say, the instance has always to conform to the model, after every instance or model transformations.
In our previous work, model/instance co-evolution was applied to ClassSheets with a bidirectional transformation engine [4, 6] that is able to perform a change in the ClassSheet and then have the respective spreadsheet co-evolved correspondingly. Moreover, this transformation engine is also able to perform changes in the spreadsheet that possibly breaks conformance with the model, but that co-evolves the model in order to keep the conformance, and therefore the bidirectional capability.
We have adapted and improved such bidirectional transformation engine to guarantee synchronization after a Tabula or a spreadsheet instance evolution. The structure of the bidirectional transformation engine is shown in Fig. 12: the engine includes a set of transformation operations both on the model and on the instance . It also defines two mapping functions ( and ) between such operations, that convert transformations in the model to transformation in the instance and vice versa. These two functions guarantee the synchronization of model and instance: An operation on the model (instance) is transformed to operations in the instance (model), such that after applying the transformations in the model and instance the conformance relation is guaranteed.
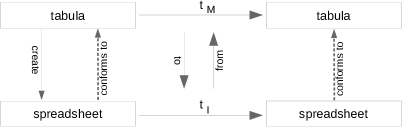
The arrow from a Tabula model to a spreadsheet instance means that from the model an initial instance can be generated, where the model serves as a type system. Thus, when editing the generated instance, end users are forced to conform to the model. That is to say that they have to define spreadsheet data/value with that specific Tabula type.
In this paper we omit the definition of this bidirectional engine. Such definition is provided in [10].
4 Tabula With Real-World Spreadsheets
In order to assess the expressiveness of Tabula, when compared to the
ClassSheet model, let us consider a widely used spreadsheet for a
personal budget provided by Microsoft333Basic personal budget spreadsheet
available at:
https://templates.office.com/en-us/Basic-personal-budget-TM16400272.
The Microsoft budget spreadsheet template has 14 columns and 91 rows, which users can reuse and edit by adding more data (rows) to the spreadsheet. Column-wise, the first one contains labels for each row, the twelve next columns contain the data for the twelve months of a year, and the last one contains the total for the year for each item. Row-wise, the spreadsheet has a title, then a header for the columns, a set of rows for the income, and then sets of rows for the expenses, grouped into categories (home, daily living, transportation, entertainment, health, vacations, recreation, dues/subscriptions, personal, financial obligations and misc. payments). The categories have 5 items in average.
In fact, this spreadsheet was used in an empirical study [2] to evaluate the performance of spreadsheet users when using model-driven spreadsheets. In that study the business logic of the budget spreadsheet was modeled by a ClassSheet. ClassSheets, however, could not capture the essence of the spreadsheet, resulting in a large and hard to understand and maintain model. A fragment of this ClassSheet model is shown in Fig. 13.
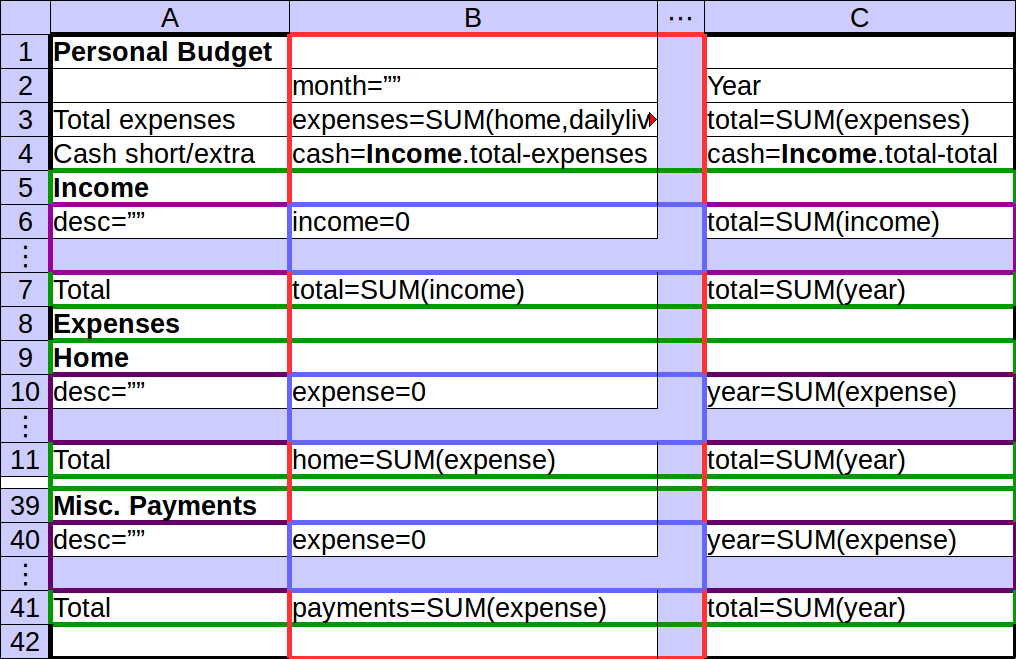
Because nested repetitions are not supported by ClassSheets, the model of the spreadsheet has to contain the concrete type of expenses (11 in total). This result in a visual ClassSheet that has 14 columns and 42 rows, Moreover, the formulas have also to refer to a large number of unique attributes, making their definition more complex and prone to errors. Finally, users cannot extend the categories of the expenses in the spreadsheet, only. A change in the model is needed, too.
In comparison, the Tabula model presented in Fig. 14 for the same spreadsheet can model the different kinds of expenses and thus be more concise than the ClassSheet model. Moreover, there are no explicit reference to specific type of expenses (like, for example, Home and MiscPayments in the ClassSheet model). Finally, the Tabula also define constraints on types, like specification that only positive numbers can be added as expenses. The Tabula has the same number of columns (14), as the template is not dynamic in that axis, but has only 12 rows, describing the kinds of expenses in one expandable class.
Personal Budget
month=""
Year
Total Expenses
total=SUM(Expense.total)
total=SUM(Expense.total)
Cash short/extra
cash=Income.total-total
cash=Income.total-total
Income
desc=""
income=0 : >=0
year=SUM(income)
Total
total=SUM(income)
total=SUM(year)
Expenses
cat=""
stock
Average sold
desc=""
stock=0 : >=0
avg=AVERAGE(sold)
Total
total=SUM(expense)
total=SUM(year)
Budget
Month
Income
IncomeItem
IncomeMonth
IncomeItemMonth
Expense
ExpenseItem
ExpenseMonth
ExpenseItemMonth
A summary of the differences between both models is presented in Table 1, which for each entry contains the number of rows, columns, classes, attributes, input cells and formulas.
| width | height | classes | attributes | input | formulas | |
|---|---|---|---|---|---|---|
| personal budget | 14 | 91 | - | 988 | 744 | 244 |
| Tabula | 14 | 12 | 5 | 81 | 27 | 54 |
| ClassSheet | 14 | 42 | 25 | 350 | 156 | 194 |
| Tabula (dyn.) | 3 | 12 | 10 | 16 | 6 | 10 |
| ClassSheet (dyn.) | 3 | 42 | 38 | 65 | 25 | 40 |
The first entry in this table is the personal budget (as obtained from the link provided above). The second and fourth entry contains two Tabula models for this personal budget where the first model specifies the twelve months, and the second the months are defined via a repetition (this is the Tabula in Fig. 14). The third and fifth entries contains the metrics of the ClassSheet models for the personal budget (with the twelve months defined or with repetitions as shown in Fig. 13). As we can see in this table Tabula is 20%–26% smaller than the equivalent ClassSheet in terms of the number of classes and attributes.
5 Conclusion
In this paper we present the tabula language to model spreadsheet tables. Tabula was inspired by previous work on model-driven engineering, namely by the (visual) ClassSheet language, but it provides more flexibility and expressive power to model real-world spreadsheets.
We have modeled a real personal budget spreadsheet, and we have compared the ClassSheet and Tabula models. Our preliminary results show that Tabula is able to model such spreadsheet in a natural way, as opposed to ClassSheets.
Tabula defines a kind of type system for spreadsheets. As future work we intend to extend this type language such that it is possible to specify more precisely the type of values a spreadsheet cell may contain (for example, a cell may contain units like seconds, inches, etc.). This will prevent a larger set of errors in spreadsheets, e.g., by preventing operations with incompatible units.
5.0.1 Acknowledgments.
This work is financed by the ERDF – European Regional Development Fund through the Operational Programme for Competitiveness and Internationalisation - COMPETE 2020 Programme and by National Funds through the Portuguese funding agency, FCT - Fundação para a Ciência e a Tecnologia within project POCI-01-0145-FEDER-016718, by the bilateral project FCT/DAAD with ref. 441.00, and by a PhD scholarship from FCT with ref. SFRH/BD/112651/2015.
References
- [1] Coy, P.: FAQ: Reinhart, Rogoff, and the Excel Error That Changed History. Bloomberg: http://www.bloomberg.com/news/articles/2013-04-18/faq-reinhart-rogoff-and-the-excel-error-that-changed-history (2013 April)
- [2] Cunha, J., Fernandes, J.P., Mendes, J., Saraiva, J.: Embedding, evolution, and validation of model-driven spreadsheets. IEEE Transactions on Software Engineering 41(3), 241–263 (March 2015)
- [3] Cunha, J., Mendes, J., Saraiva, J., Fernandes, J.P.: Embedding and evolution of spreadsheet models in spreadsheet systems. In: 2011 IEEE Symposium on Visual Languages and Human-Centric Computing (VL/HCC). pp. 179–186 (Sept 2011)
- [4] Cunha, J., Fernandes, J.P., Mendes, J., Pacheco, H., Saraiva, J.: Bidirectional transformation of model-driven spreadsheets. In: Hu, Z., de Lara, J. (eds.) Theory and Practice of Model Transformations. Lecture Notes in Computer Science, vol. 7307, pp. 105–120. Springer (2012)
- [5] Cunha, J., Fernandes, J.P., Mendes, J., Saraiva, J.: Extension and implementation of classsheet models. In: Proceedings of the 2012 IEEE Symposium on Visual Languages and Human-Centric Computing. pp. 19–22. VLHCC ’12, IEEE Computer Society (2012)
- [6] Cunha, J., Fernandes, J.P., Mendes, J., Saraiva, J.: MDSheet: A Framework for Model-driven Spreadsheet Engineering. In: Proceedings of the 34rd International Conference on Software Engineering. pp. 1395–1398. ICSE’12, ACM (2012)
- [7] Engels, G., Erwig, M.: Classsheets: Automatic generation of spreadsheet applications from object-oriented specifications. In: Proceedings of the 20th IEEE/ACM International Conference on Automated Software Engineering. pp. 124–133. ASE ’05, ACM (2005)
- [8] Erwig, M., Abraham, R., Cooperstein, I., Kollmansberger, S.: Automatic generation and maintenance of correct spreadsheets. In: Proceedings of the 27th International Conference on Software Engineering. pp. 136–145. ICSE ’05, ACM (2005)
- [9] Ireson-Paine, J.: Model Master: an object-oriented spreadsheet front-end. Computer-Aided Learning using Technology in Economies and Business Education (1997)
- [10] Mendes, J.: Evolution of Model-Driven Spreadsheets in a Collaborative Environment. Ph.D. thesis, Universidade do minho, Portugal (to appear) (2017)
- [11] Panko, R.: Facing the problem of spreadsheet errors. Decision Line, 37(5) (2006)
- [12] Panko, R.: Spreadsheet errors: What we know. what we think we can do. EuSpRIG (2000)
- [13] Wiels, V., Delmas, R., Doose, D., Garoche, P., Cazin, J., Durrieu, G.: Formal Verification of Critical Aerospace Software. AerospaceLab (4), 1–8 (May 2012)