Three-dimensional density structure of La Soufrière de Guadeloupe lava dome from simultaneous muon radiographies and gravity data
Abstract
Muon imaging has recently emerged as a powerful method to complement standard geophysical tools in the understanding of the Earth’s subsurface. Muon measurements can yield a “radiography” of the average density along the muon path, allowing to image large volumes of a geological body from a single observation point. Here we jointly invert muon data from three simultaneous telescope acquisitions together with gravity data to estimate the three-dimensional density structure of the La Soufrière de Guadeloupe lava dome. Our unique dataset allows us to achieve an unprecedented spatial resolution with this novel technique. The retrieved density model reveals an extensive, low-density anomaly where the most active part of the volcanic hydrothermal system is located, supporting previous studies that indicate this region as the most likely to be involved in a partial edifice collapse.
Gindraft=false \authorrunningheadROSAS-CARBAJAL ET AL. \titlerunninghead3-D MUON TOMOGRAPHY OF LA SOUFRIÈRE \authoraddrCorresponding author: Marina Rosas-Carbajal, Institut de Physique du Globe de Paris. (rosas@ipgp.fr)
1 Introduction
The La Soufrière de Guadeloupe volcano (Lesser Antilles) is an explosive subduction volcano holding one of the most hazardous volcanic hydrothermal systems in the world (Loughlin et al., 2015). It currently experiences an increasing unrest, raising concern on possible pore-fluid overpressurisation and flank instability. Knowledge of the density distribution in its upper structure (lava dome) is crucial for hazard assessment since it can help to determine mechanically weak regions that may result in flank collapse. Volcano density structures are traditionally studied with gravity data, and 3D models solely based on these data are highly non-unique and low-resolution, especially since field conditions often make it difficult to achieve a good data coverage.
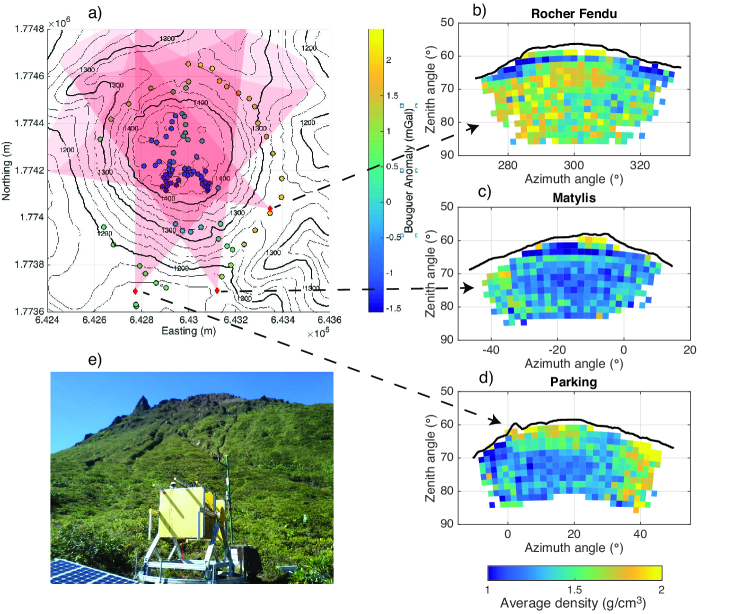
Since a decade, muon imaging has been developed by several teams to probe the density structure of various geological bodies (e.g. Nagamine et al., 1995; Tanaka et al., 2001; Lesparre et al., 2010). The principles of the method are common to those of X-ray medical imaging, where particles are absorbed differentially according to the matter’s density along their travel path Nagamine et al. (1995). The method exploits the properties of muon interaction with ordinary matter, in particular a small cross-section and a quasi linear propagation path (Nagamine et al., 1995). Experimental muon trajectories are inferred from a series of pixelated particle detectors, such that the lava dome is sampled in hundredths of directions delimited by a cone (Fig. 1 a), and scanned typically in a few weeks (Lesparre et al., 2010). The number of muons detected is used to compute the rock average density for each trajectory, resulting in 2D average-density radiographies (Fig. 1 b-d).
Among all projects using the muon imaging technique, DIAPHANE has been a pioneer since almost a decade in designing, producing and deploying portable, autonomous and robust detectors (so-called muon “telescopes”) on the slopes of active volcanoes : the La Soufrière de Guadeloupe in the Lesser Antilles (Lesparre et al., 2012b; Jourde et al., 2013, 2016), the Mayon in the Philippines, the Etna in Italy (Carbone et al., 2014). Despite difficult field conditions, data acquisition is continuous, deadtime-less with a high duty cycle (more than 95%), and only limited by electrical power blackouts during the worst weather periods. Details on the methods and detectors developed by DIAPHANE may be found in Lesparre et al. (2012c); Jourde et al. (2013); Marteau et al. (2014) and references therein.
Information about the 3D density distribution of a geological body may be obtained by combining more than one telescope acquisition (e.g. Tanaka et al., 2010) or jointly inverting the muon data with gravity data (e.g. Nishiyama et al., 2014, 2017). Nishiyama et al. (2017) jointly inverted data from a single muon telescope with gravity data to study a volcanic lava dome. Their model has a limited spatial resolution due to the few data available (30 muon data points and 30 gravity data points). A study on the resolving kernels of muon and gravity data joint inversion by Jourde et al. (2015) suggests that in the case of an ideal coverage of the geological body by several muon telescopes, gravity data do not significantly improve the inversion results. However this might not be the case when the muon radiographies are obtained from a limited number of locations.
Here, we jointly invert muon data from three acquisition sites together with gravity data points (Fig. 1 a) to study the 3D density distribution in the La Soufrière lava dome. We first present the datasets, the forward modelling and the inversion method developed to process the muon and gravity data. We emphasize the sensitivity of the inversion to the regularization scheme and its relation with the distance between the measurement point and each voxel. In a second part we perform a synthetic test to cross-check the methodology and constrain the regularization parameters. The last part presents the results obtained in the 3D reconstruction of the dome and a discussion on the model’s coherence with known geological structures and also identified limitations of the present data processing.
2 Data acquisition and processing
Muon data were simultaneously acquired by 3 muon telescopes at the “Parking”, “Matylis” and “Rocher Fendu” sites (Fig. 1 a) between June and August 2015, and for a duration of 63, 36 and 25 days, respectively. The measurement period was enough to obtain representative statistics of the outgoing muon flux in each direction. We applied the methodology proposed by Jourde et al. (2013) to filter out the upward flux of muons, which otherwise introduces a significant bias in the density estimation. The resulting average density as a function of the muon direction relative to the telescope orientation is presented in Fig. 1 b-d. The telescopes used in this analysis (Fig. 1 e) count lines of sight, but in practice the number of data points per muon telescope is lower since some lines of sight point above the volcano or to regions where the rock thickness is too high. In our case, a total of 931 muon data points are obtained combining the 3 telescopes. We estimate the error for each muon data point as a combination of the measurement error and a model error related to the approximations done to solve the forward problem (Jourde, 2015).
The muon radiographies display density values that vary between 0.7 and 3 g.cm-3, with average densities of 1.58 (Rocher Fendu), 1.32 (Matylis), and 1.43 (Parking) g.cm-3. These values are low compared to the typical density of 2.7 g.cm-3 found for andesitic rocks at La Soufrière (Komorowski et al., 2008). Rock alteration and dissolution caused by hydrothermal fluids, and the presence of large fractures and cavities in the dome may strongly reduce the bulk density of a lava dome as reported by Ball et al. (2015); Voight et al. (2002). Indeed, using a new analysis of data from the last (1976) phreatic eruption (c.f. Rosas-Carbajal et al., 2016) we re-estimated the total ejected volume of this eruption to be 5-6 m3. This large amount of non-magmatic material implies that an extensive volume of the dome is highly altered, and that large cavities prevail. Gailler et al. (2013) estimate the average density of the La Soufrière complex to be 1.8 g.cm-3 based on regional gravity surveys. A low average density is thus not surprising, however we also point out the existence of a diffusive flux of muons, which can bias the estimated density towards lower values (Nishiyama et al., 2014, 2016). This phenomenon is currently being studied with dedicated simulations, which show that in the case of La Soufrière it can effectively shift the inferred densities to lower values. We therefore treat the densities displayed in the radiographies as relative rather than absolute. Low- and high-density regions can be clearly identified in the three radiographies, even though no spatial smoothing has been applied to the data processed.
A total of 109 gravity measurements were done between March 2014 and February 2015 with a Scintrex CG-5 gravimeter. Measurements have a precision of the order of . Details of the data processing prior to inversion, including drift, tides, ellipsoid and topography corrections are given by Jourde (2015). After processing, we retained 103 good-quality data points to perform the inversion. The correlation of the Bouguer anomaly with respect to topography evaluated for different trial densities (Jourde, 2015; Nettleton, 1939) is minimum for an optimal Earth density of (Parasnis and Cook, 1952). This value is smaller than the estimate given by Gunawan (2005) in their regional study comprising data points from the whole island of Guadeloupe, but we use our local estimation to focus on the density distribution restricted to the La Soufrière lava dome. The resulting Bouguer gravity anomalies are presented in Fig. 1 a. Lowest gravity anomalies are found in the southern region of the summit whereas high gravity anomalies are localized at the north and west sides of the dome’s base.
3 Forward modeling and Inversion
The muon forward problem involves calculating a convolution of the incident muon open-air flux, their energy loss along the trajectory inside the target, and the telescope acceptance (e.g. Lesparre et al., 2012a). The relevant parameters are, on the target side: the opacity, (where is the density and the particle path length) and on the probe side: the incident muon flux. The differential muon flux associated with the line ( is the measurement point and and are the azimuth and zenith angles of the trajectory, respectively) may be expressed as a function ( is the solid angle and the surface) that accounts for the muon flux reaching the instrument. This muon flux can be computed analytically at the surface of the Earth (e.g. Tang et al., 2006; Shukla, 2016) but, here, we use a more precise model obtained with the Corsika simulation code (Heck et al., 1998) which accounts for the altitude of the lava dome. To simulate the energy loss of the muons interacting with matter for a given opacity, we use the Monte-Carlo transport code Geant4 (Agostinelli et al., 2003). Finally, to estimate the outgoing flux from the number of muon hits measured we use an experimental acceptance function, calibrated on the field for each telescope (Lesparre et al., 2012a).
Numerical tests using Geant4 show that the relation between observed opacities and outgoing flux for each telescope line of sight can be treated as linear in the +/- 2 standard deviations range. Our linear inversion fits the data within the +/- 1 standard deviation range. We thus use the relation between observed outgoing flux and opacities for +/- 2 standard deviations to estimate the Jacobian around this point. We then need to compute the opacity resulting from a 3D density distribution. For this we discretize the lava dome in cubes of using a digital elevation model with a precision and compute the relative contribution of each cube to the total opacity for each muon trajectory.
For the gravity case, we decouple the problem between the region close to the measurements and the region outside, used to compute the topography correction (c.f. Jourde, 2015). In the vicinity of the volcano we use a polyhedral discretization based on the 5 m resolution digital elevation model. We compute each polyhedra contribution to each gravity station with the program by D’Urso (2013, 2014).
The muon and gravity data are sensitive to the same physical parameter, thus a joint inversion can be achieved by combining their forward kernels. We use the same model parametrization for the gravity and muon problems such that
| (1) |
where G is the forward kernel, the data vectors, subscripts g and denote the gravity and muon case, respectively, and is the density distribution discretized in cubes of (forward kernels are built such that the same discretization is used). The scalar parameter accounts for a possible density offset between the gravity- and muon-inferred models due to the negative density bias caused by the diffusion of low-energy muons on the volcano surface. Accounting for this offset, the density models are related through . Our linear inversion minimizes an objective function consisting of weighted data misfit term and a model regularization term:
| (2) |
where , is the a priori density model and density shift, is the data covariance matrix, is the model regularization matrix and the trade-off parameter, which establishes the relative weight of the regularization in the cost function (Menke, 2012). In practice, we adjust this parameter to obtain the largest possible contribution of the model regularization while fitting the data to the error level. To determine the prior model we searched for the homogeneous density value that minimizes the density offset. We found that a value equal to the Earth density used to compute the Bouguer anomalies results in a minimum offset. Accordingly, we used a prior value of zero for the density offset. The model regularization consists of a combination of smoothness constraints, achieved by penalizing the difference in density between adjacent cubes, and damping, which favours density models that are close to .
Being sensitive to the opacity, muon data have no inherent information on the density distribution along the muon path. Similarly, gravity data have no inherent depth resolution. It is known that in the regularized inversion of potential field data the lack of depth information causes the retrieved structures to concentrate near the surface. This problem can be overcome by using a scaling of the regularization matrix to counteract the natural decay of the sensitivity with depth. Since the original application on the inversion of magnetic data by Li and Oldenburg (1996), this scaling has been applied to other types of potential field data. Here, we combine a depth scaling as introduced by Li and Oldenburg (1996) to compensate for the decay of sensitivity in the gravity data, with a distance-to-telescope scaling to compensate for the same effect in the muon data. Details on these scalings are given in the Supporting Information (Boulanger and Chouteau, 2001; Ghalehnoee et al., 2017). We emphasize that this is the first time that such scalings are implemented in an inversion of muon data. Previous studies deal with this problem by reducing the amount of damping in the zone where anomalies are expected, thus severely biasing the result of the inversion.
4 Results and interpretation
4.1 Synthetic tests
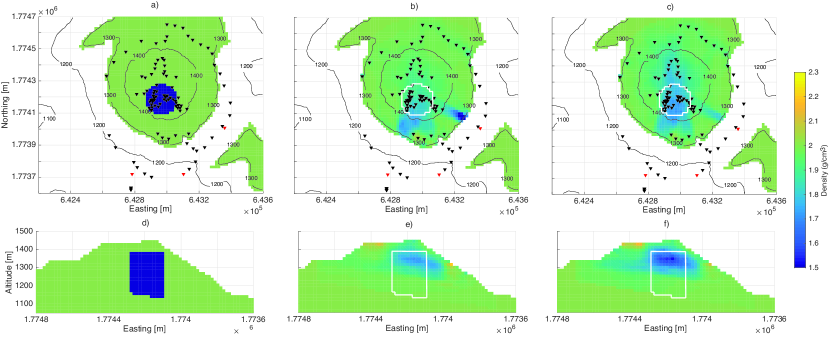
Before inverting the real data, synthetic tests are performed to assess the influence of the regularization scaling and the resolution that can be expected. Figure 2a and d) show slices of one of the models used to generate the synthetic data contaminated by errors with the same standard deviation as estimated for the real data. Without scaling, the inversion places the largest density contrasts close to the muon telescopes (Fig. 2 b and e). In turn, the matrix scaling places the density contrasts where the true anomaly is located (Fig. 2c and f). Other tests with smaller and larger radii of the cylinder and with its center close to one of the muon telescopes did not change these results. Since the three telescopes point northward, there is a more pronounced under-determination in the North-South direction which results in a spreading of the density anomaly in this direction. Inversions without the gravity data (tests not shown) confirm the importance of these data in the delimitation of the density anomalies in cases where the spatial coverage of the telescopes is not complete.
The retrieved anomaly has a shorter depth extension than the true one (Figs. 2 d and f). Indeed, the position and inclination of the telescopes determine a plane above which the density is explored. In our case, the telescope in the Parking site is the one with the lowest altitude. Its lowest plane can be inferred from Figs. 2 f where the anomaly begins. We therefore interpret the density models only above this plane. Furthermore, given the large non-uniqueness of the problem and the regularization used, we only interpret our model in terms of low- and high-density regions without asserting their precise delimitations.
4.2 Inversion of real data
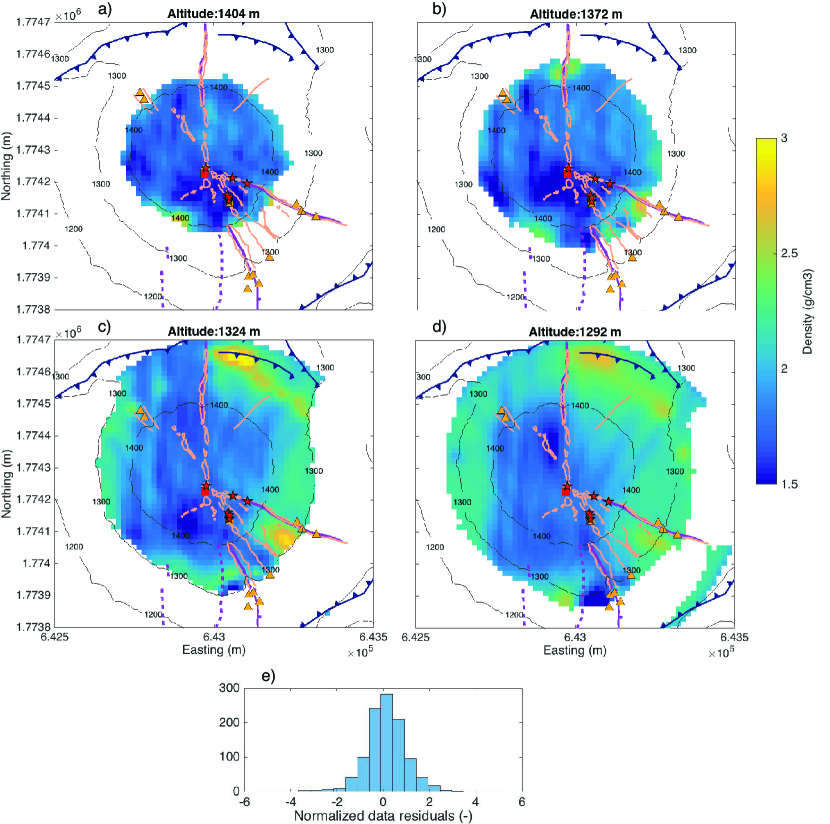
The density model resulting from the joint inversion of muon and gravity real data is shown in Figs. 3a-d). The root mean square error equals and the fit is of the same quality for both the muon and gravity data (Fig. 3e). The offset parameter equals . and the average density is of , a more realistic value than retrieved from the muon data alone and consistent with the average densities of Fig. 1 b-d. Inverting the gravity and muon data sets without the density offset parameter produces a model with density contrasts similar to the model shown in Fig. 3 down to an altitude of . However, below this altitude and in order to improve the fit of the gravity data, the inversion places an artificial high-density region that mimics the role of the offset parameter.
In presence of strong topography variations, relative gravity data can be used to retrieve an absolute density model (e.g. Linde et al., 2014). Simple synthetic tests with anomalies like the one shown in Fig. 2 suggest that the altitude differences of between the dome’s summit and base are sufficient to retrieve absolute density values. Extending this conclusion to complex density distribution is not straightforward and we prefer to restrain our interpretations on relative density variations, although the densities retrieved by the inversion fall in the expected range (see Fig. 3).
The most extensive low-density region is found below the southern part of the summit (Figs. 3a-c), where the most presently active fumaroles are located. This region counts several deep (up to 122 m) pits, craters and fractures that were active during the last 6 phreatic eruptions, as well as evidence of rock alteration (Rosas-Carbajal et al., 2016). The low-density anomaly is well resolved since the three telescopes are oriented to cover this part of the dome where many gravity measurements were done (c.f. Fig. 1a). The low-density anomaly clearly extends down to but becomes unrecognisable at level because of a limited resolution at this altitude level that is only scanned by the telescope located at the Parking site. As a consequence, the clear low-density anomaly observed for blurs into a faint low-density anomaly spread through the imaged region (Fig. 1 d).
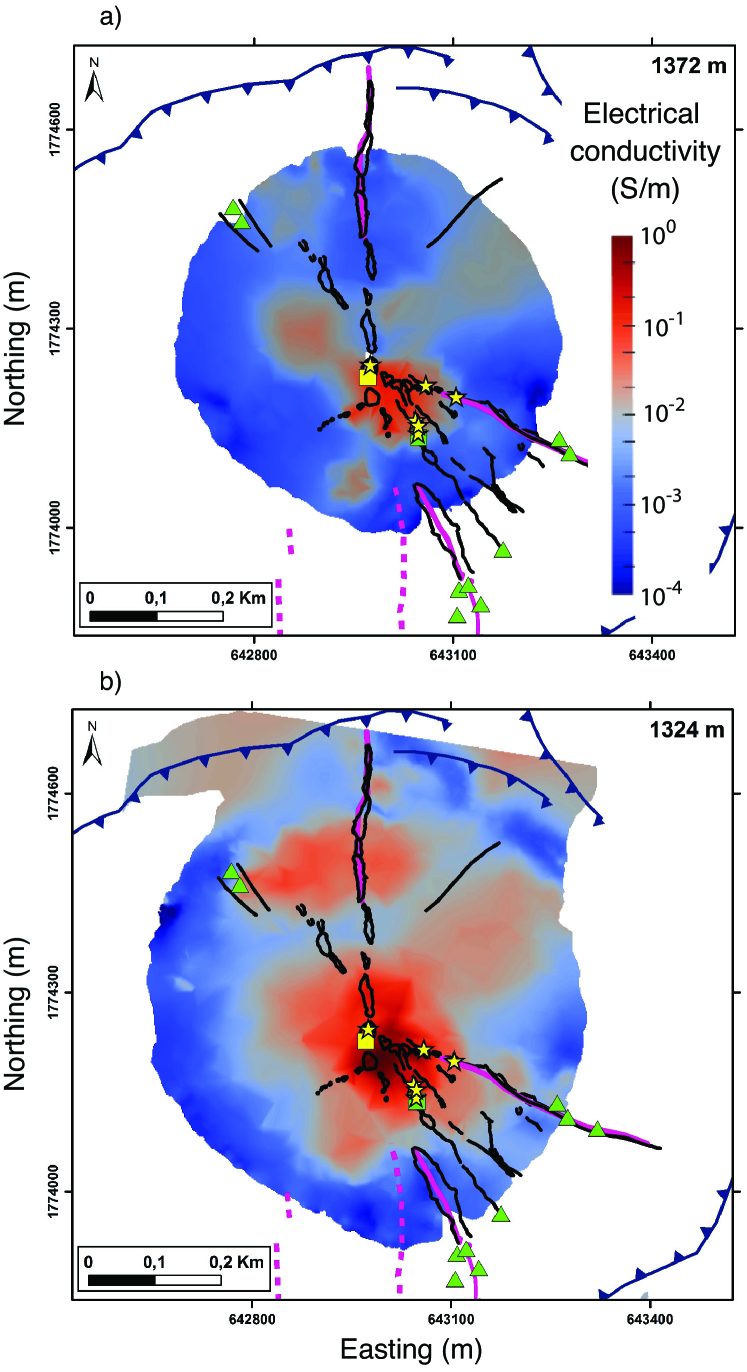
The upper, well-resolved part of this anomaly coincides with the electrically conductive region found by Rosas-Carbajal et al. (2016) with the inversion of Electrical Resistivity Tomography (ERT) data. Slices of the resulting electrical conductivity model at the same depths as in Figs. 3b and d) are presented in Fig. 4. While the high conductivity values in this region may have been explained by the presence of highly-conductive fluids (high temperature and salinity), the low density confirms that this is also a highly-altered, porous and thus mechanically weak zone, reinforcing the likelihood of a partial edifice collapse hazard (Rosas-Carbajal et al., 2016). Interestingly, the Tarissan boiling acid pond (red square in figures) where the largest amount of magmatic fluids arrive to the surface is located in the northern limit of this low-density, high-conductivity region.
More limited low-density regions are found in the southwest-west close to the summit (Figs. 3 a-b, and in the extreme south and north-center region at (Fig. 3d). The southernmost region is constrained to the North by gravity data (c.f. Fig. 1a) and it probably corresponds to open fractures in the prolongation of La Ty fault. This is supported by low conductivity values in the ERT model and historical evidence for exurgence of hot acid hydrohermal fluid from this location (see orange triangle in Fig. 3 d) during the 1976 phreatic eruption. The low-density anomaly sub-parallel to the large north-south fracture is located below a smaller, north-west fracture. Even if located relatively far for the muon telescopes, the structure is well resolved thanks to the gravity points acquired in its vicinity. Kuster and Silve (1997) report on a large cavity located exactly in this region.
High-density anomalies are found at the north-eastern base of the dome (Figs. 3c-d), towards the southeast flank (Fig. 3b-d), and in the south flank, west of the low-density region (Fig. 3a-d). In the north, the anomaly correlates to the position of the gravity measurements and follow the footpath along the base of the lava dome. This anomaly may be structurally controlled as it follows the detachment plane of an ancient collapse (Rosas-Carbajal et al., 2016). Given the lack of data outside this region we do not make further interpretations. In the south, southwest (Fig. 3c-d), and in the northern extreme at (Fig. 3b) the high density coincides with low electrical conductivity anomalies (Fig. 4a-b), revealing an extensive volume of unaltered dome rock. The southern part of this anomaly belongs to a “bulge”, which rests on top of a highly altered zone that reaches the surface in the South and thus constitutes a potential detachment plane (c.f. Rosas-Carbajal et al., 2016). Likewise, the high-density region in the southeast flank corresponds to non-altered lava dome spines.
5 Conclusions
We obtained the first 3D density model of a volcano lava dome from the joint inversion of simultaneous muon radiographies and gravity data. Several density anomalies are detected in La Soufrière, especially an extensive low-density zone located below the southern part of the summit where most of the increasingly active fumaroles are observed. These results reinforce the inference from previous studies that the southern flank of the La Soufrière lava dome is highly porous and mechanically weak, as well as saturated with hot acid fluid. The associated rock alteration and dissolution promotes instability and raises the likelihood of a partial collapse. Our density model constitutes the basis for undertaking monitoring of density changes using simultaneous muon measurements from different points around the lava dome. Future work will focus on improving the spatial coverage to refine the model resolution. New recently installed muon telescopes on the west and northern parts of the volcano are fitted with a smaller pixel support (63 63 lines of sight). Theoretical work on the behaviour of the diffusive muon flux will be crucial to estimate absolute density and its uncertainty. Joint inversion with other types of geophysical data such as ERT data will be also explored. This work demonstrates the potential of muon data to move from 2D “radiographies” to dynamic 3D imaging of geological structures. This is of paramount importance given the limitation of conventional volcano monitoring in tracking the internal state of the system with full spatial coverage.
Acknowledgements.
This research was partly financed by the Swiss National Science Foundation and is part of ANR DIAPHANE project ANR-14-ce04-0001. We acknowledge the financial support from the UnivEarthS Labex program of Sorbonne Paris Cite (ANR-10-labx-0023 and ANR-11-idex-0005-02) and from the Service National d’Observation en Volcanologie (INSU). We thank the team of the Observatoire Volcanologique et Sismologique de Guadeloupe (OVSG-IPGP) for assistance with the gravity surveys. The installation of the muon telescopes benefited of the help of the crews of the French Civil Security helicopter basis (http://www.helicodragon.com). The authors declare no competing financial interests. The data used are displayed in Figure 1 a-d of this paper. The CG-5 gravimeters were provided by the CNRS-INSU department. The 25 m resolution Digital elevation Model (BDAlti), building and terrain information (BDTopo) were obtained courtesy of IGN (2004) whereas the 5 m resolution DEM was produced by IPGP/Latitude Geosystems using stereo satellite imagery from GeoEye acquired on 20 November 2005. We thank Nolwenn Lesparre and the Editor Andrew Newman for their guidance. This is IPGP contribution 3860.References
- Agostinelli et al. (2003) Agostinelli, S., et al., GEANT4—a simulation toolkit, Nuclear instruments and methods in physics research section A: Accelerators, Spectrometers, Detectors and Associated Equipment, 506(3), 250–303, 2003.
- Ball et al. (2015) Ball, J. L., P. H. Stauffer, E. S. Calder, and G. A. Valentine, The hydrothermal alteration of cooling lava domes, Bull. Volcanol., 77(12), 102, 10.1007/s00445-015-0986-z, 2015.
- Boulanger and Chouteau (2001) Boulanger, O., and M. Chouteau, Constraints in 3D gravity inversion, Geophys. Prosp., 49(2), 265–280, 2001.
- Carbone et al. (2014) Carbone, D., D. Gibert, J. Marteau, M. Diament, L. Zuccarello, and E. Galichet, An experiment of muon radiography at Mt Etna (Italy), Geophys. J. Int., 196(2), 633–643, 10.1093/gji/ggt403, 2014.
- D’Urso (2013) D’Urso, M., On the evaluation of the gravity effects of polyhedral bodies and a consistent treatment of related singularities, J. Geod., 87(3), 239–252, 10.1007/s00190-012-0592-1, 2013.
- D’Urso (2014) D’Urso, M., Analytical computation of gravity effects for polyhedral bodies, J. Geod., 88(1), 13–29, 10.1007/s00190-013-0664-x, 2014.
- Gailler et al. (2013) Gailler, L.-S., G. Martelet, I. Thinon, V. Bouchot, J.-F. Lebrun, and P. Münch, Crustal structure of Guadeloupe Islands and the Lesser Antilles Arc from a new gravity and magnetic synthesis, Bulletin de la Société Géologique de France, 184(1-2), 77–97, 2013.
- Ghalehnoee et al. (2017) Ghalehnoee, M.H., A. Ansari, and A. Ghorbani, Improving compact gravity inversion using new weighting functions, Geophys. J. Int., 208(1), 546–560, 2017.
- Gunawan (2005) Gunawan, H., Gravimétrie et microgravimétrie appliquées a la volcanologie: exemples de la Soufriere de Guadeloupe et du Merapi, Ph.D. thesis, Institut de Physique du Globe (Paris), 2005.
- Heck et al. (1998) Heck, D., G. Schatz, J. Knapp, T. Thouw, and J. Capdevielle, CORSIKA: A Monte Carlo code to simulate extensive air showers, Tech. rep., 1998.
- Jourde (2015) Jourde, K., Un nouvel outil pour mieux comprendre les systèmes volcaniques : la tomographie par muons, application à la Soufrière de Guadeloupe (French). A new tool to better understand volcanic systems: muon tomography, application de La Soufrière de Guadeloupe, PhD Thesis, Institut de Physique du Globe, France, 2015.
- Jourde et al. (2013) Jourde, K., D. Gibert, J. Marteau, J. Bremond d’Ars, S. Gardien, C. Girerd, J.-C. Ianigro, and D. Carbone, Experimental detection of upward going cosmic particles and consequences for correction of density radiography of volcanoes, Geophys. Res. Lett., 40(24), 6334–6339, 10.1002/2013gl058357, 2013.
- Jourde et al. (2015) Jourde, K., D. Gibert, and J. Marteau, Joint inversion of muon tomography and gravimetry - a resolving kernel approach, Geosci. Instrum. Method. Data Syst. Discuss., 5(GI-2015-3), 83–116, 10.5194/gid-5-83-2015, 2015.
- Jourde et al. (2016) Jourde, K., D. Gibert, J. Marteau, J. de Bremond d’Ars, and J.-C. Komorowski, Muon dynamic radiography of density changes induced by hydrothermal activity at the la soufrière of guadeloupe volcano, Sci. Rep., 6, 33,406, 10.1038/srep33406, 2016.
- Komorowski et al. (2008) Komorowski, J.-C., Y. Legendre, B. Caron, and G. Boudon, Reconstruction and analysis of sub-plinian tephra dispersal during the 1530 A.D. Soufrière (Guadeloupe) eruption : Implications for scenario definition and hazards assessment, J. Volcanol. Geoth. Res., 178(3), 491–515, 10.1016/j.jvolgeores.2007.11.022, 2008.
- Kuster and Silve (1997) Kuster, D., and V. Silve, Guadeloupe, Canyons, Gouffres, Découverte. Editions Gap, La Ravoire, Chambéry, France,, p. 256, 1997.
- Lesparre et al. (2010) Lesparre, N., D. Gibert, J. Marteau, Y. Déclais, D. Carbone, and E. Galichet, Geophysical muon imaging: feasibility and limits, Geophys. J. Int, 183(3), 1348–1361, 10.1111/j.1365-246x.2010.04790.x, 2010.
- Lesparre et al. (2012a) Lesparre, N., D. Gibert, and J. Marteau, Bayesian dual inversion of experimental telescope acceptance and integrated flux for geophysical muon tomography, Geophys. J. Int, 188(2), 490–497, 10.1111/j.1365-246x.2011.05268.x, 2012a.
- Lesparre et al. (2012b) Lesparre, N., D. Gibert, J. Marteau, J.-C. Komorowski, F. Nicollin, and O. Coutant, Density muon radiography of La Soufriere of Guadeloupe volcano: comparison with geological, electrical resistivity and gravity data, Geophys. J. Int., 190(2), 1008–1019, 10.1111/j.1365-246x.2012.05546.x, 2012b.
- Lesparre et al. (2012c) Lesparre, N., J. Marteau, Y. Déclais, D. Gibert, B. Carlus, F. Nicollin, B. Kergosien, et al., Design and operation of a field telescope for cosmic ray geophysical tomography, Geoscientific Instrumentation Methods and Data Systems, 1, 33–42, 2012c.
- Li and Oldenburg (1996) Li, Y., and D. W. Oldenburg, 3-d inversion of magnetic data, Geophysics, 61(2), 394–408, 10.1190/1.1443968, 1996.
- Linde et al. (2014) Linde, N., L. Baron, T. Ricci, A. Finizola, A. Revil, F. Muccini, L. Cocchi, and C. Carmisciano, 3-D density structure and geological evolution of Stromboli volcano (Aeolian Islands, Italy) inferred from land-based and sea-surface gravity data, J. Volcanol. Geoth. Res., 273, 58–69, 10.1016/j.jvolgeores.2014.01.006, 2014.
- Loughlin et al. (2015) Loughlin, S. C., S. Sparks, S. K. Brown, C. Vye-Brown, and S. F. Jenkins, Global Volcanic Hazards and Risk, Cambridge University Press, 2015.
- Marteau et al. (2014) Marteau, J., J. d. B. d’Ars, D. Gibert, K. Jourde, S. Gardien, C. Girerd, and J.-C. Ianigro, Implementation of sub-nanosecond time-to-digital convertor in field-programmable gate array: applications to time-of-flight analysis in muon radiography, Measurement Science and Technology, 25(3), 035,101, 10.1088/0957-0233/25/3/035101, 2014.
- Menke (2012) Menke, W., Geophysical data analysis: discrete inverse theory, Academic press, 2012.
- Nagamine et al. (1995) Nagamine, K., M. Iwasaki, K. Shimomura, and K. Ishida, Method of probing inner-structure of geophysical substance with the horizontal cosmic-ray muons and possible application to volcanic eruption prediction, Nuclear Instruments and Methods in Physics Research Section A: Accelerators, Spectrometers, Detectors and Associated Equipment, 356(2), 585–595, 1995.
- Nettleton (1939) Nettleton, L., Determination of density for reduction of gravimeter observations, Geophysics, 4(3), 176–183, 10.1190/1.0403176, 1939.
- Nishiyama et al. (2014) Nishiyama, R., Y. Tanaka, S. Okubo, H. Oshima, H. Tanaka, and T. Maekawa, Integrated processing of muon radiography and gravity anomaly data toward the realization of high-resolution 3-D density structural analysis of volcanoes: Case study of Showa-Shinzan lava dome, Usu, Japan, J. Geophys. Res., 119(1), 699–710, 10.1002/2013jb010234, 2014.
- Nishiyama et al. (2016) Nishiyama, R., A. Taketa, S. Miyamoto, and K. Kasahara, Monte Carlo simulation for background study of geophysical inspection with cosmic-ray muons, Geophys. J. Int., 206(2), 1039–1050, 2016.
- Nishiyama et al. (2017) Nishiyama, R., S. Miyamoto, S. Okubo, H. Oshima, and T. Maekawa, 3D Density Modeling with Gravity and Muon-Radiographic Observations in Showa-Shinzan Lava Dome, Usu, Japan, Pure and Applied Geophysics, 174(3), 1061–1070, 10.1007/s00024-016-1430-9, 2017.
- Parasnis and Cook (1952) Parasnis, D., and A. Cook, A study of rock densities in the english midlands, Geophys. Suppl. MNRAS, 6(5), 252–271, 10.1111/j.1365-246x.1952.tb03013.x, 1952.
- Rosas-Carbajal et al. (2016) Rosas-Carbajal, M., J.-C. Komorowski, F. Nicollin, and D. Gibert, Volcano electrical tomography unveils edifice collapse hazard linked to hydrothermal system structure and dynamics, Sci. Rep., 6(1), 29,899 EP –, 10.1038/srep29899, 2016.
- Shukla (2016) Shukla, P., Energy and angular distributions of atmospheric muons at the Earth, Arxiv preprint hep-ph/1606.06907, 2016.
- Tanaka et al. (2001) Tanaka, H., K. Nagamine, N. Kawamura, S. Nakamura, K. Ishida, and K. Shimomura, Development of the cosmic-ray muon detection system for probing internal-structure of a volcano, Hyperfine Interact., 138(1-4), 521–526, 2001.
- Tanaka et al. (2010) Tanaka, H. K., et al., Three-dimensional computational axial tomography scan of a volcano with cosmic ray muon radiography, J. Geophys. Res., 115(B12), 10.1029/2010jb007677, 2010.
- Tang et al. (2006) Tang, A., G. Horton-Smith, V. A. Kudryavtsev, and A. Tonazzo, Muon simulations for Super-Kamiokande, KamLAND, and CHOOZ, Phys. Rev., D74(5), 053,007, 10.1103/physrevd.74.053007, 2006.
- Voight et al. (2002) Voight, B., et al., The 26 December (Boxing Day) 1997 sector collapse and debris avalanche at Soufriere Hills volcano, Montserrat, Geological Society, London, Memoirs, 21(1), 363–407, 2002.