Gradual Solar Coronal Dimming and Evolution of Coronal Mass Ejection in the Early Phase
Abstract
We report observations of a two-stage coronal dimming in an eruptive event of a two-ribbon flare and a fast Coronal Mass Ejection (CME). Weak gradual dimming persists for more than half an hour before the onset of the two-ribbon flare and the fast rise of the CME. It is followed by abrupt rapid dimming. The two-stage dimming occurs in a pair of conjugate dimming regions adjacent to the two flare ribbons, and the flare onset marks the transition between the two stages of dimming. At the onset of the two-ribbon flare, transient brightenings are also observed inside the dimming regions, before rapid dimming occurs at the same places. These observations suggest that the CME structure, most probably anchored at the twin dimming regions, undergoes a slow rise before the flare onset, and its kinematic evolution has significantly changed at the onset of flare reconnection. We explore diagnostics of the CME evolution in the early phase with analysis of the gradual dimming signatures prior to the CME eruption.
1 Introduction
Coronal dimmings were first observed by Skylab (Rust & Hildner, 1976; Rust, 1983). They are usually associated with solar eruptions like coronal mass ejections (CMEs) and flares (Hudson et al., 1996; Sterling & Hudson, 1997; Harrison et al., 2003; Zhukov & Auchère, 2004). Most coronal dimmings are caused by density decrease due to the loss or rapid expansion of the overlying corona such as by a CME (Hudson et al., 1998; Harrison & Lyons, 2000; Zhukov & Auchère, 2004). This is supported by imaging observations of simultaneous and co-spatial dimming in several coronal lines (e.g., Zarro et al., 1999; Sterling et al., 2000), as well as spectroscopic observations (Harra & Sterling, 2001; Tian et al., 2012). Therefore, coronal dimming signatures have been analyzed to infer CME properties including the mass and velocity (Aschwanden, 2016).
The more standard approach to study CME evolution and structure has been through analysis of coronagraph observations of CMEs, particularly those achieved from multiple view points (Subramanian et al., 2014; Thernisien et al., 2009; Gopalswamy et al., 2012; Poomvises et al., 2010; Kilpua et al., 2012; Colaninno, Vourlidas & Wu, 2013; Cheng & Qiu, 2016). Aschwanden (2016) has recently measured CME properties by analyzing a few hundred coronal dimming events observed by the Atmospheric Imaging Assembly (AIA; Lemen et al., 2012), in comparison with the coronagraph observations of CMEs.
In most of these studies, the CME is detected in the wake of its eruption, and significant coronal dimming occurs after the flare (Aschwanden, 2016). There is much interest in unraveling the early stage of the CME prior to its explosive release (Gopalswamy et al., 2006). Gopalswamy et al. (1999) has observed a two-stage coronal dimming as a signature of the CME, which clearly precedes the accompanying flare. In this study, we report and analyze a two-stage dimming in an eruptive event on 2011 December 26, and infer the CME expansion in the early phase. Cheng & Qiu (2016) have given a panoramic view of the flare, CME, and dimming in this event. They have found that significant dimming occurs at the onset of the flare, when CME starts to rise quickly. They have noted that, in this event, gradual dimming is also observed before the onset of the flare and the fast rise of the CME, and these pre-flare dimming signatures may help diagnose the CME motion before its fast rise.
In this paper, we focus on these gradual dimming signatures observed from about one hour before the flare onset. Different from Cheng & Qiu (2016) that primarily analyze dimming signatures in the EUV 193Å and 171Å passbands, in this study, we track coronal dimming in the EUV 304Å passband, which is dominated by emission in the upper chromosphere or transition region. It has been reported that dimming in coronal EUV lines appears to encompass more extended area than observed in chromsphere lines (e.g., Harvey and Recely 2002, and private communication with Terry Forbes). This may be caused by the projection effect of coronal loops observed in the coronal lines: when coronal loops are removed or re-oriented away from the line of sight, it produces apparent dimming (Qiu et al., 2007; Harra et al., 2007; Hock et al., 2012; Downs et al., 2015). For this reason, tracking dimming using the chromosphere lines may minimize the effect of coronal loop projection. Furthermore, when magnetic reconnection takes place, the chromosphere emission will be enhanced promptly at the feet of reconnecting field lines. Therefore, observations in the EUV 304Å passband can also reveal signatures of magnetic reconnection, which is often related to the CME kinematics during its evolution. In the following text, we will present observations of gradual dimming and transient brightening in the EUV 304Å passband (Section 2), and infer expansion of the CME magnetic structure in the early phase (Section 3). Conclusions are given in the last section.
2 Evolution of Gradual Dimming
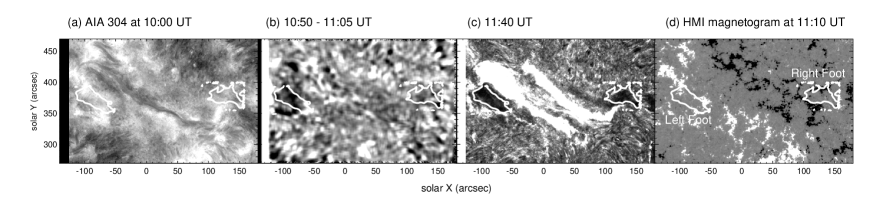
An eruptive C5.7 two-ribbon flare occurred on 2011 December 26, and was accompanied by a fast Coronal Mass Ejection (CME) and significant coronal dimming (Cheng & Qiu, 2016). The flare and coronal dimming took place in the active region NOAA 11384 (N13W14) near the disk center, and were observed by AIA, as shown in Figure 1. The CME was observed by the Solar Terrestrial Relations Observatory (STEREO), as shown in Figure 2. These observations show that significant dimming occurs at the onset of the impulsive enhancement of flare emission as well as the fast rise of the CME at 11:10 UT. The event also exhibits gradual dimming starting more than half an hour before the flare onset.
Coronal dimming in this event is observed in the EUV 304 Å passband. Figure 1 gives three snapshots taken in this passband, showing the active region at 10:00 UT (70 min before the flare onset at 11:10 UT), the weak gradual dimming before the flare onset, and the rapid deep dimming after the flare onset, respectively. The two images in panels b and c are each normalized to the image at 10:00 UT (Figure 1a). Two regions at the opposite ends of the two flare ribbons exhibit significant dimming after the flare onset (Figure 1c), and weak dimming is also seen in these regions before the flare onset (Figure 1b). These two regions are referred as the Left Foot (LF) and Right Foot (RF), respectively. Overplotted on the images are contours at 0.8 (normalized to the brightness at 10:00 UT) at the time when dimming attains the maximum area in the LF and RF. These contours are used to define the area of the dimming.
Figure 1d shows the two dimming regions (the 0.8 contours) superimposed on a longitudinal magnetogram obtained from the Helioseismic and Magnetic Imager (HMI; Schou et al., 2012). The contour in the RF covers predominantly negative magnetic flux of the amount 8.5 Mx, and the contour in the LF has positive magnetic flux of 1.1 Mx. Therefore, the two regions are each monopolar, and have rather balanced fluxes of opposite polarities. This is consistent with the idea that twin dimming maps the conjugate feet of the CME magnetic structure (Webb et al., 2000).
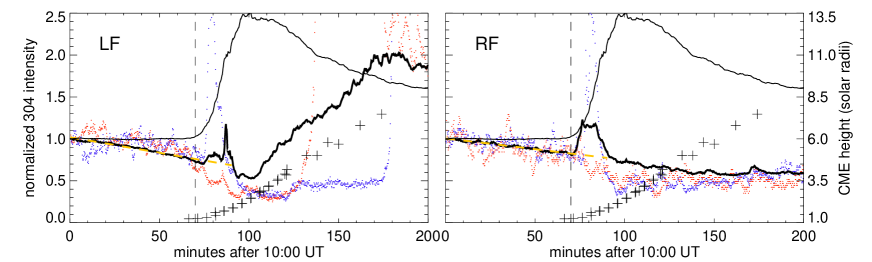
Figure 3 shows light curves in the 304 Å passband in some sample pixels, as well as the sum of all the pixels, in each of the two dimming regions. The total light curve of the active region in the 304Å passband is also plotted in thin lines. Vertical dashed lines indicate the time of the flare onset at 11:10 UT, when the EUV 304Å emission in the active region starts to rise. Also plotted in symbols is the height of the CME measured from STEREO observations (Cheng & Qiu, 2016, also see Figure 2h). The light curves of the dimming regions show that significant dimming occurs at or after the flare onset, when the CME visible in the STEREO field of view starts to rise quickly. Most of the pixels also demonstrate prolonged gradual dimming before the flare onset. This gradual dimming evolution is most clearly illustrated in the total light curve of each of the dimming regions.
Before 11:00 UT, the gradual dimming evolves nearly as a linear function of time, and may be approximated by , where is the brightness (in units of counts), is the brightness at 10 UT, is the time lapse (in units of minutes) from 10:00 UT, and the slope is an indication of the dimming growth rate, in units of percentage (with respect to data counts at 10 UT) per minute. We fit the EUV 304 light curve for each pixel in the dimming regions to this linear function of time. The majority of the pixels in the dimming regions (70% and 68% in the LF and RF, respectively) exhibit pre-flare dimming with a positive of up to 0.01 (percentage per minute). We also fit the total light curve in each of the two dimming regions, finding the slope for the LF and RF, respectively. The other fitting parameter is very close to unity. In each panel of Figure 3, the orange line shows the fit of the total light curve to the linear function of time.
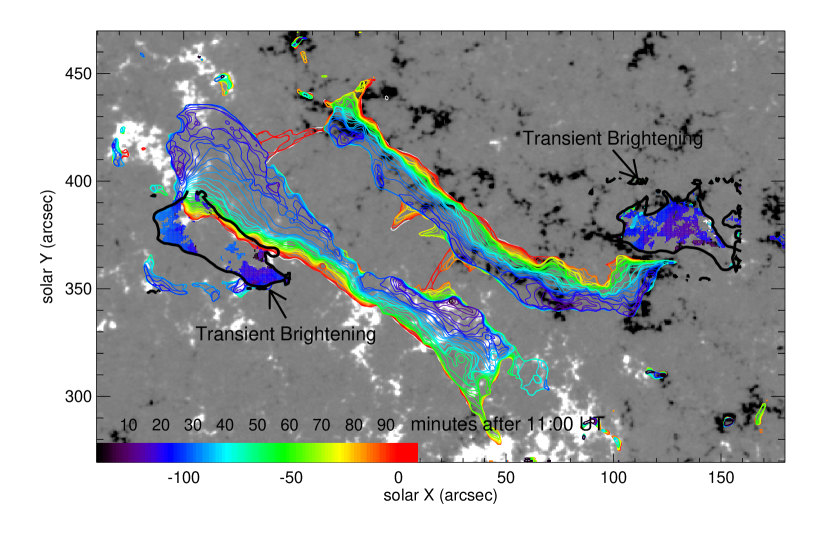
Figure 3 also reveals transient brightening in the EUV 304Å passband around the onset of the flare in some places in the dimming regions. Pixels exhibiting transient brightening are mapped in Figure 4 with color indicating the time when transient brightening reaches the peak brightness. About one third to one half of the dimming pixels exhibit transient brightening, and their brightness peaks within 20 minutes after the flare onset at 11:10 UT. The figure also shows the flare ribbon evolution in color contours that indicate the time when flare ribbons start to brighten. At the flare onset, 11:10 UT, the inner edges of the two ribbons are brightened (violet color), indicating the start of flare reconnection forming closed flare loops near the magnetic polarity inversion line. Transient brightening occurs around the same time, but in the dimming regions at the outmost edges of the flare ribbons. Note that whereas the flare ribbon brightening is persistent, the transient brightening in the dimming regions is immediately followed by rapid dimming. In about 20 minutes after the rapid dimming, parts of the LF region are brightened again, due to reconnection proceeding away from the polarity inversion line into the dimming region. The RF region, on the other hand, is not brightened again and dimming continues for more than an hour.
Gopalswamy et al. (1999) have studied an eruptive event, also noting a two-stage coronal dimming as a signature of the CME. They found weak coronal dimming starting two hours before the rise of the flare soft X-ray emission, followed by rapid dimming starting 45 minutes before the flare emission. The rapid dimming is considered to reflect the onset of the CME, which well precedes the flare in that event. Similarly, the observed persistent gradual dimming in this event may indicate the slow rise of the CME magnetic structure starting an hour before the flare, and the onset of the CME as observed by STEREO also coincides with the rapid dimming. But different from the case reported by Gopalswamy et al. (1999), in this event, the rapid dimming and the fast rise of the CME take place at or after the flare onset. Furthermore, transient brightenings are observed in the dimming regions at the flare onset, which mark the transition between the two stages of dimming. It is likely that transient brightenings in the dimming regions are produced by reconnection of the CME structure itself with overlying field lines, which, together with the tether-cutting reconnection below the CME structure forming flare ribbons, enables eruption of the CME, and causes subsequent rapid dimming at the feet.
3 CME Expansion In the Early Phase
To infer the rise of the CME in the early phase, we model the observed gradual dimming in the EUV 304 Å passband, assuming that emission in this passband by the transition region or upper chromosphere is proportional to the gas pressure (the so-called pressure gauge; Fisher, 1987; Hawley and Fisher, 1992; Qiu et al., 2013; Zeng et al., 2014), which is uniform from the corona to the transition region and upper chromosphere in quasi-static equilibrium. Therefore, the time evolution of the 304Å emission at the base of the corona follows the simple relation .
When the CME coronal structure expands, it reduces the plasma density and/or temperature , and therefore the gas pressure decreases. To study this change, a few CME expansion models are adopted to calculate the evolution of the coronal pressure. In general, these models assume 1d or self-similar CME expansion, either isothermally or adiabatically (Aschwanden, 2016). Mass conservation further requires (1d expansion) or (self-similar expansion) to be constant, where is the length-scale of the CME structure. We assume , where is the height of the coronal structure above the solar surface anchored at the dimming regions. 111Note that the curvature effect is ignored for the early-phase CME at a low height relative to the Sun’s radius.
With these considerations, evolution of the EUV 304Å emission can be described by
where and refer to properties at the initial time, and depends on the expansion model. With the ratio of specific heats , the power index is given by for the 1d isothermal expansion (IS1 hereafter), self-similar isothermal expansion (IS3), 1d adiabatic expansion (AD1), and self-similar adiabatic expansion (AD3), respectively. From observations, , the height and speed of the expanding plasma rooted at the dimming region can be computed as and , respectively.
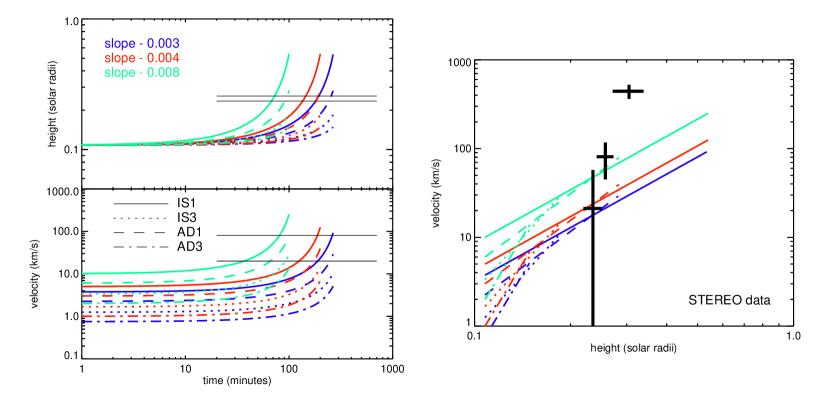
The left panels in Figure 5 shows the evolution of the CME height and speed calculated with several values of and with the four models. Since the separation of the two dimming regions is 200 ″(Figure 1), we take the initial height of the CME () to be 100 ″, assuming that it is a semi-circular structure. The values of from fitting the light curves of the two dimming regions are used in the calculation. In addition, we also calculate the case for , with the consideration that the observed dimming rate may be smaller than the actual dimming rate due to effects of scattered light and uncorrected point spread function. The height and speed curves have asymptotical behavior as approaches zero, when the relation in the above equations is no longer valid. We carry the calculation to the time when . It is apparent that the CME height, as well as its speed, is largest by the 1d isothermal expansion, followed by the 1d adiabatic, 3d isothermal, and 3d adiabatic models. The right panel shows the height-speed diagram of the four models with the three dimming rates; the growth rate of the speed with respect to the height is largest in AD3 model, followed by IS3, AD1, and IS1 models.
It is interesting to compare these curves with the STEREO observations of the CME. The CME becomes visible in the STEREO-B EUVI field of view at 11:06 UT (Figure 2), when its height is measured to be solar radii above the surface, and its speed, which is the time derivative of the height, is km s-1. In the next time at 11:11 UT, its height is solar radii, its speed being km s-1. The dark symbols in the height-speed diagram in Figure 5 show the measurements from the STEREO observations by Cheng & Qiu (2016, also reproduced in Figure 3), and the vertical and horizontal bars mark the uncertainties. Comparing these measurements with the model calculation, we find the first measurement of the CME height and speed at 11:06 UT is well within the range of the 1d models, and the second measurement at 11:11 UT is close to the upper-limit of the 1d models. Note that these two measurements are obtained at about 70 minutes after the initial time at 10:00 UT. In the height and speed plots in the left panels of Figure 5, two horizontal lines mark the first two measurements. It is seen that, with the observed dimming rate () and prescribed initial height , it takes more than 100 minutes to reach the observed CME height following the two 1d expansion models. With a reasonably larger initial height or a larger dimming rate , the observed CME height and speed can be produced in a shorter time. On the other hand, the two 3d models cannot produce results close to the first two STEREO measurements even if we vary the initial model parameters in a reasonable range.
Five minutes later, at 11:16 UT, the CME is at 0.31 solar radii with a speed of a few hundred kilometers per second. The diagram in Figure 5 shows that the results from the 1d models are no longer comparable with the CME speed at this height, suggesting that CME kinematics has changed from the gradual evolution, most likely because of the reconnection onset at 11:10 UT. Meanwhile, rapid dimming is observed at this time reflecting the rapid expansion of the CME.
4 Conclusion & Discussions
In this paper, we have shown that the twin dimming regions in an eruptive event reported in Cheng & Qiu (2016) also exhibit gradual dimming in the EUV 304Å passband from more than half an hour before the flare onset and fast rise of the CME. Transient brightening in this passband also occurs in the dimming regions at the time when flare ribbons start to form. The transient brightening is followed by rapid dimming coincident with the fast rise of the CME. It is likely that CME field lines reconnect with the ambient field, which produces the transient brightening at the feet (Downs et al., 2015), and flare ribbons are produced by reconnection below the CME. Therefore, reconnection marks the transition between the two stages of dimming, or the two stages of the CME evolution.
We analyze evolution of the gradual dimming, which grows nearly linearly with time, to infer the CME height and speed in the early phase, with the assumption that the 304 counts rate is proportional to the coronal pressure. We find that, with the observed dimming rate, the radial (1d) expansion model can best match the measurements of the CME height and speed when the CME is first observed by STEREO from the limb. Shortly after the onset of reconnection, the kinematic evolution of the CME has significantly changed from the gradual evolution.
The analysis in this study shows the potential that high-cadence disk observations with high-quality photometry by AIA may be used to reconstruct evolution of the CME (if pre-existing) in the early phase before its catastrophic eruption.
References
- Aschwanden (2016) Aschwanden, M. J. 2016, ApJ, 831, 105
- Cheng & Qiu (2016) Cheng, J. X., Qiu, J. 2016, ApJ, 825, 37
- Colaninno, Vourlidas & Wu (2013) Colaninno, R. C., Vourlidas, A., & Wu, C. C. 2013, J. Geophys. Res., 118, 6866
- Démoulin & Dasso (2009) Démoulin, P., & Dasso, S. 2009, A&A, 498, 551
- Downs et al. (2015) Downs C., Török T., Titov V. et al, 2015, TESS, 1, 30401
- Fisher (1987) Fisher, G. H. 1987, ApJ, 317, 502
- Forbes & Lin (2000) Forbes, T. G., & Lin, J. 2000, Journal of Atmospheric and Solar-Terrestrial Physics, 62, 1499
- Gopalswamy et al. (1999) Gopalswamy, N., Kaiser, M. L., MacDowall, R. J., Reiner, M. J., Thompson, B. J., Cyr, O. C. St., 1999, “The solar wind nine conference”, AIP Conference Proceedings, Vol 471, 641
- Gopalswamy et al. (2006) Gopalswamy, N., Mikic, Z., Maia, D., Alexander, D., Cremades, H., Kaufmann, P., Tripathi, D., Wang, Y.-M., 2006, Space Science Reviews, 123, 303
- Gopalswamy et al. (2012) Gopalswamy, N., Mäkelä, P., Yashiro, S., & Davila, J. M. 2012, Sun and Geosphere, 7, 7
- Harra et al. (2007) Harra, L. K., Hara, H., & Imada, S. 2007, PASJ, 59, 801
- Harra & Sterling (2001) Harra, L. K., & Sterling, A. C. 2001, ApJ, 561, L215
- Harrison & Lyons (2000) Harrison, R. A., & Lyons, M. 2000, A&A, 358, 1097
- Harrison et al. (2003) Harrison, R. A., Bryans, P., Simnett, G. M., & Lyons, M. 2003, A&A, 400, 1071
- Harvey and Recely (2002) Harvey, K. L., & Recely, F. 2002, Sol. Phys., 211, 21
- Hawley and Fisher (1992) Hawley, S. L. & Fisher, G. H. 1992, ApJS, 78, 565
- Hock et al. (2012) Hock, R. A., Lukancic, K. D., Woods, T. N., & Reinard, A. A. 2012, AGUFM, SH44, 04
- Hudson et al. (1996) Hudson, H. S., Acton, L. W., & Freeland, S. L. 1996, ApJ, 470, 629
- Hudson et al. (1998) Hudson, H. S., Lemen, J. R., St. Cyr, O. C., Sterling, A. C., & Webb, D. F. 1998, GRL, 25, 2481
- Kilpua et al. (2012) Kilpua, E. K. J., Mierla, M., Rodriguez, L., Zhukov, A. N., Srivastava, N., & West, M. J. 2012, Sol. Phys., 279, 477
- Kumar & Rust (1996) Kumar, A., & Rust, D. M. 1996, J. Geophys. Res., 101, 15667
- Lemen et al. (2012) Lemen J. R., Title A. M., Akin D. J., et al 2012, Sol. Phys., 275 17
- Moore et al. (2001) Moore, R. L., Sterling, A. C., Hudson, H. S., & Lemen, J. R. 2001, ApJ, 552, 833
- Olmedo & Zhang (2010) Olmedo, O., & Zhang, J. 2010, ApJ, 718, 433
- Poomvises et al. (2010) Poomvises, W., Zhang, J., & Olmedo, O. 2010, ApJ, 717, L159
- Qiu et al. (2007) Qiu, J., Hu, Q., Howard, T. A., & Yurchyshyn, V. B. 2007, ApJ, 659, 758
- Qiu et al. (2013) Qiu, J, Sturrock, Z, Longcope, Dana W., Klimchuk, James A., & Liu, Wen-Juan 2013, ApJ, 774, 14
- Rust (1983) Rust, D. M. 1983, SSRv, 34, 21
- Rust & Hildner (1976) Rust, D. M., & Hildner, E. 1976, Sol. Phys., 48, 381
- Schou et al. (2012) Schou J., Scherrer P. H., Bush R. I., et al 2012, Sol. Phys., 275 229
- Sterling & Hudson (1997) Sterling, A. C., & Hudson, H. S. 1997, ApJ, 491, L55
- Sterling et al. (2000) Sterling, A. C., Hudson, H. S., Thompson, B. J., & Zarro, D. M. 2000, ApJ, 532, 628
- Subramanian et al. (2014) Subramanian, P., Arunbabu, K. P., Vourlidas, A., & Mauriya, A. 2014, ApJ, 790, 125
- Thernisien et al. (2009) Thernisien, A., Vourlidas, A., & Howard, R. A. 2009, Sol. Phys., 256, 111T
- Tian et al. (2012) Tian, H, McIntosh, S. W., Xia, L. D., He, J. S, & Wang, X. 2012, ApJ, 748, 106
- Vourlidas et al. (2013) Vourlidas, A., Lynch, B. J., Howard, R. A., & Li, Y. 2013, Sol. Phys., 284, 179
- Wang et al. (2009) Wang, Y., Zhang, J., & Shen, C. 2009, J. Geophys. Res., 114, A10104
- Webb et al. (2000) Webb, D. F., Lepping, R. P., Burlaga, L. F., DeForest, C. E., Larson, D. E., Martin, S. F., Plunkett, S. P.; Rust, D. M. 2000, J. Geophys. Res., 105, 27251
- Zarro et al. (1999) Zarro, D. M., Sterling, A. C., Thompson, B. J., Hudson, H. S., & Nitta, N. V. 1999, ApJ, 520, L139
- Zeng et al. (2014) Zeng, Zhicheng, Qiu, Jiong, Cao, Wenda, Judge, & Philip G. 2014, ApJ, 793, 87
- Zhang et al. (2013) Zhang, J., Hess, P., & Poomvises, W. 2013, Sol. Phys., 284, 89
- Zhukov & Auchère (2004) Zhukov, A. N., & Auchère, F. 2004, A&A, 716, 705