Dynamics and complex formation in charged and uncharged Ficoll70 solutions
Abstract
We apply pulsed-field-gradient NMR (PFG NMR) technique to measure the translational diffusion for both uncharged and charged polysaccharide (Ficoll70) in water. Analysis of the data indicate that NMR signal attenuation above a certain packing fraction can be adequately fitted with a bi-exponential function. The self-diffusion measurements show also that the Ficoll70, an often-used compact, spherical polysucrose molecule, is itself non-ideal, exhibiting signs of both softness and attractive interactions in the form of a stable suspension consisting of monomers and clusters. Further, we can quantify the fraction of monomer and cluster. This work strengthens the picture of the existence of a bound water layer within and around a porous Ficoll70 particle.
pacs:
Valid PACS appear hereI Introduction
A highly branched copolymer of two short building blocks, sucrose and epichlorohydrin, Ficoll70 has been widely used in studies of macromolecular crowding, and for applications in blood preservation and renal filtration due to its high hydrophobicity as well as its charge neutral globular form. Palit et al. (2017a); Wang et al. (2012a); Wong et al. (2016); Groszek et al. (2010); Fissell et al. (2007); Venturoli and Rippe (2005); Dhar et al. (2010); Wenner and Bloomfield (1999); Galan et al. (2001); Lavrenko, Mikriukova, and Okatova (1987); Tokuriki et al. (2004); Wang et al. (2012b) This synthetic carbohydrate polymer has been used by many investigators to produce a resemblance of the high total concentrations that are encountered in the cytoplasm. Zimmerman and Minton (1993)
While some experiments found that the diffusion of Ficoll70 fits the accepted model for diffusion of hard sphere through cylindrical pores. Bohrer, Patterson, and Carroll (1984); Deen, Bohrer, and Epstein (1981), other experiments found either that Ficoll70 was more spherical and protein-like than dextran Oliver et al. (1992), or that it is more deformable than globular proteins. Axelsson et al. (2011) Based on experiments in vivo, Asgeirsson et al. conjectured that Ficoll70 is sufficiently crosslinked that it cannot reptate, but is not a rigid sphere. Asgeirsson et al. (2007) Fissell and collaborators measured transport of Ficoll70 through silicon slit nanopore membranes. They observed that Ficoll70 molecules could penetrate the pore even when the Stokes-Einstein radius was greater than the slit width, implying deformability. They surmised Ficoll70 molecule either is not spherical, is not rigid, or exhibits a different conformation in ionic solutions. Fissell et al. (2007)
The most advanced analysis of Ficoll70 solution properties has been done in the renal filtration literature. Venturoli and Rippe (2005); Rippe et al. (2006); Groszek et al. (2010); Ohlson, Sörensson, and Haraldsson (2000); Fissell et al. (2007); Asgeirsson et al. (2006); Öberg and Rippe (2014) Fissell et al. used standard multidetector size-exclusion chromatography (SEC) on Ficoll to show that the Mark-Houwink exponents for the molecular mass dependence of the intrinsic viscosity were 0.34 (Ficoll70) and 0.36 (Ficoll400), between the value of 0 for a solid sphere and 0.5 - 0.8 for a random coil. Fissell et al. (2010) Their result agree closely with those of Lavrenko et al. Lavrenko, Mikryukova, and Didenko (1986) Groszek et al. used similar experiments to demonstrate that charged Ficoll70 was significantly retarded compared with uncharged Ficoll70 across the rat glomerular filtration barrier. Groszek et al. (2010) Georgalis et al. found two different sizes of particles in Ficoll70 by means of light scattering experiments. Georgalis et al. (2012)
| Species | Zeta Potential | Mobility | Conductivity |
|---|---|---|---|
| (mV) | (m cm V/s) | (mS/cm) | |
| Charged Ficoll70 | -27 4 | - 1.4 0.2 | 0.1 0.02 |
| (without salt) | |||
| Charged Ficoll70 | -29 2 | -1.3 0.4 | 1.1 0.01 |
| (salt added) | |||
| Uncharged Ficoll70 | -5.2 0.2 | - 0.4 0.02 | 0.04 0.01 |
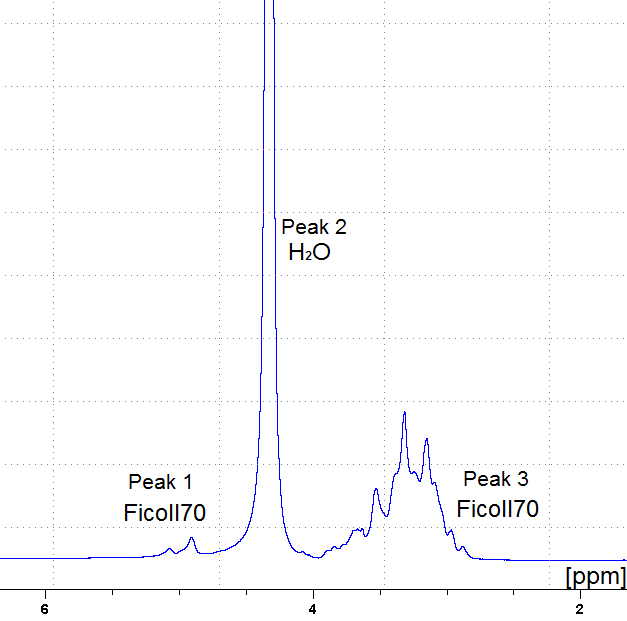
In this study, we employ pulsed-field-gradient (PFG) NMR to monitor the self-diffusivities of uncharged and charged Ficoll70 in deionized water. Because of the spectral selectivity of NMR, we can simultaneously (see Figure 1) obtain signal from both the Ficoll70 and water species. In a companion work, we focus on polymer structure and dynamics Palit et al. (2017b) in the presence of Ficoll70 crowder. Ficoll is an often-used crowder. In the understanding of macromolecular crowding, it is important to understand well the properties of the crowder. In this work, we examine the properties of both charged and uncharged Ficoll70 for evidence of cluster formation in equilibrium, a phenomenon, distinct from bulk phase separation, that has been identified in colloids and proteins where short-ranged attractions coexist with longer-ranged (typically electrostatic) repulsive interactions. Groenewold and Kegel (2001); Stradner et al. (2004); Barhoum and Yethiraj (2010); Porcar et al. (2010); Barhoum, Agarwal, and Yethiraj (2013); Sweatman, Fartaria, and Lue (2014)
II Materials and Methods
Ficoll®PM 70 (referred to as Ficoll70 in the text) with average molecular weight of 70000 (mean radius 4.5-5.5 nm Sörensson et al. (1998); Georgalis et al. (2012); Wenner and Bloomfield (1999); Luby-Phelps et al. (1987)) was purchased from Sigma Aldrich and used without further purification. Charged Ficoll70 (Ficoll CM 70) was a carboxymethylated derivative of Ficoll PM70, made as described in reference. Groszek et al. (2010) It was a gift from Dr. William H. Fissell, and was used as received after having been neutralized and dialyzed against distilled water for 4 days. Experimental volume fractions of Ficoll70 were calculated using the partial specific volume of Ficoll70, which is 0.67 /g. Lavrenko, Mikriukova, and Okatova (1987)
For sample preparation, the desired volume fraction of Ficoll70 was dissolved in deionized H2O. For charged Ficoll70 solutions, the conductivity was controlled, using KCl, to a value of mS/cm (see Table 1) in order to ensure a consistent Debye-Hückel screening length for all samples. The solution was stirred for 10 hours. Samples were then transferred to 5 mm outer diameter NMR tubes.
II.1 PFG NMR
The one-dimensional 1D proton NMR spectrum has been observed for different species in all samples at a resonance frequency of 600 MHz on a Bruker Avance II spectrometer. Figure 1 shows well-separated peak regions related to this system. Peak 1 and Peak 3 are the Ficoll70 peaks whereas Peak 2 is for molecules in solution. All NMR experiments were performed at T =298K. The self-diffusion measurements were carried out in a diffusion probe Diff 30 and with maximum field gradient 1800 G/cm (18 T/m). Diffusion was measured with a pulsed-field-gradient stimulated echo sequence with trapezoidal gradient pulses. Price (1997) The diffusion coefficient of a molecule in aqueous solution is obtained from the attenuation of the signal according to the equation
| (1) |
where is the intensity of the signal in the presence of field gradient pulse, is the intensity of the signal in the absence of field gradient pulse, , is the proton gyromagnetic ratio, = 2 ms is the duration of field gradient pulse, = 100 ms is the time period between two field gradient pulses, and g is the amplitude of field gradient pulse.
II.2 Zeta Potential
The Zeta potential () and electrophoretic mobility of Ficoll70 solutions, shown in Table 1, were measured by a Zetasizer Nano Z system (Malvern Instruments Ltd, Malvern, United Kingdom). The dimensionless Zeta potential and for charged and uncharged Ficoll70 respectively. The solutions of charged Ficoll70 were all prepared with added salt in order to keep the conductivity at 1 mS/cm, resulting in a Debye-Hückel screening length nm. This corresponds to a . Given the value of the dimensionless Zeta potential and , i.e., both of order unity, electrostatics should clearly be important, but not overwhelmingly so.
II.3 Bulk Viscosity Measurement
Experiments were performed on an Anton Paar Physica MCR 301 rheometer, where the cone-plate measuring system was used to extract the flow curves. The cone-plate geometry has a diameter of 50 mm and cone angle of . The flow curves experiments were carried out with shear rate varying from 0.001 to 150 s-1. For all samples reported in this work, viscosity remains constant as the shear rate is varied.
III Diffusion Model
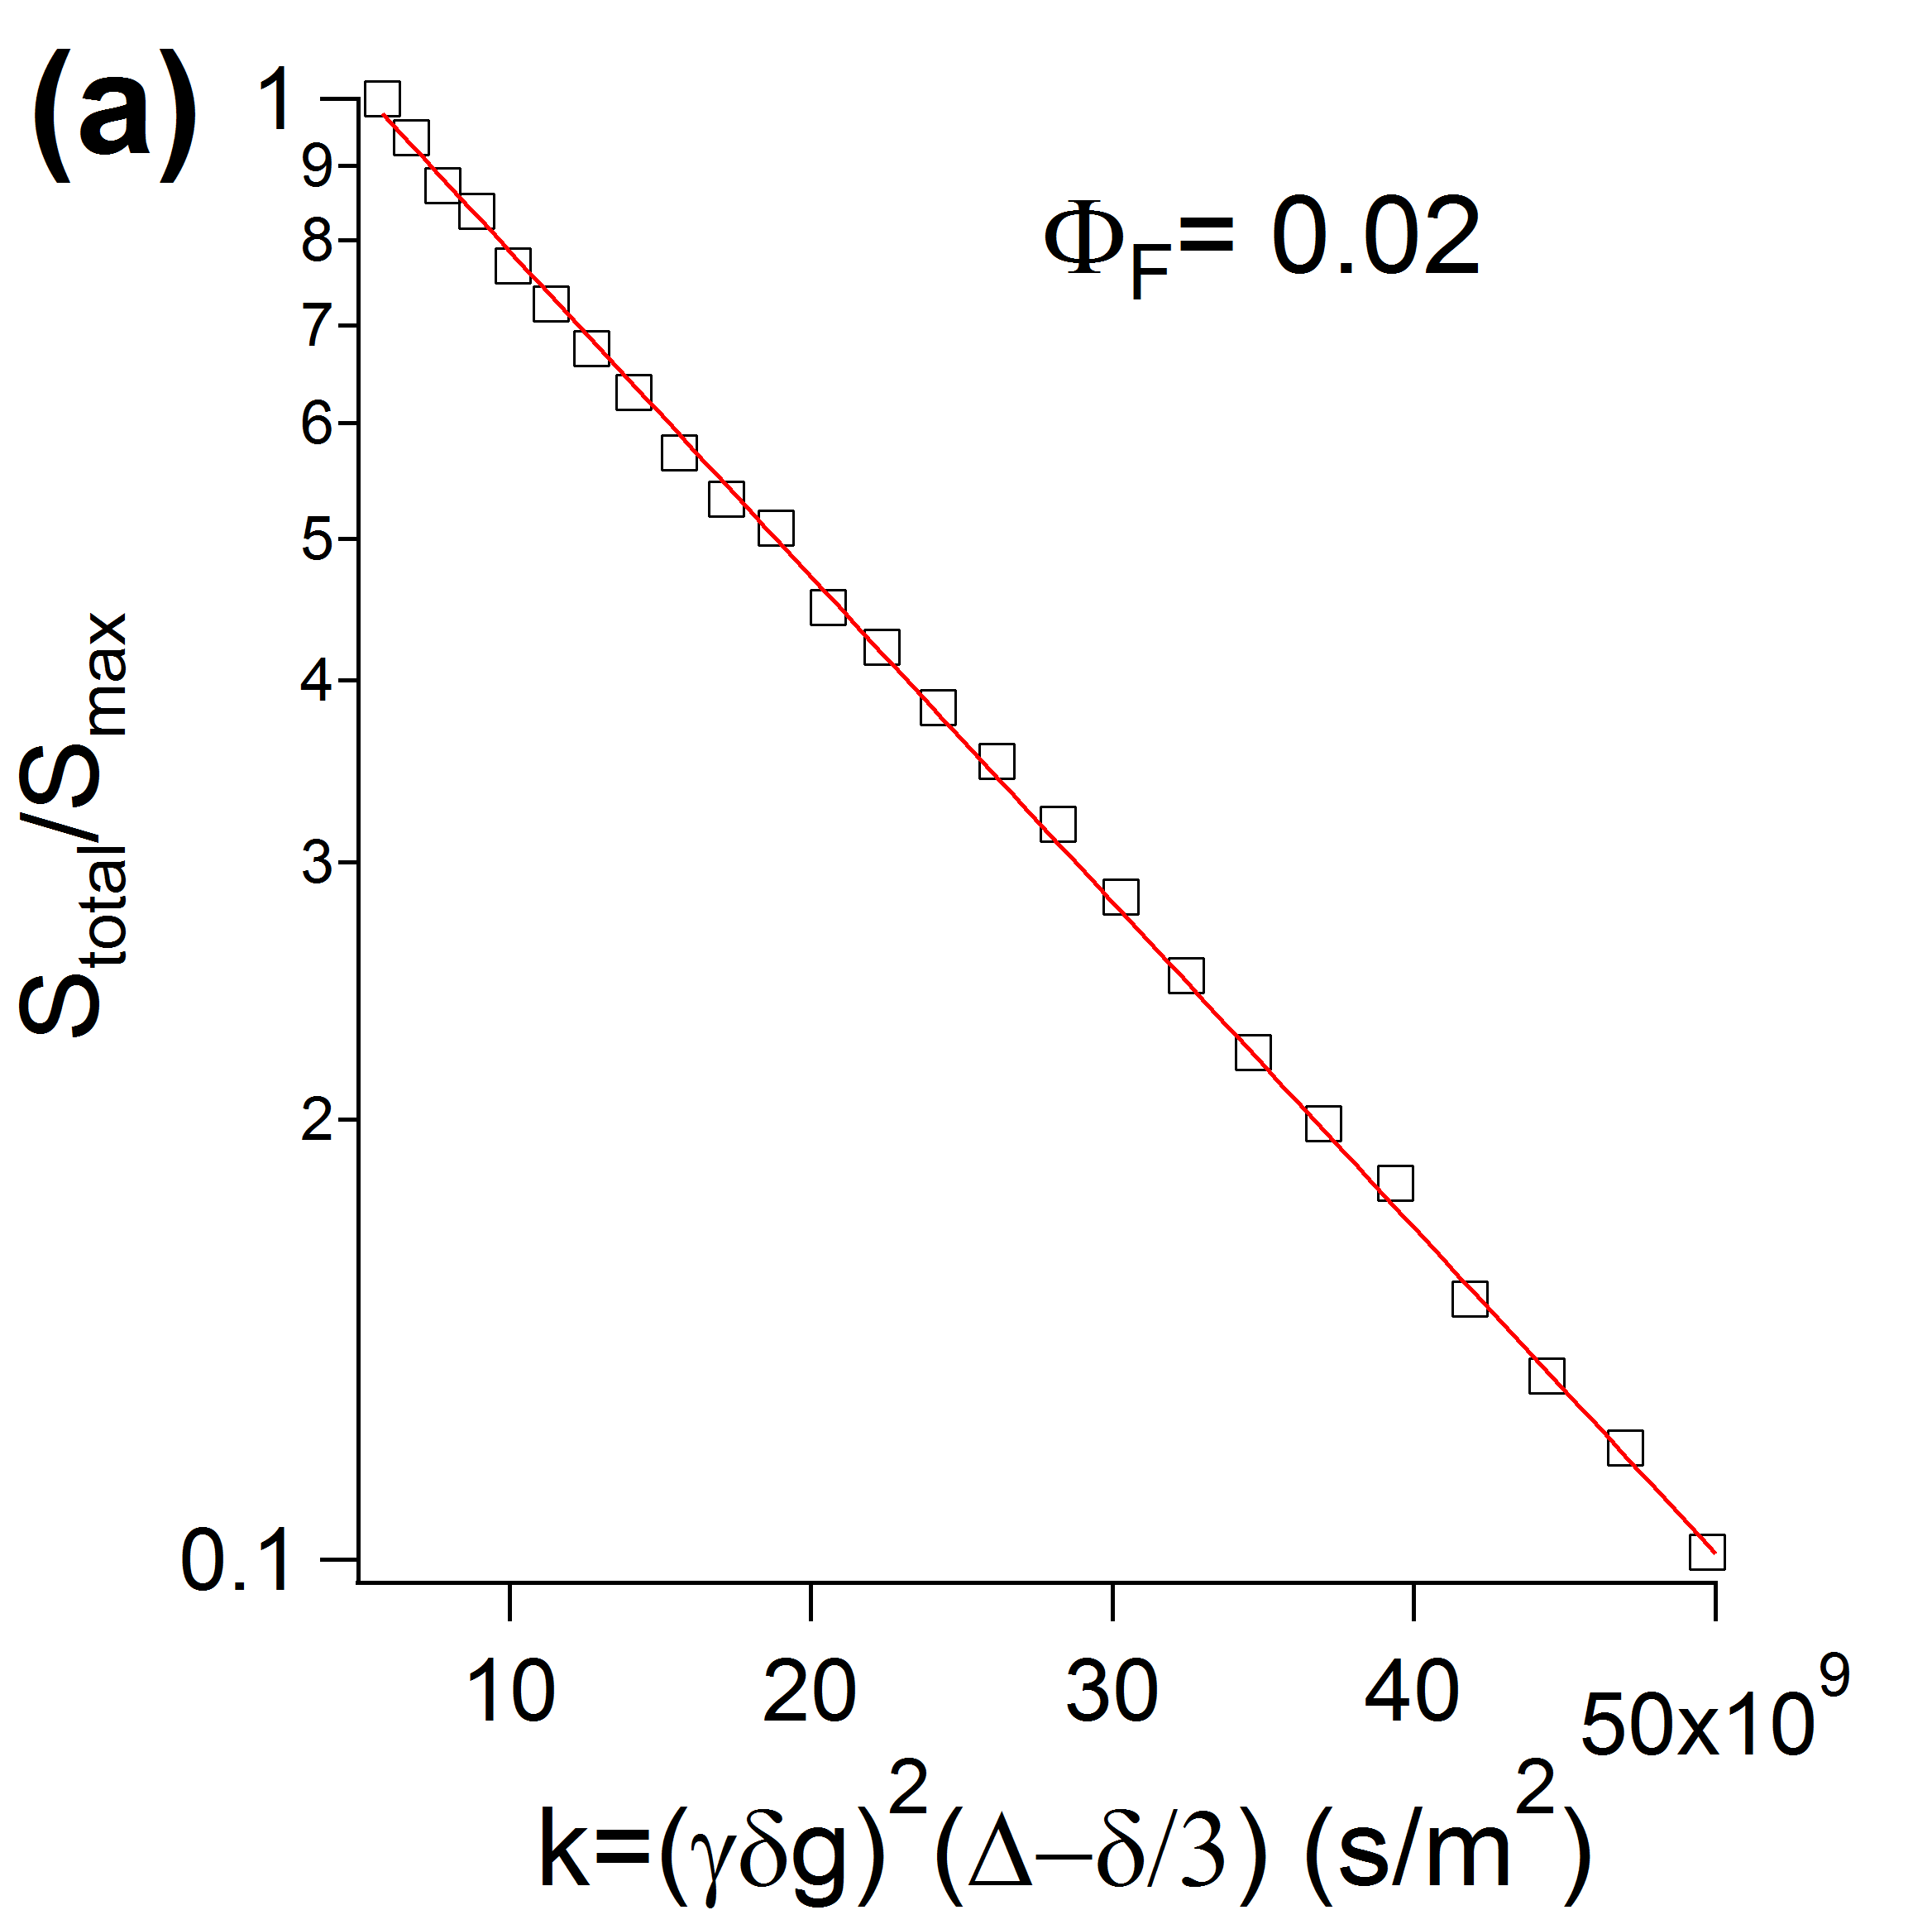
The PFG NMR signal attenuation of Ficoll70 shows a monoexponential decay with the gradient strength parameter at low packing fraction ( (uncharged) and (charged)). This implies either that it is a single component system or that there are multiple components (e.g. a monomer and cluster) that exchanges very rapidly between monomer and aggregate on the timescale of the NMR experiment. Barhoum, Palit, and Yethiraj (2016) Given the larger size of Ficoll70, the diffusion time of the monomer s; thus residence times of the Ficoll70 molecule within clusters will be a few micro-seconds or longer. Hence the fact that the signal attenuation associated with the Ficoll70 peak exhibits monoexponential behaviour (Figure 2(a)) at low packing fractions suggests that the exchange between Ficoll70 clusters and monomers must be very rapid on the NMR time scale.
On the other hand, if the molecular exchange between monomer and cluster is very slow, one expects the total Ficoll70 signal to be given by
| (2) | |||||
IV Results
The spectral selectivity of PFG NMR allows us to simultaneously obtain diffusion coefficients of water and Ficoll70. We can thus obtain, not only Ficoll70 dynamics, but also the information about the interaction of water with the crowder.
IV.1 Ficoll70 forms clusters
The crowder diffusion coefficient is obtained in pure Ficoll70 aqueous solutions. The key observation is that the PFG NMR signal attenuation is not mono-exponential when is greater than a threshold value: 0.05 (0.10) for uncharged (charged) Ficoll70. When there are two species with the same chemical signatures, and when there is slow exchange (or no exchange) between the species, one obtains bi-exponential signal attenuations in a PFG NMR experiment (Figure 2(b)). Our observations thus indicate the co-existence of (fast diffusing) monomers and (slow diffusing) clusters of Ficoll70.
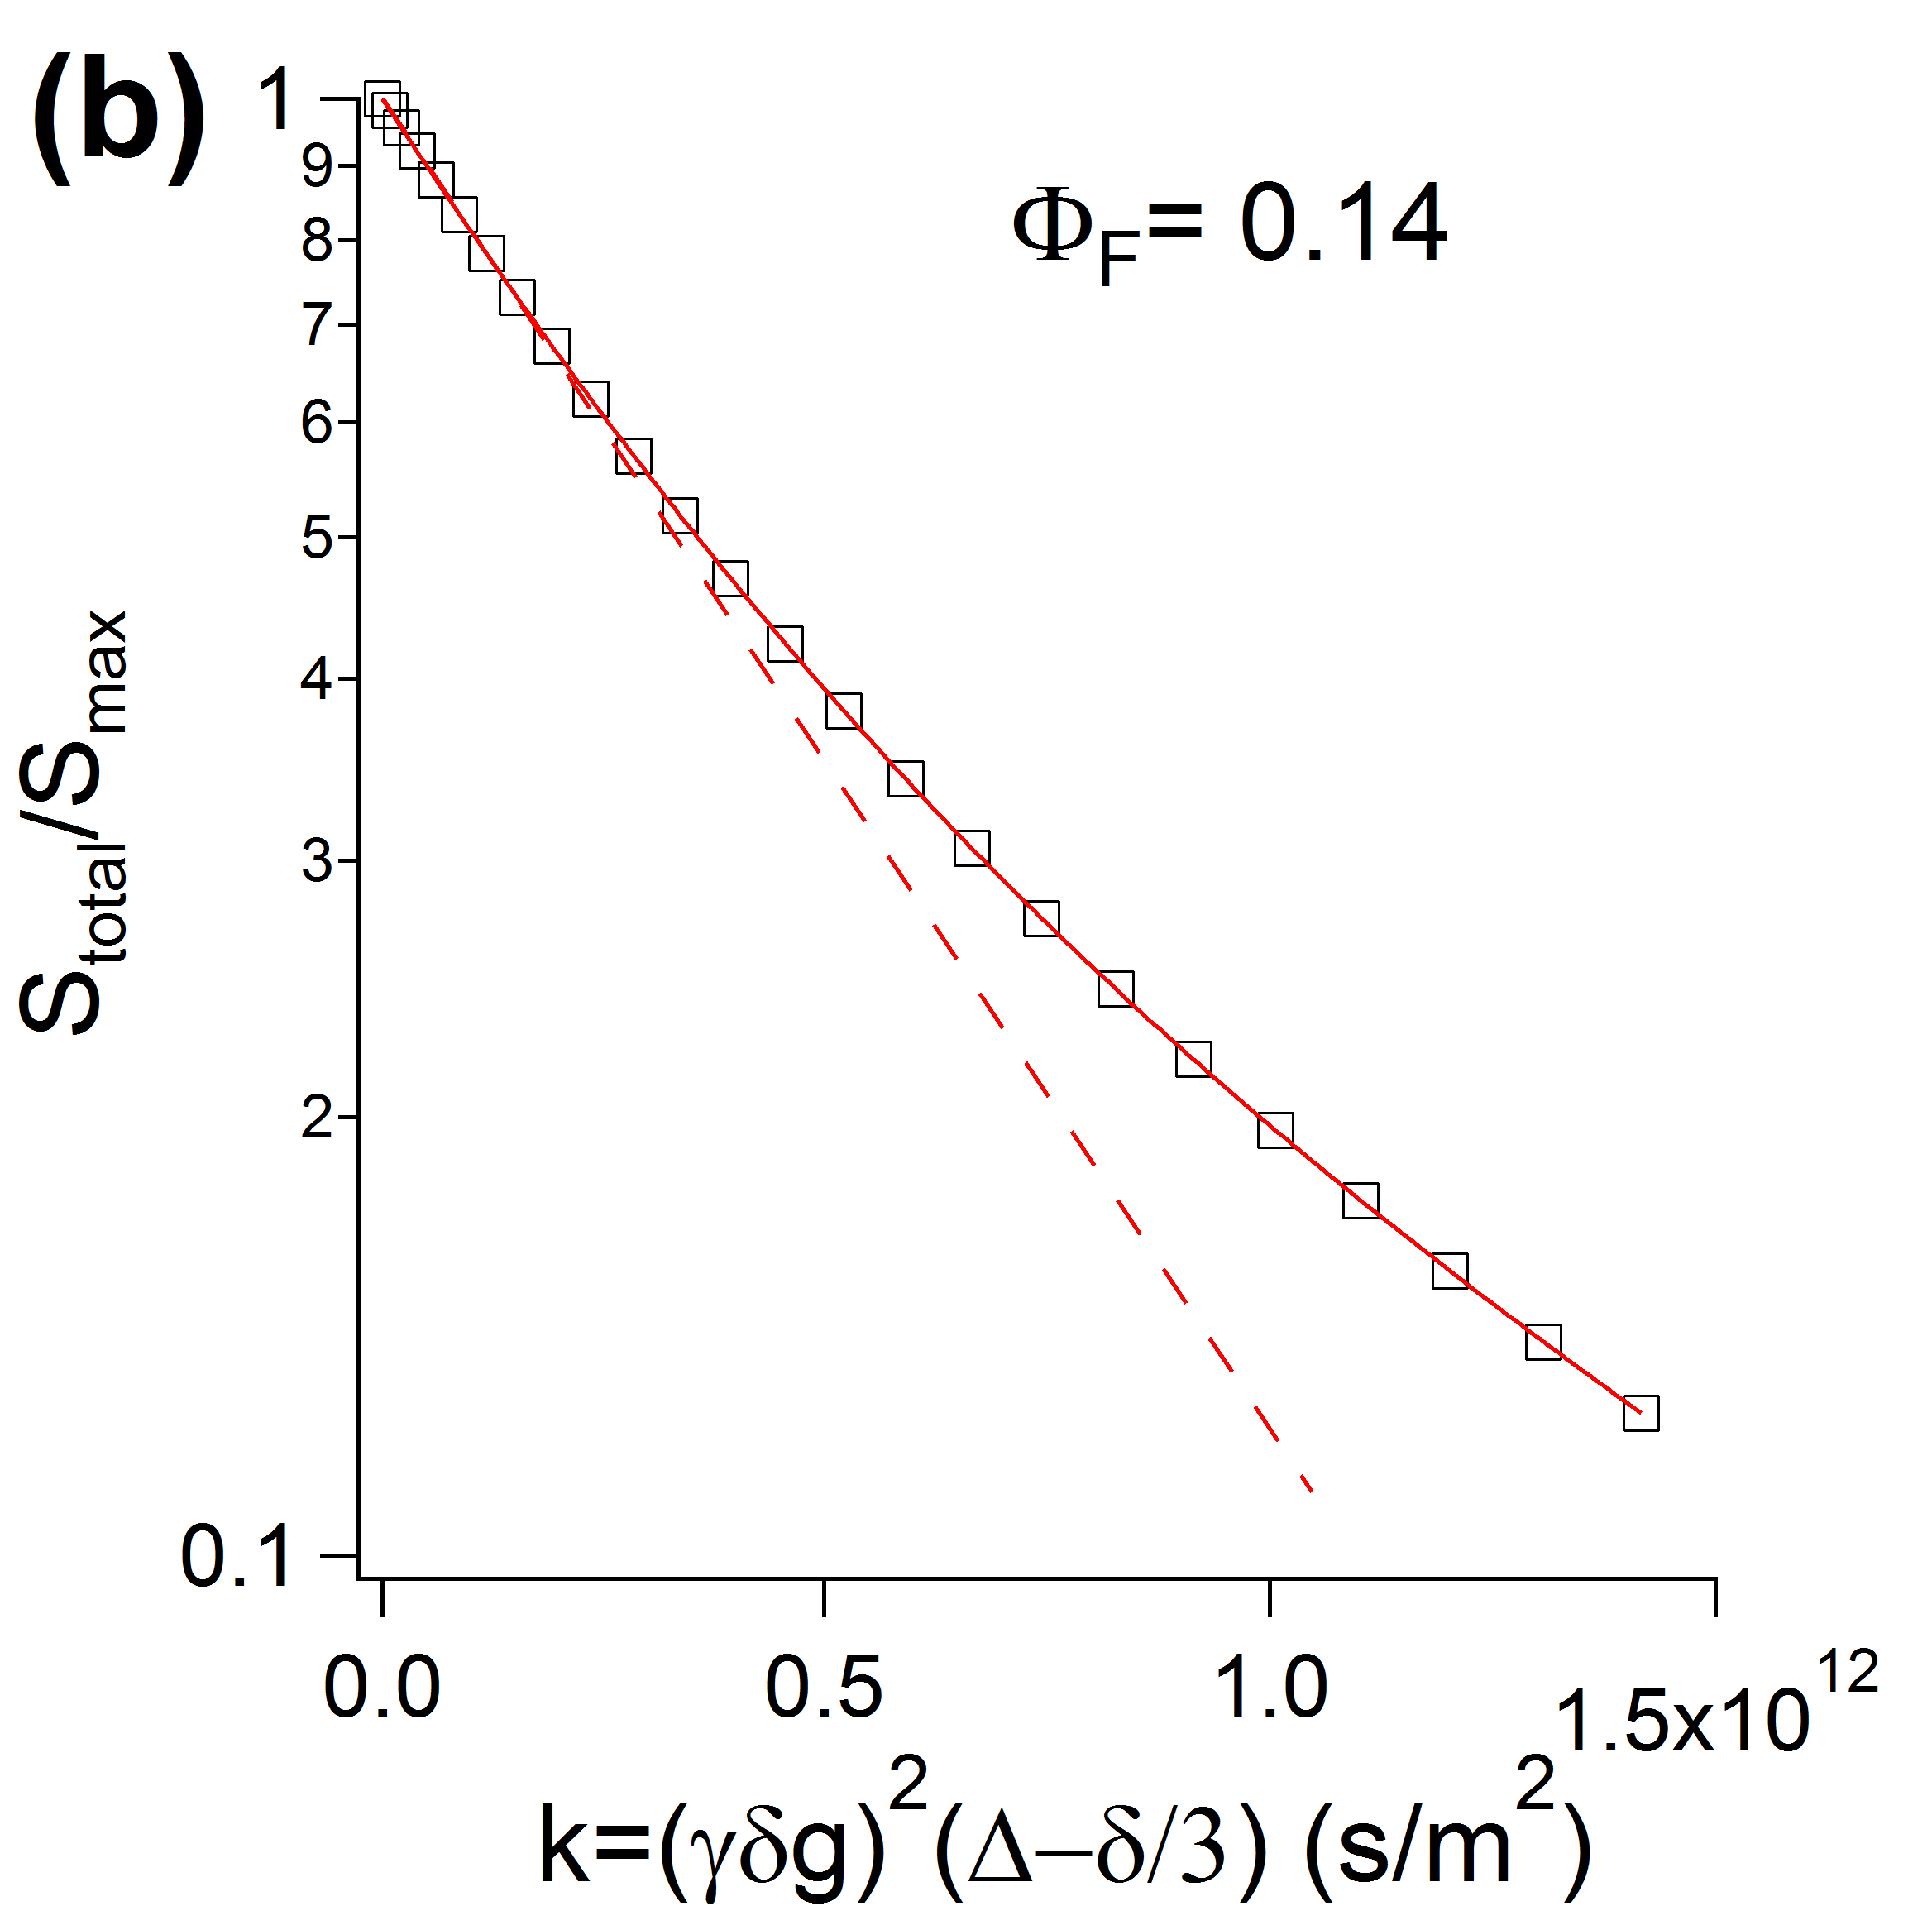
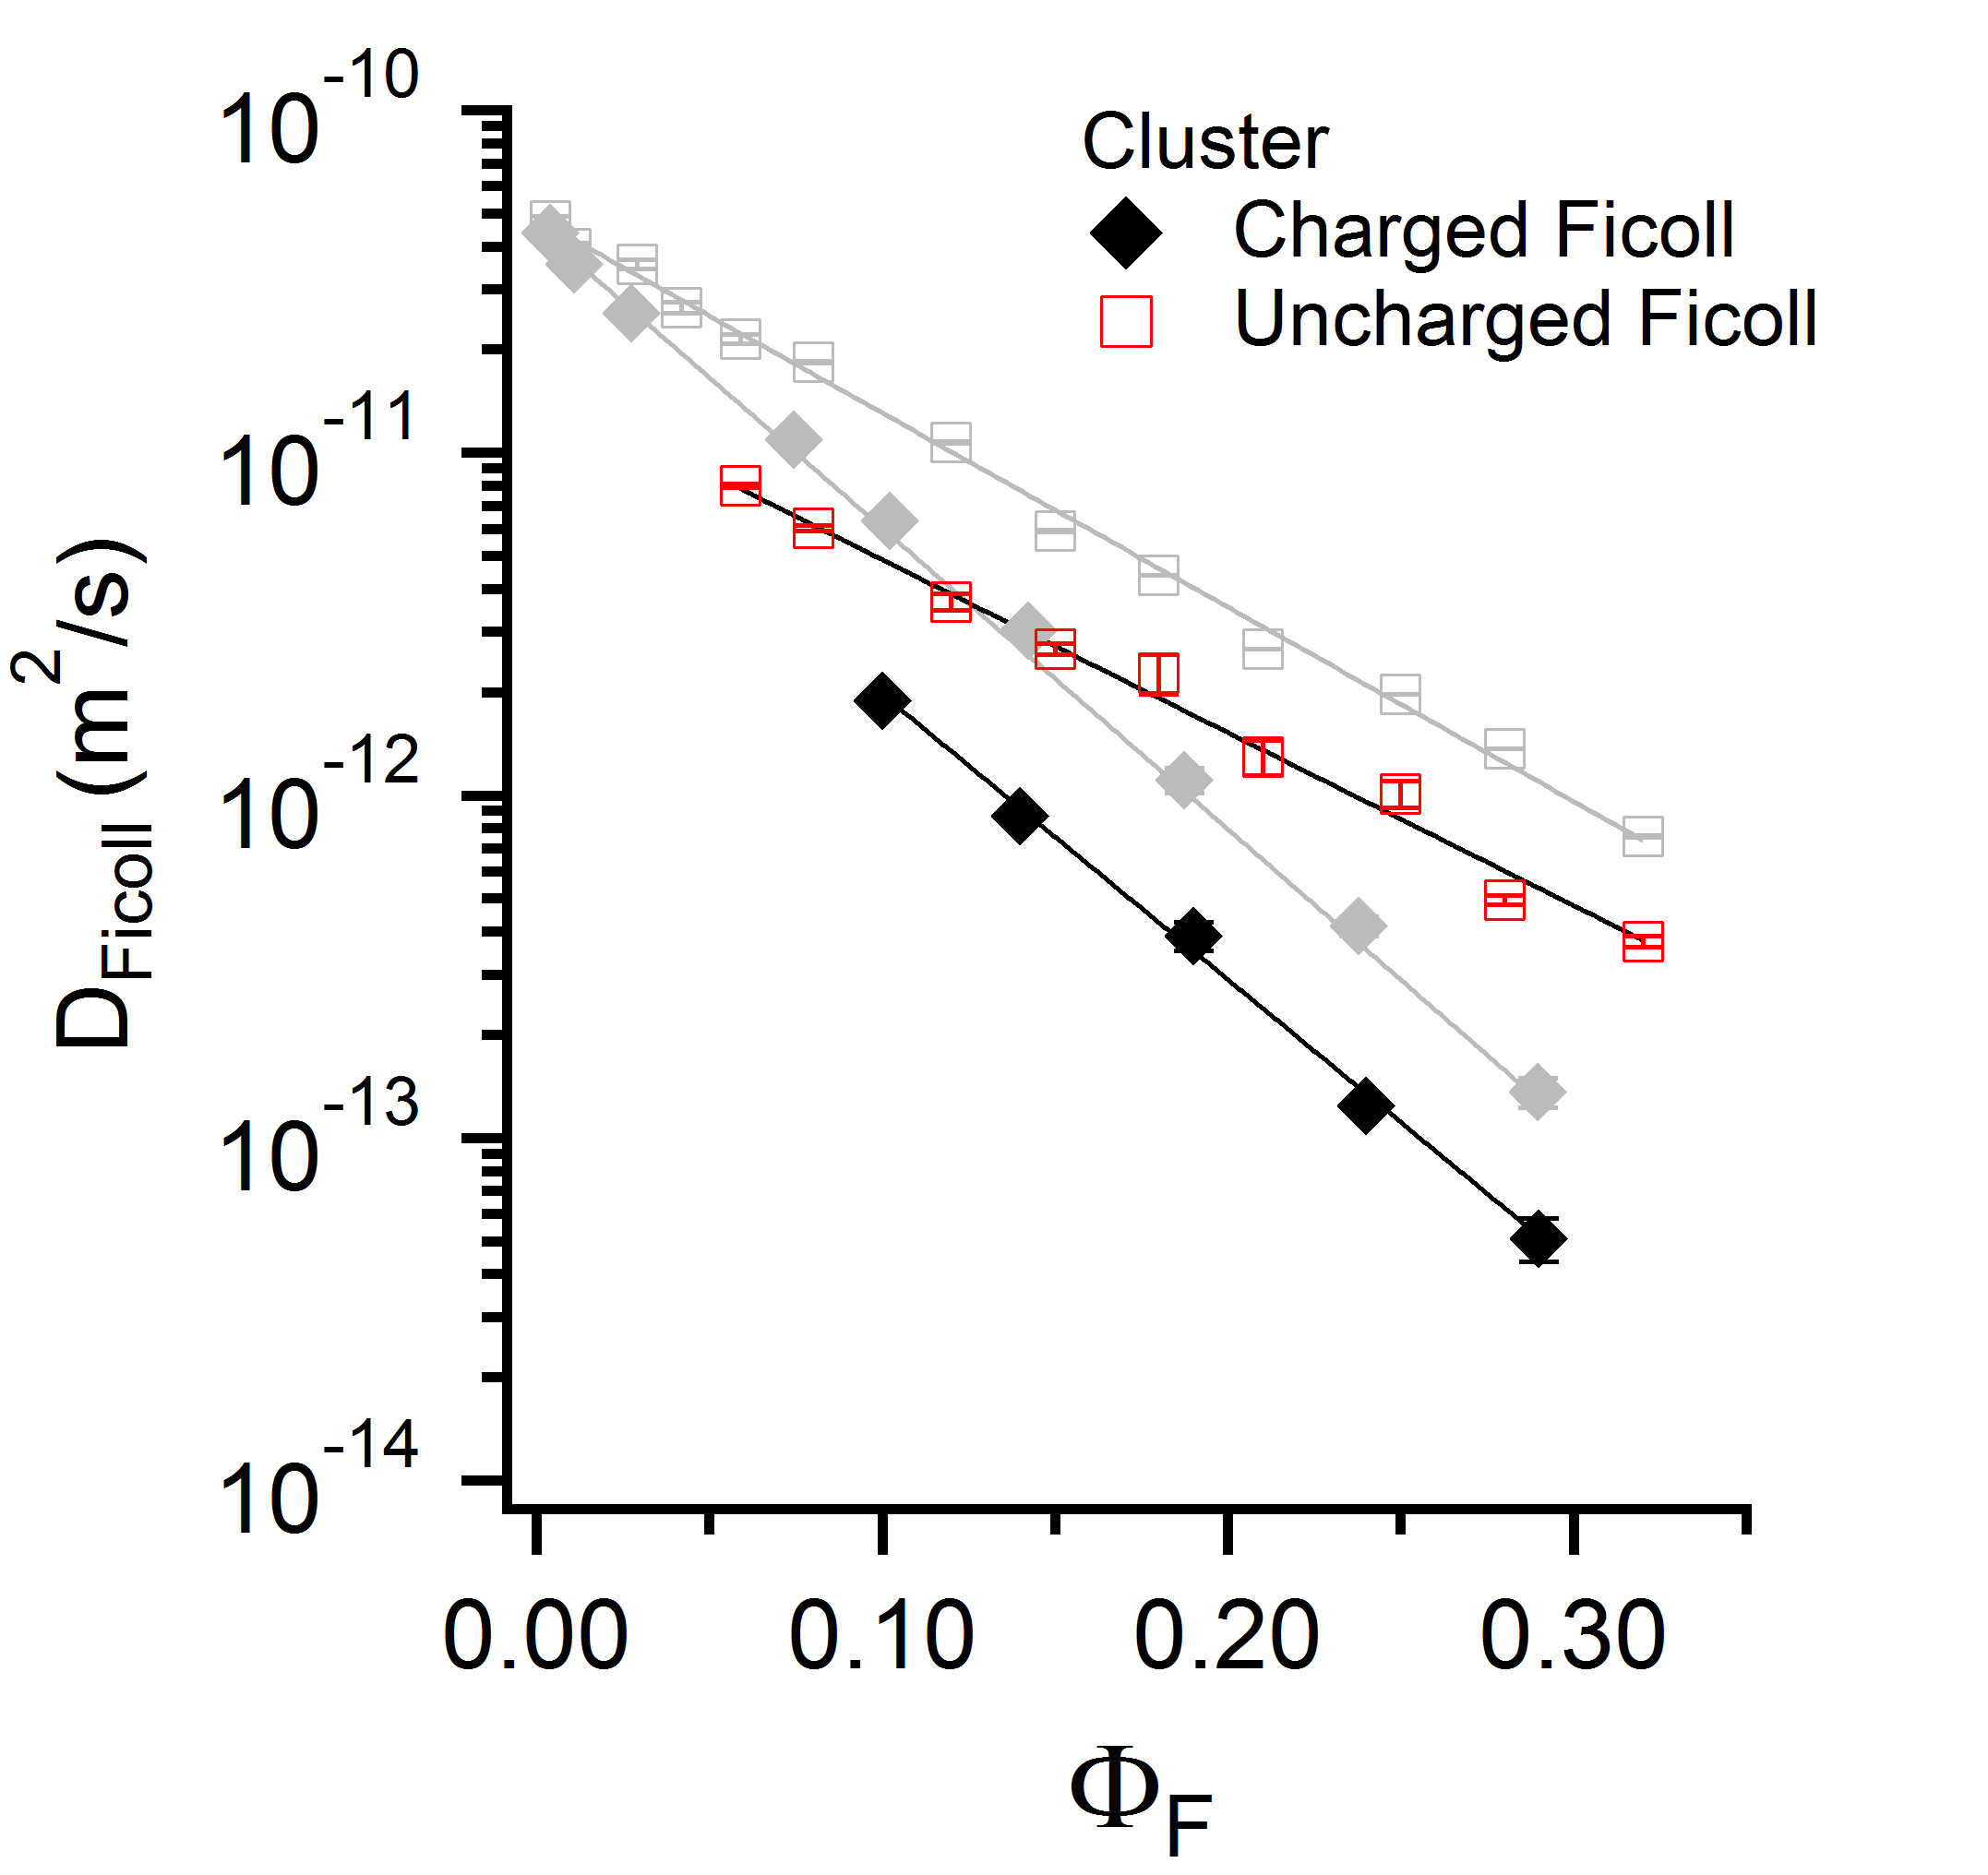
We plot the diffusion coefficients for charged and uncharged crowder, and for monomer (Figure 3(a)) and for cluster (Figure 3(b)), as a function of . Every dependence on is exponential! As discussed in earlier Palit et al. (2017a) and companion Palit et al. (2017b) works, the work of Rosenfeld Rosenfeld (1977) and Dzugutov Dzugutov (1996) connected structural properties of atomic fluids to their diffusion coefficients. Both studies have proposed an exponential relationship between atomic diffusion and the excess entropy (in the 2-particle approximation); moreover, recent 2D simulations and colloids experiments Thorneywork et al. (2015) show that is proportional to the colloid packing fraction for packing fractions less than 0.4. The same connection would hold in colloidal suspensions if hydrodynamics is not important in the long-time limit.
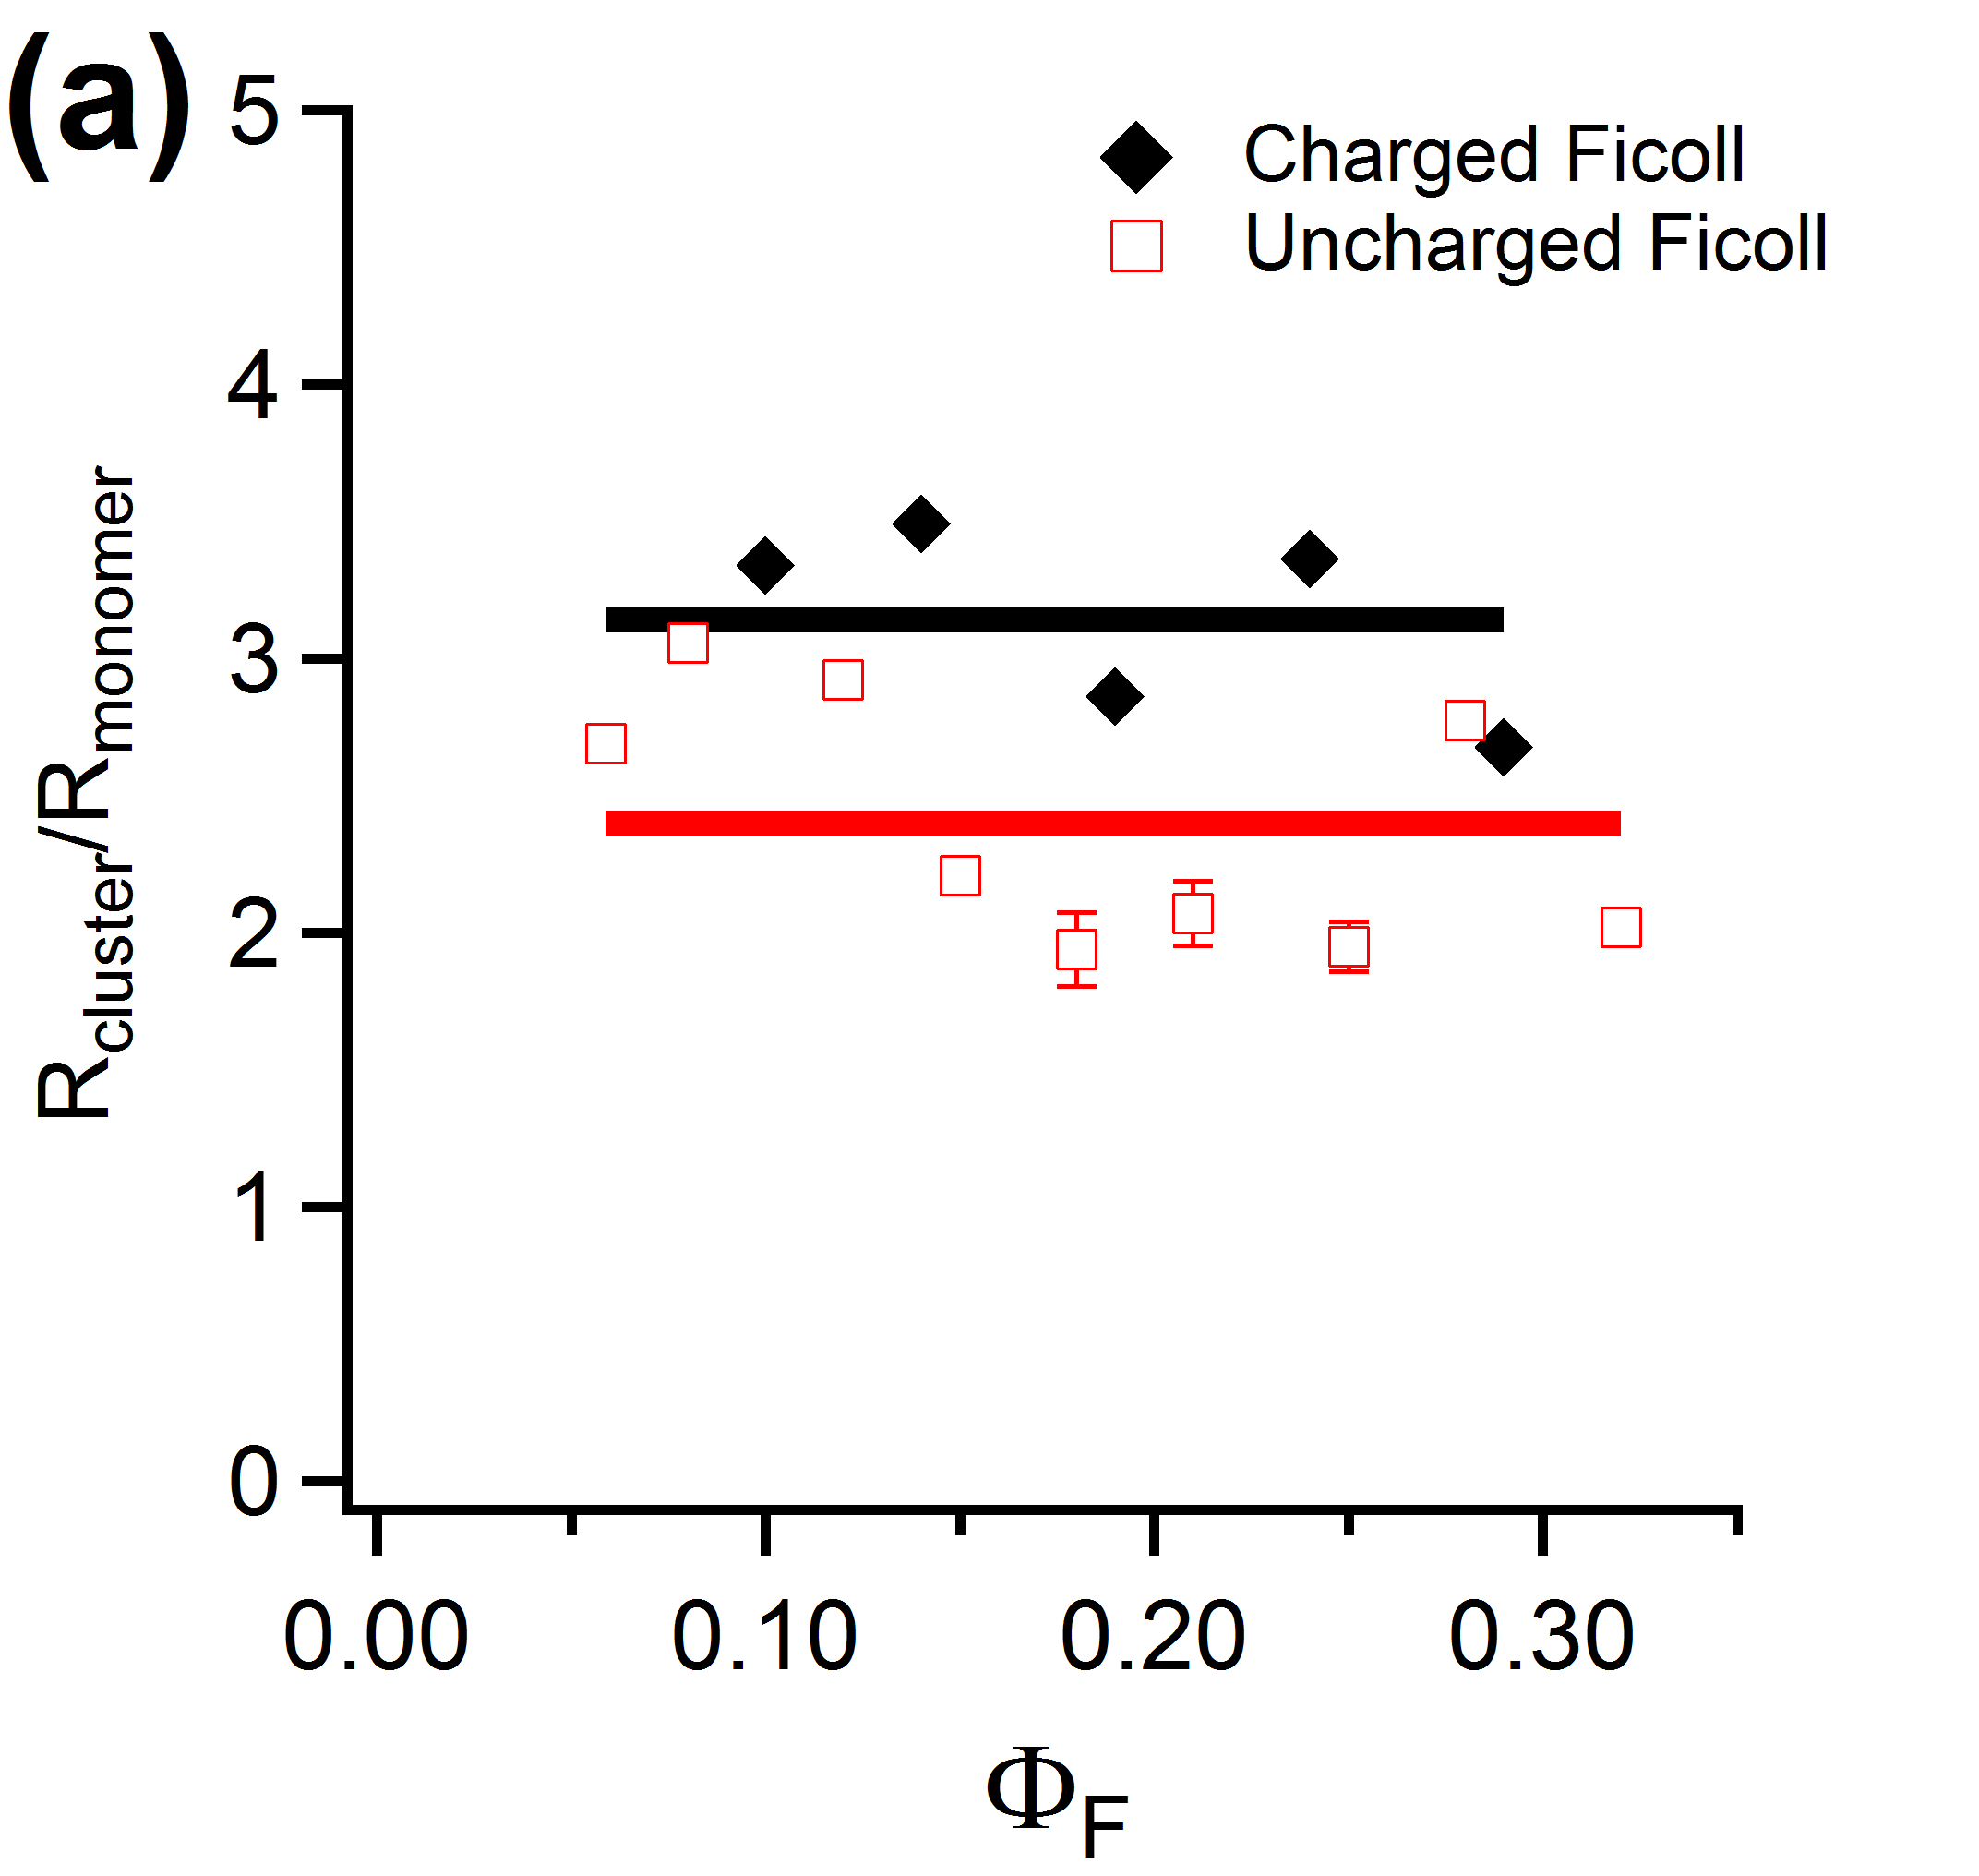
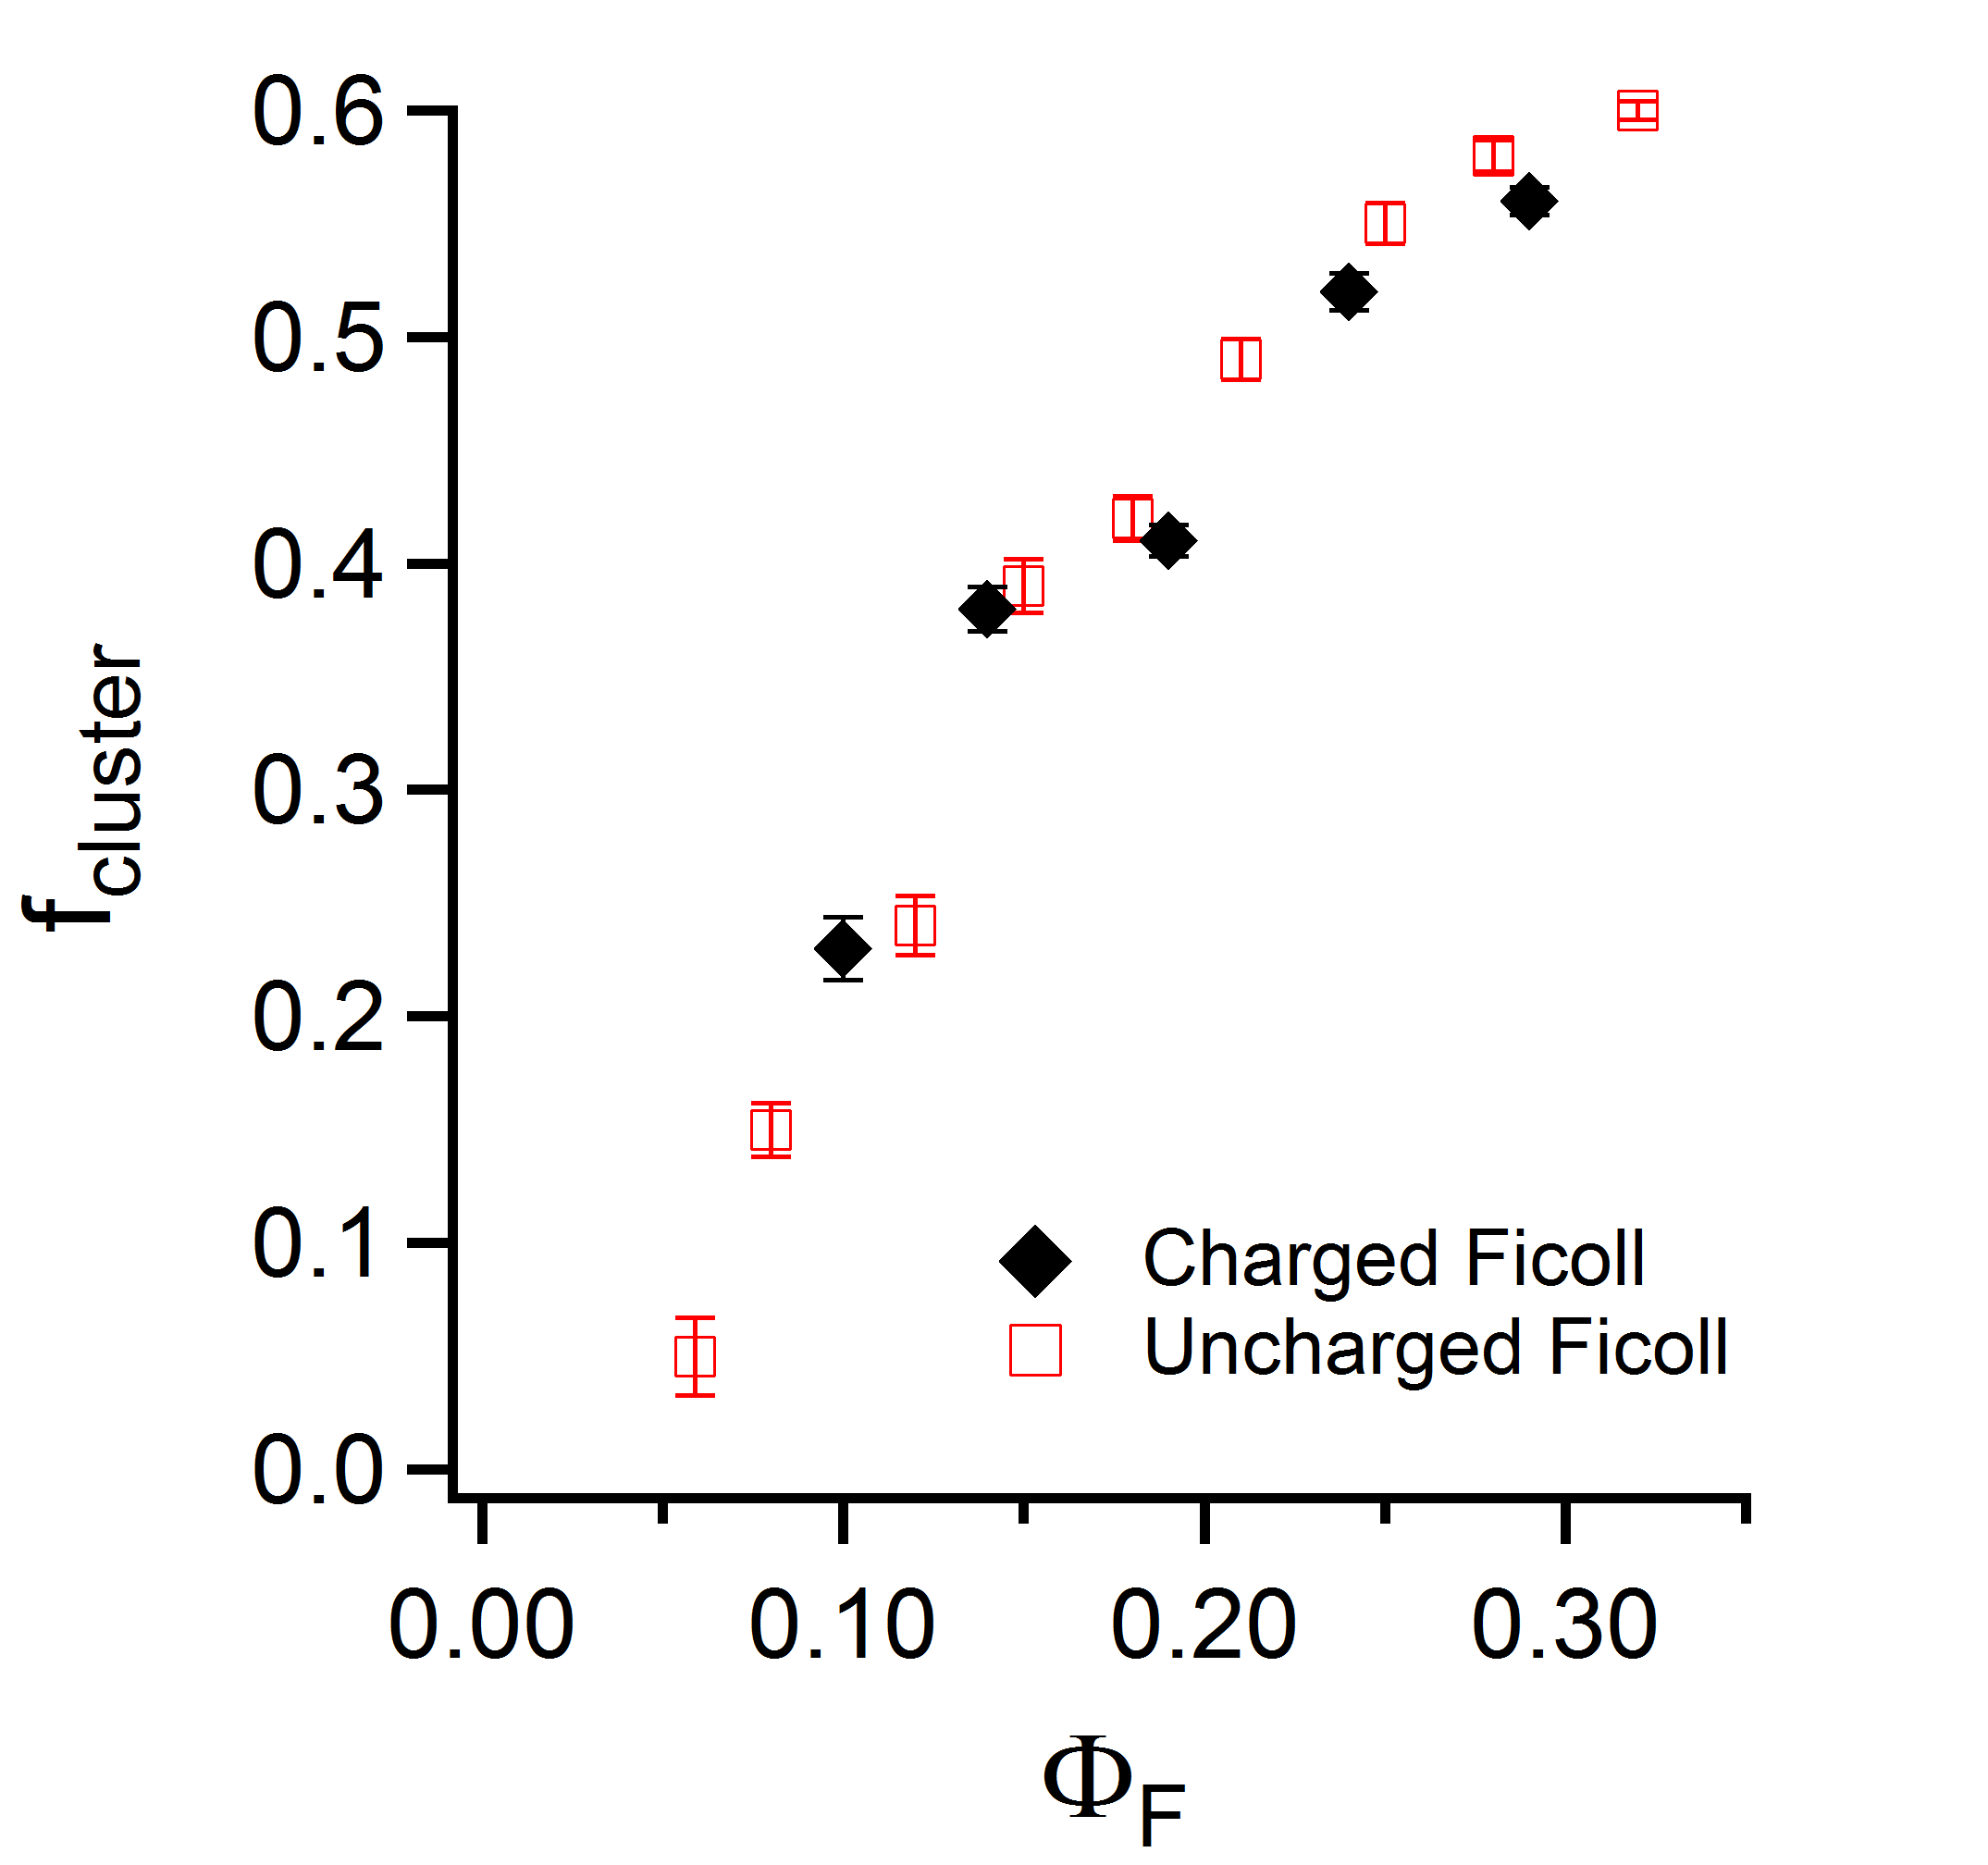
From the ratio of monomer and cluster diffusion coefficient at each packing fraction , we can make a crude estimate of the size of the cluster. This is estimated assuming , i.e., that the local micro-environment for monomer and cluster are identical. For uncharged Ficoll70, Georgalis et. al. measured the value of . Georgalis et al. (2012) The cluster-to-monomer size ratio (Figure 4(a)) shows no clear dependence on , but appears somewhat larger for charged Ficoll70 than for uncharged Ficoll70. The fraction of clusters (shown in Figure 4(b)) increases from 5% at onset of clustering to in the crowding regime: in fact, this fraction is very similar for charged and uncharged crowder.
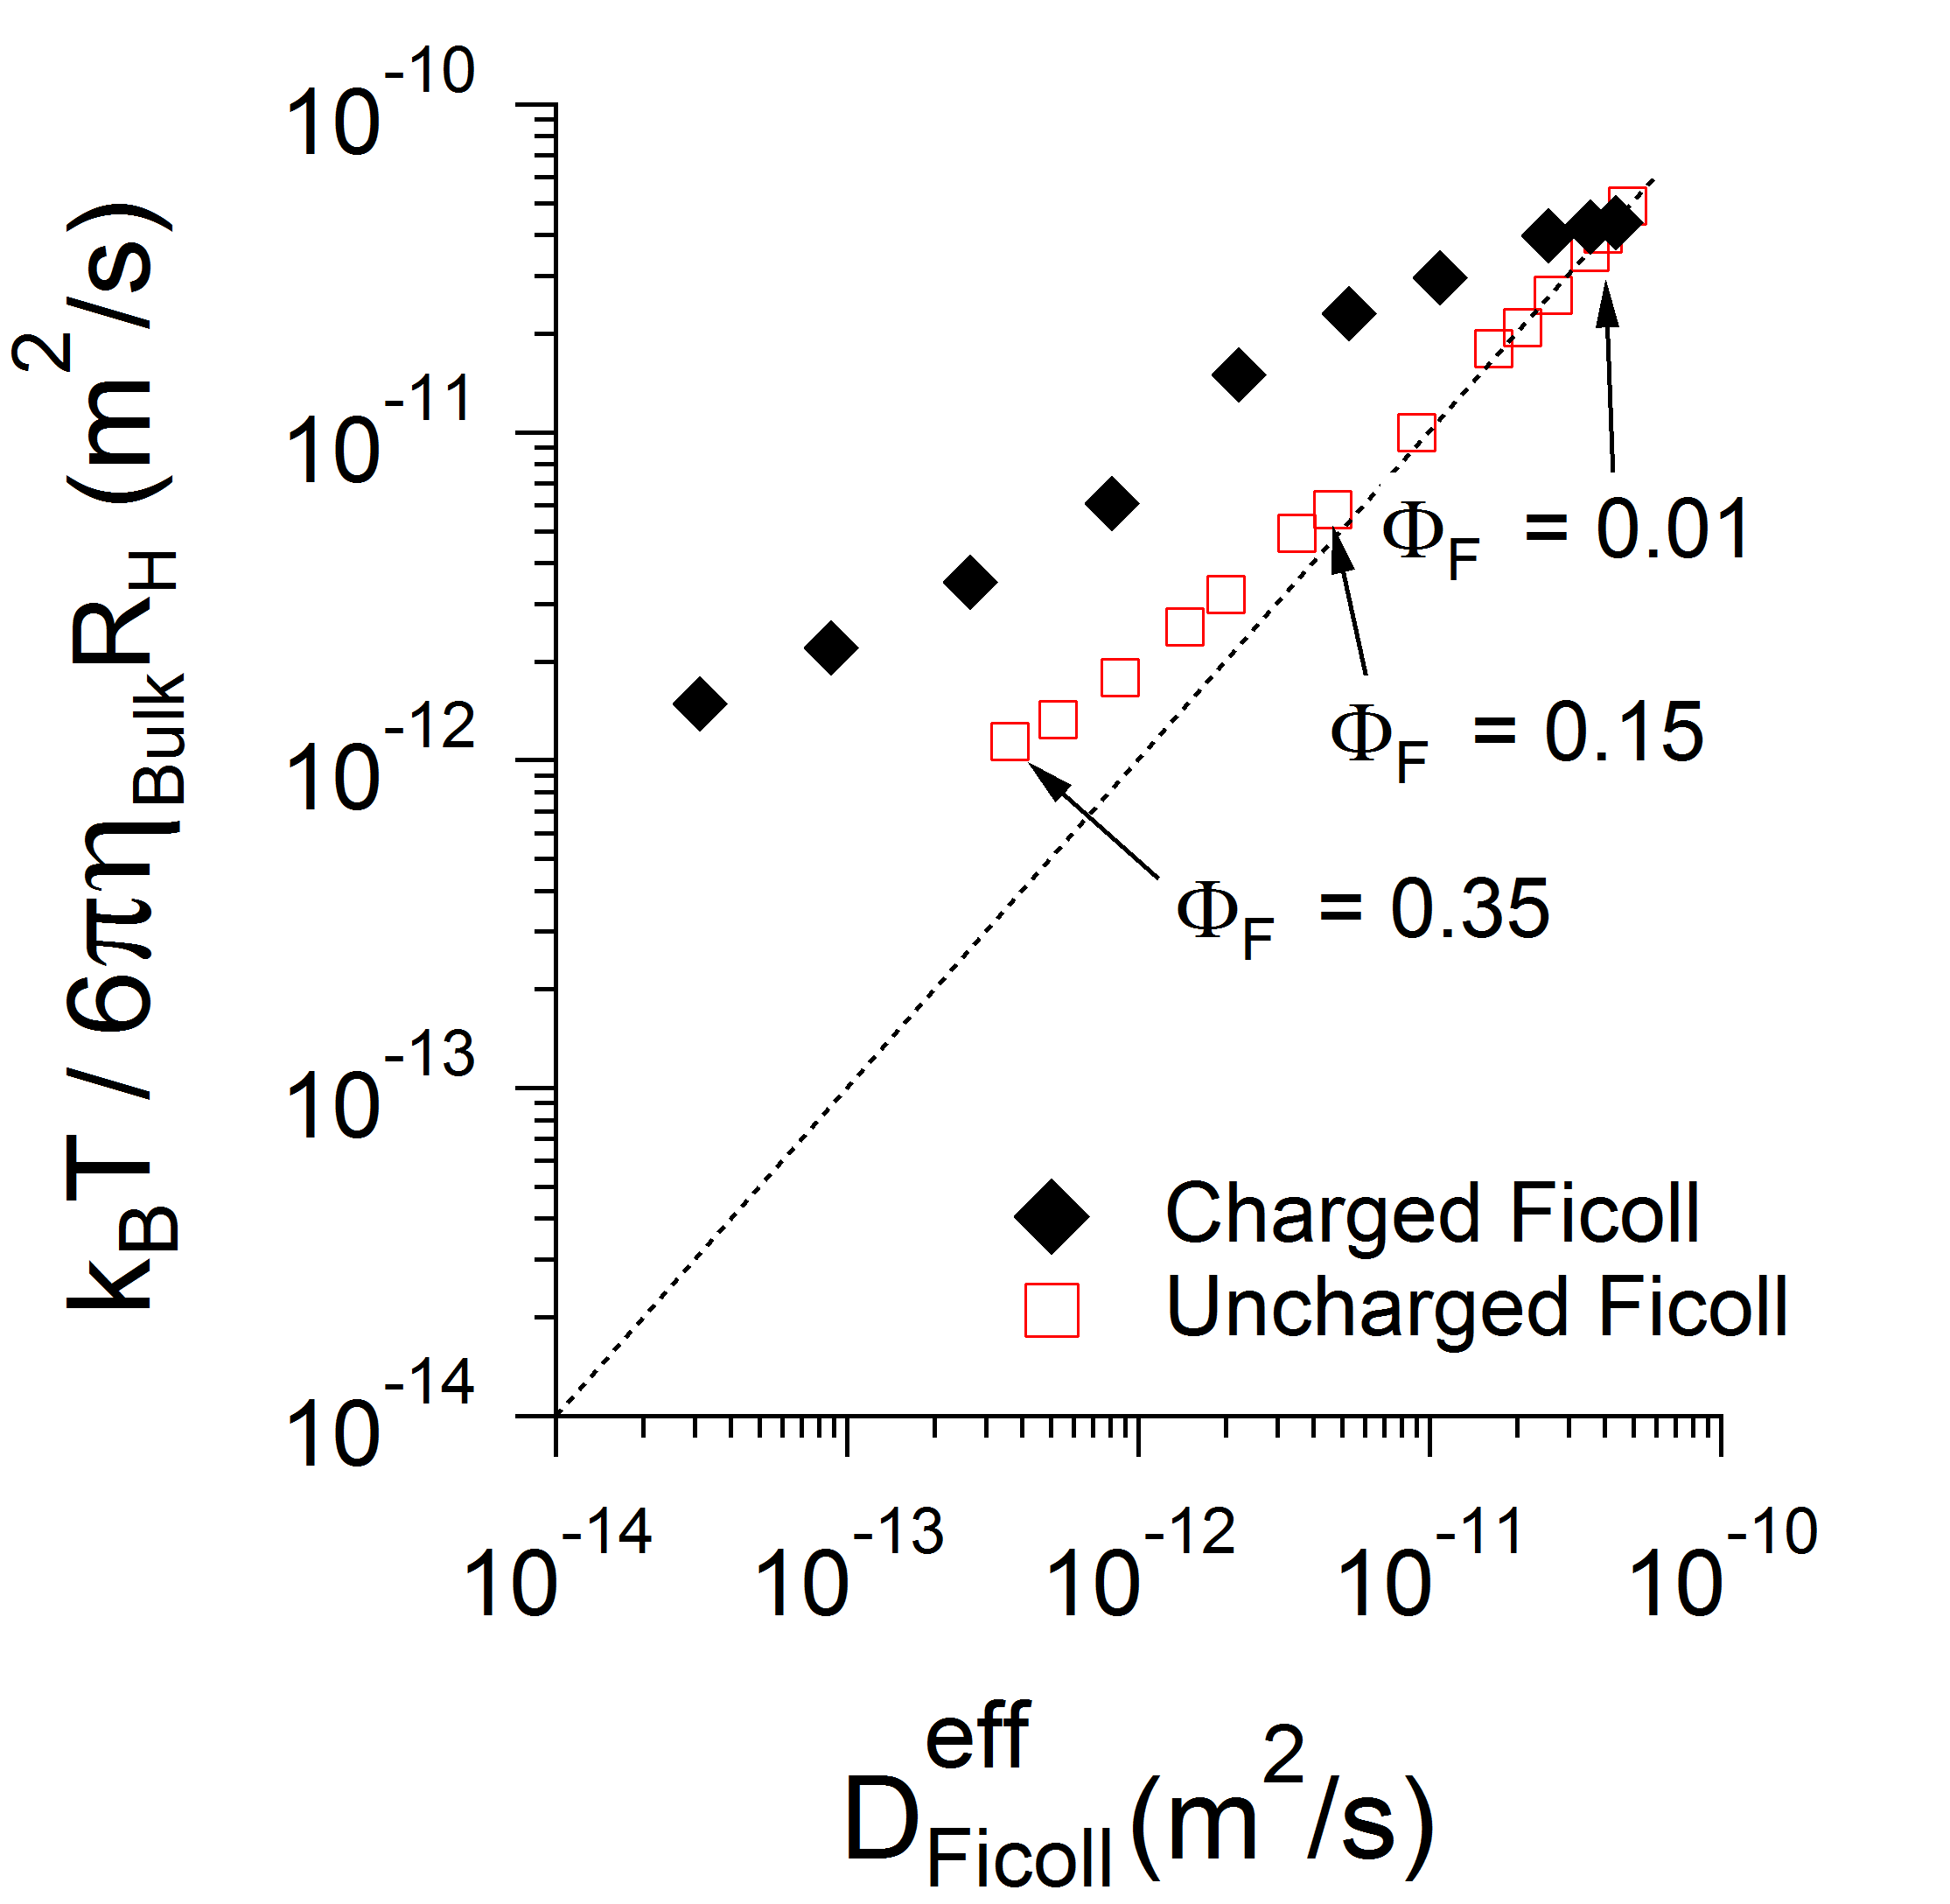
One can use the measured monomer and cluster self-diffusivities to calculate an effective diffusion coefficient
| (3) |
This diffusivity may be compared to its bulk analog from the measured bulk Ficoll70 viscosity and the hydrodynamic radius of Ficoll70 monomer nm using a Stokes-Einstein form . A slope of 1 in the plot of versus would imply agreement with Stokes-Einstein behaviour (dashed line). As can be seen, there is agreement upto for uncharged Ficoll70, while for charged Ficoll70 there is significant deviation for much smaller . Even for uncharged Ficoll70 solutions, there is significant deviation for .
IV.2 Ficoll is porous
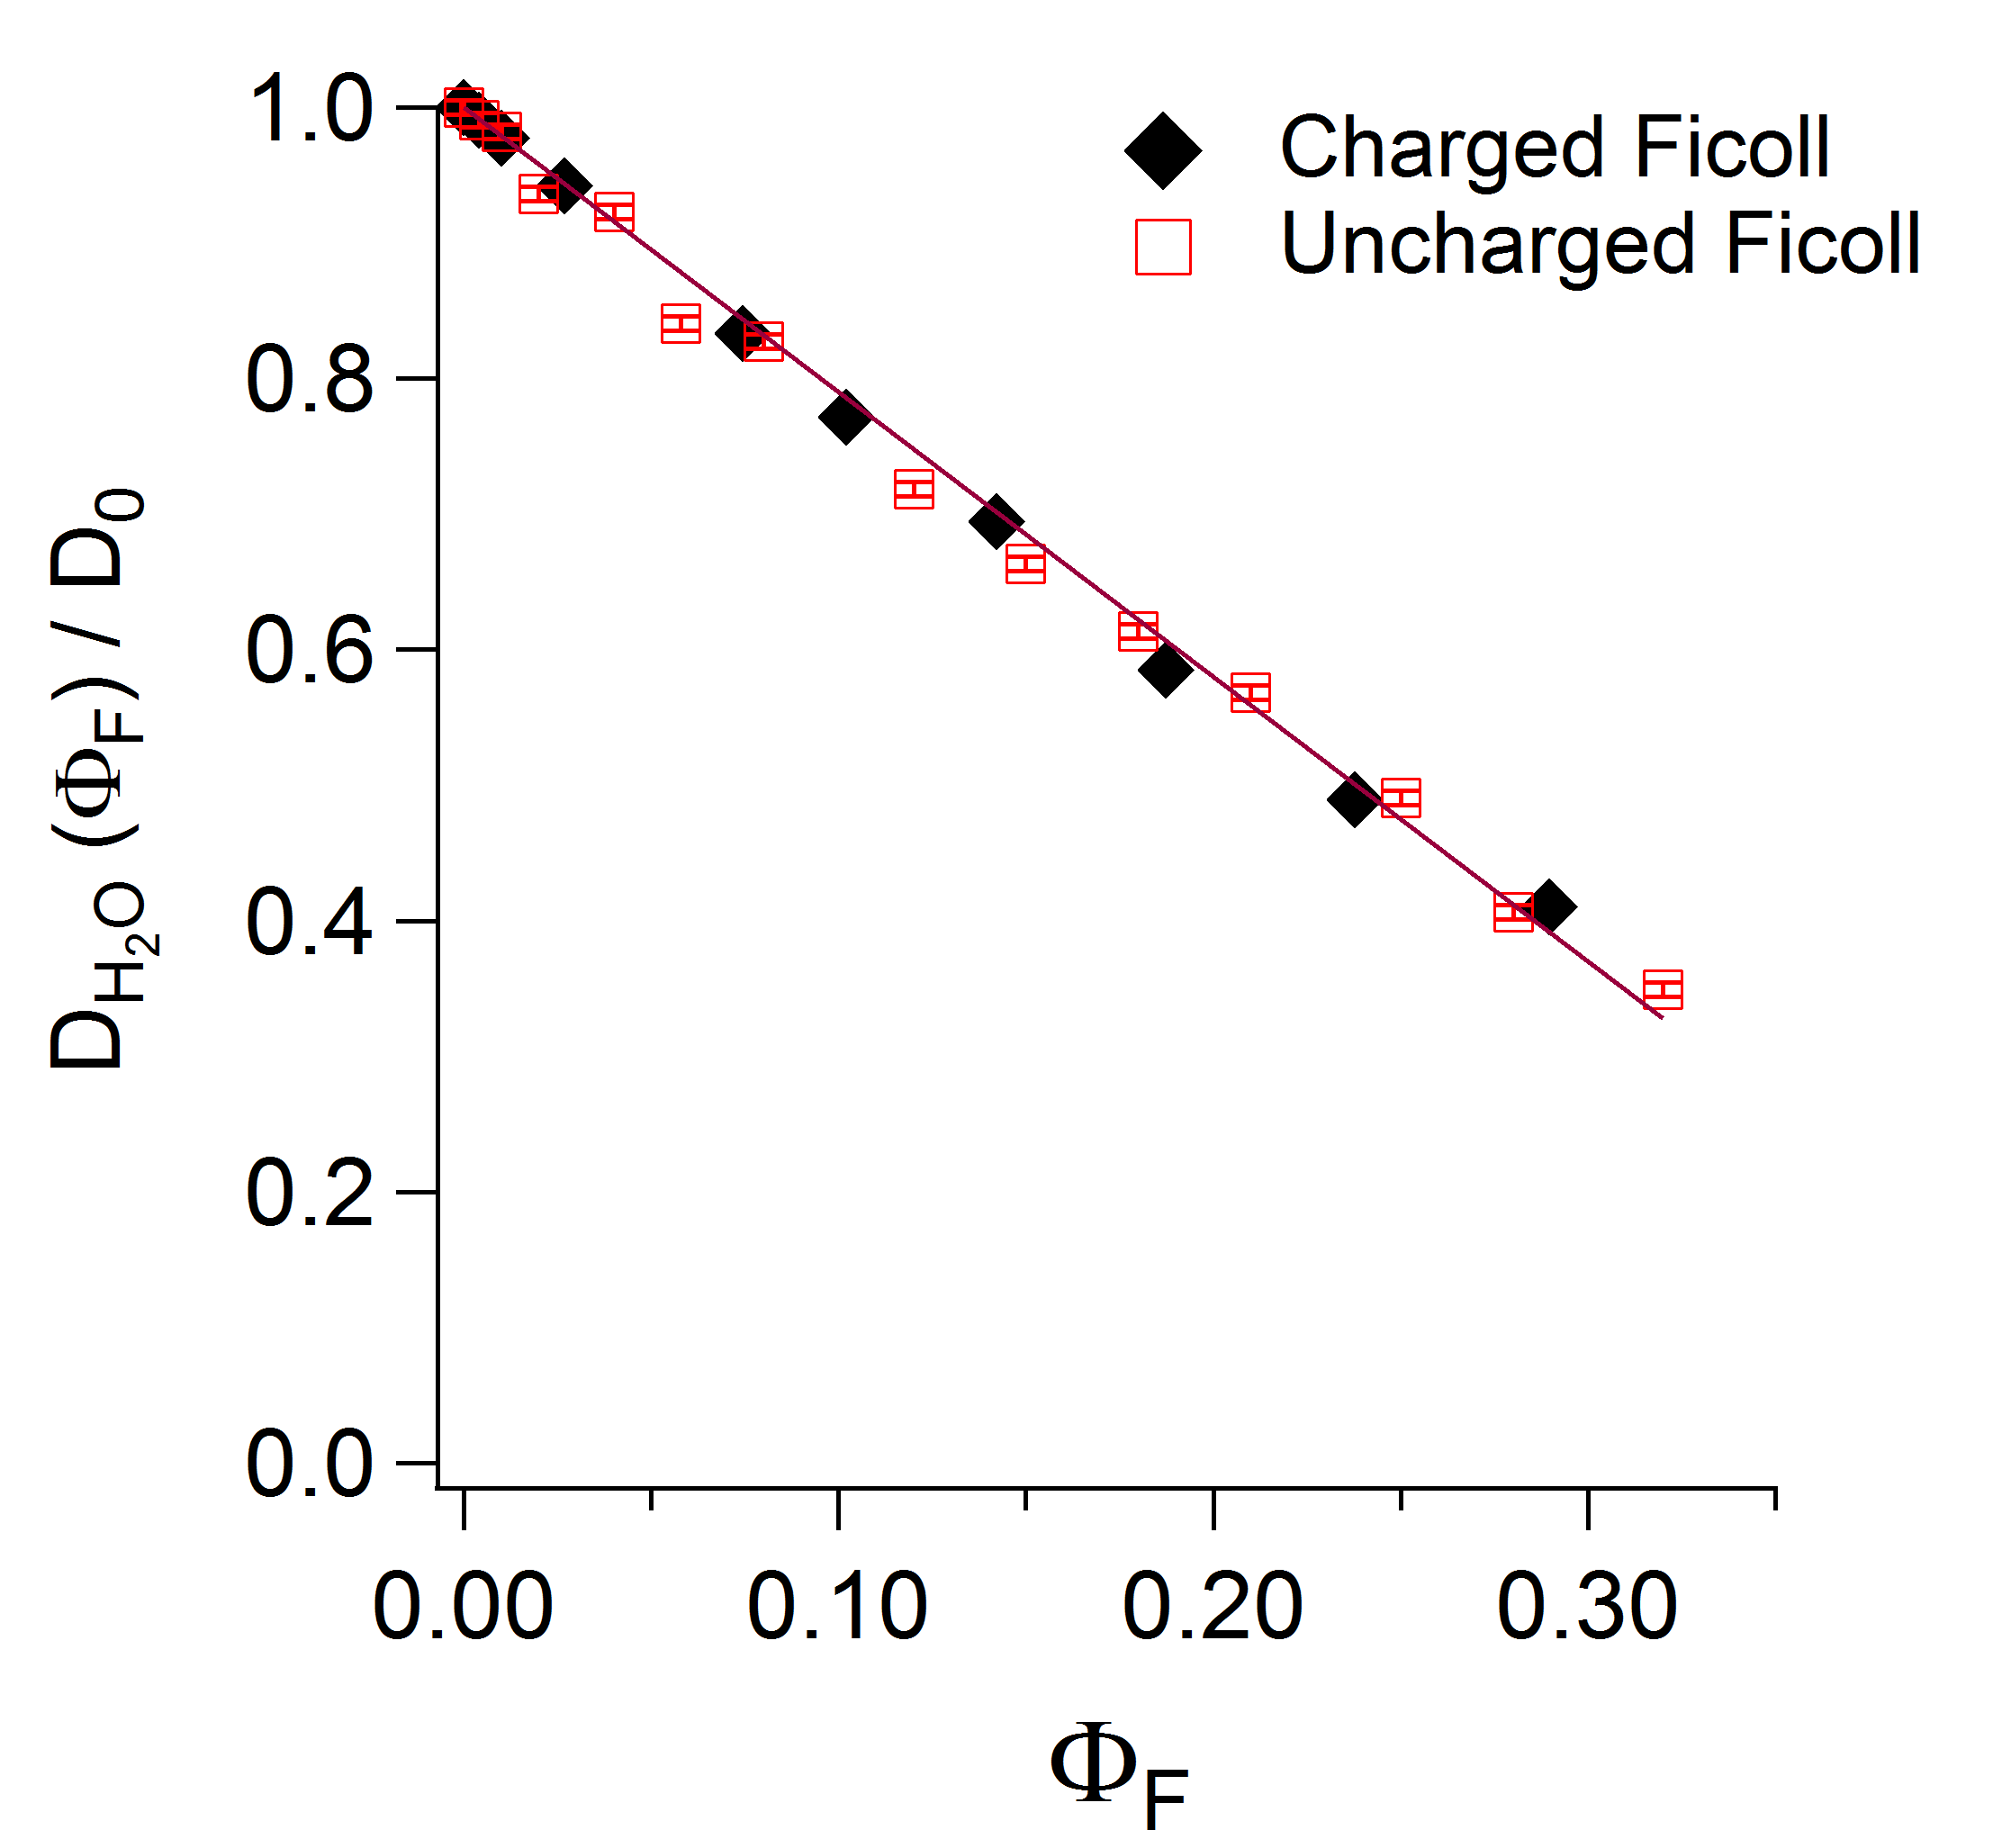
Another interesting aspect is the water diffusion coefficient. The similarity of the water diffusion for charged and uncharged Ficoll70 in Figure 6 is reassuring, as it indicates that the physical structure of the polysucrose is unchanged by the charge. A linear decrease in water diffusion coefficient is observed with increasing , which indicates a fraction of surface-associated water , shown in Figure 6, that scales with crowder packing fraction. For solid, spherical colloids the fraction of “bound water” would be expected to scale with the total surface area of the particles, not the volume. The high degree of linearity in Figure 6 with a fit to , with implies that the Ficoll70 is a porous particle and contains a significant amount of water inside its polysucrose matrix.
At , as much as 60% of the water is surface associated, suggesting that Ficoll70 is highly porous. The porous nature of Ficoll70 is not surprising, in hindsight, but we believe that it has not been adequately recognized in the crowding literature, apart from clear indications that Ficoll70 is not a rigid sphere Fissell et al. (2007); Venturoli and Rippe (2005), as well as the practical knowledge about the lack of overall stability of Ficoll70 solutions above . It should be noted that this bound water is likely not available to the polymer, and should be accounted for in any free-volume calculations.
IV.3 The effect of PEG polymer on Ficoll diffusion
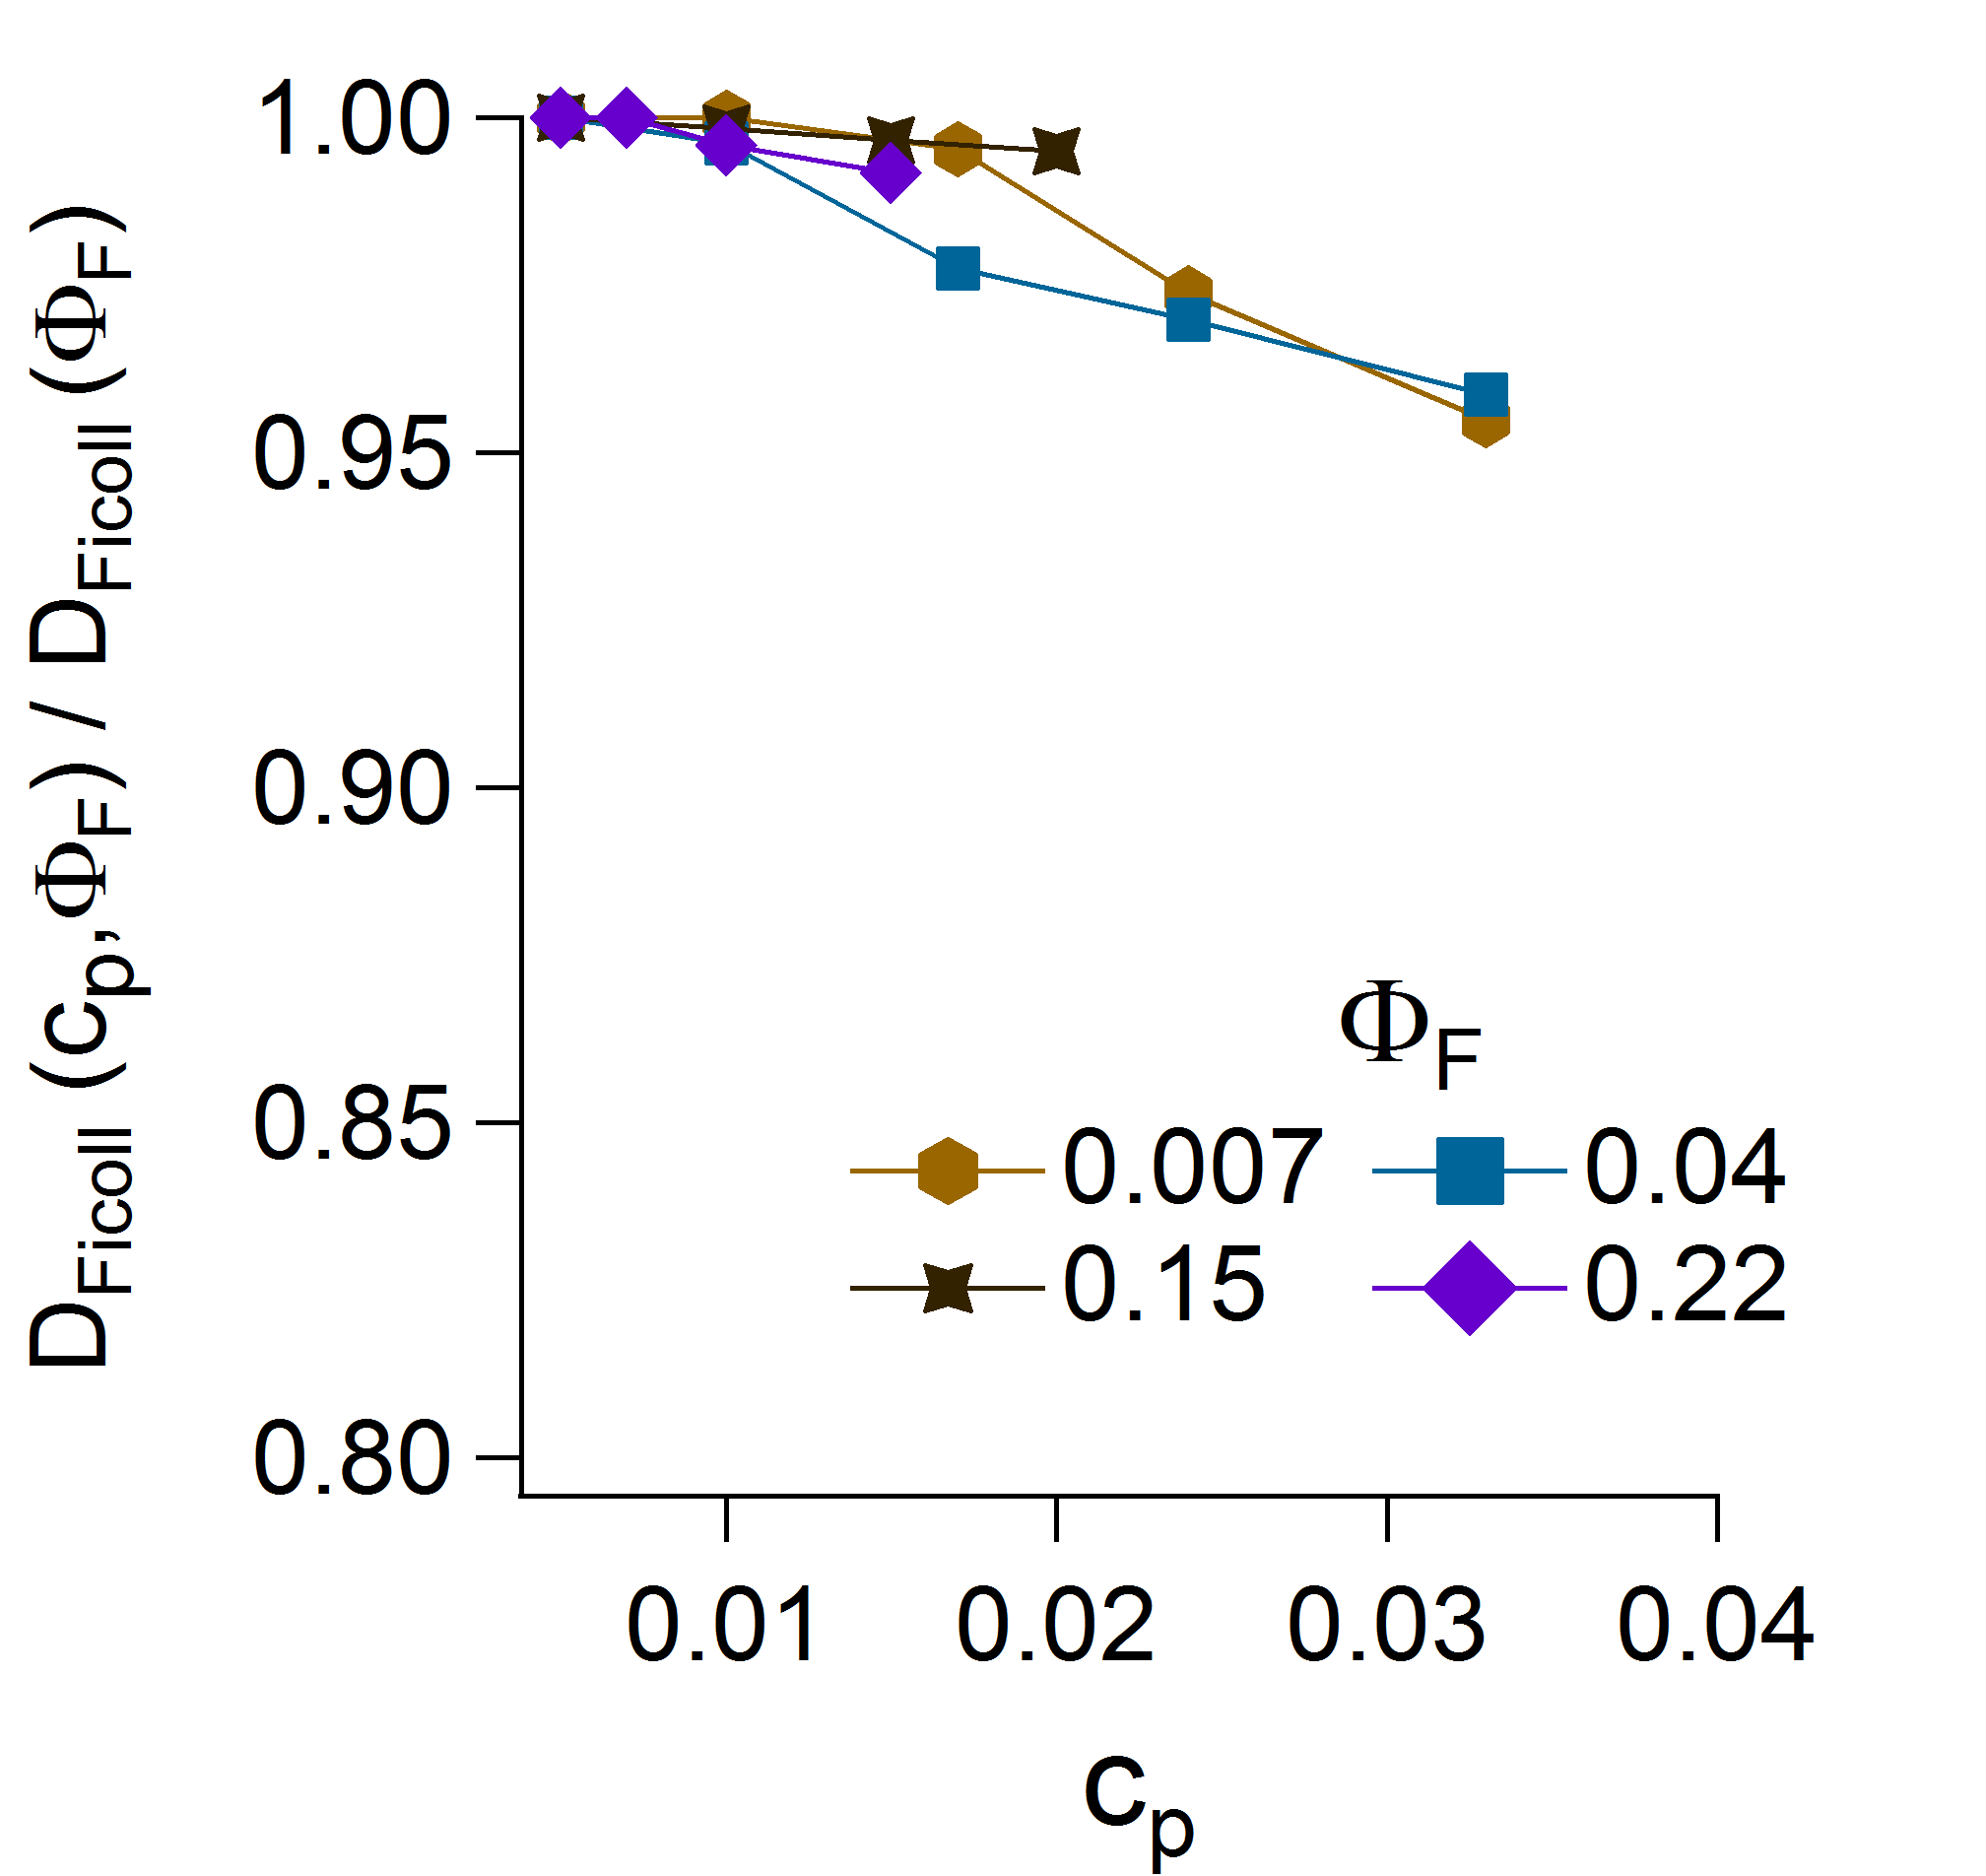
Figure 7 shows plots of the diffusion coefficient of Ficoll70 for different packing fraction , in the presence of small amounts of a polymeric macromolecule, polyethyelene glycol (PEG), in the concentration range . PEG is the macromolecule used in the companion work Palit et al. (2017b). A weak effect on Ficoll70 dynamics has been observed at the lowest and highest : this is reasonable because we have already inferred that the PEG and Ficoll70 do not associate with each other.
V Discussion and Conclusion
In this work, we examine the dynamics of Ficoll70 in water, for both uncharged and charged system. Ficoll70, an often-used artificial crowder, is not hard-sphere-like. This has been indicated elsewhere Fissell et al. (2007); Venturoli and Rippe (2005), but our water diffusion measurements suggest that 60% of the water is surface-associated in the crowding limit, indicating that the polysucrose particle is highly porous. Even more surprisingly, Ficoll70 diffusivity is bi-modal, indicating that it self-clusters at modest concentrations, with cluster sizes approaching 2 to 3 times the size of the single Ficoll70 particle size (“monomer”). This is reminiscent of indications, from maximum entropy analyses of fluorescence correlation spectroscopy experiments, of multiple modes of probe mobility in crowded solutions. Goins, Sanabria, and Waxham (2008)
Coexistence of monomers and clusters in equilibrium has been seen experimentally Stradner et al. (2004); Barhoum and Yethiraj (2010); Porcar et al. (2010), and is expected in systems which have short-ranged attractions and longer-ranged repulsions. Groenewold and Kegel (2001); Sweatman, Fartaria, and Lue (2014) Considering both the 5 nm particle scale and that polysaccharide surfaces in water have a Hamaker constant of Holmberg et al. (1997)), attractive forces should be relevant in the presence of even small long-ranged (e.g. electrostatic) repulsions, and is consistent with the observed weak clustering.
Acknowledgements.
This work was supported by the Natural Sciences and Engineering Research Council of Canada. We thank William Fissell for generously providing us with charged Ficoll70, and Arun Yethiraj, and Francesco Piazza for illuminating discussions.References
- Palit et al. (2017a) S. Palit, L. He, W. A. Hamilton, A. Yethiraj, and A. Yethiraj, Physical Review Letters 118, 097801 (2017a).
- Wang et al. (2012a) Y. Wang, M. Sarkar, A. E. Smith, A. S. Krois, and G. J. Pielak, Journal of American Chemical Society 134, 16614 (2012a).
- Wong et al. (2016) K. H. Wong, R. D. Sandlin, T. R. Carey, K. L. Miller, A. T. Shank, R. Oklu, S. Maheswaran, D. A. Haber, D. Irimia, S. L. Stott, et al., Scientific reports 6 (2016).
- Groszek et al. (2010) J. Groszek, L. Li, N. Ferrell, R. Smith, C. A. Zorman, C. L. Hofmann, S. Roy, and W. H. Fissell, American Journal of Physiology - Renal Physiology 299, F752 (2010).
- Fissell et al. (2007) W. H. Fissell, S. Manley, A. Dubnisheva, J. Glass, J. Magistrelli, A. N. Eldridge, A. J. Fleischman, A. L. Zydney, and S. Roy, American Journal of Physiology - Renal Physiology 293, F1209 (2007).
- Venturoli and Rippe (2005) D. Venturoli and B. Rippe, American Journal of Physiology - Renal Physiology 288, F605 (2005).
- Dhar et al. (2010) A. Dhar, A. Samiotakis, S. Ebbinghaus, L. Nienhaus, D. Homouz, M. Gruebele, and M. S. Cheung, Proceedings of the National Academy of Sciences 107, 17586 (2010).
- Wenner and Bloomfield (1999) J. R. Wenner and V. A. Bloomfield, Biophysical Journal 77, 3234–3241 (1999).
- Galan et al. (2001) A. Galan, B. Sot, O. Llorca, J. L. Carrascosa, J. Valpuesta, and A. Muga, Journal of Biological Chemistry 276, 957 (2001).
- Lavrenko, Mikriukova, and Okatova (1987) P. N. Lavrenko, O. I. Mikriukova, and O. V. Okatova, Analytical biochemistry 166, 287 (1987).
- Tokuriki et al. (2004) N. Tokuriki, M. Kinjo, S. Negi, M. Hoshino, Y. Goto, I. Urabe, and T. Yomo, Protein Science 13, 125 (2004).
- Wang et al. (2012b) Y. Wang, L. A. Benton, V. Singh, and G. J. Pielak, The Journal of Physical Chemistry Letters 3, 2703 (2012b).
- Zimmerman and Minton (1993) S. B. Zimmerman and A. P. Minton, Annual Review of Biophysics and Biomolecular Structure 22, 27 (1993).
- Bohrer, Patterson, and Carroll (1984) M. Bohrer, G. D. Patterson, and P. Carroll, Macromolecules 17, 1170 (1984).
- Deen, Bohrer, and Epstein (1981) W. Deen, M. Bohrer, and N. Epstein, AIChE Journal 27, 952 (1981).
- Oliver et al. (1992) J. D. Oliver, S. Anderson, J. L. Troy, B. M. Brenner, and W. Deen, Journal of the American Society of Nephrology 3, 214 (1992).
- Axelsson et al. (2011) J. Axelsson, K. Sverrisson, A. Rippe, W. Fissell, and B. Rippe, American Journal of Physiology-Renal Physiology 301, F708 (2011).
- Asgeirsson et al. (2007) D. Asgeirsson, D. Venturoli, E. Fries, B. Rippe, and C. Rippe, Acta Physiologica 191, 237 (2007).
- Rippe et al. (2006) C. Rippe, D. Asgeirsson, D. Venturoli, A. Rippe, and B. Rippe, Kidney international 69, 1326 (2006).
- Ohlson, Sörensson, and Haraldsson (2000) M. Ohlson, J. Sörensson, and B. Haraldsson, American Journal of Physiology - Renal Physiology 279, F84 (2000).
- Asgeirsson et al. (2006) D. Asgeirsson, D. Venturoli, B. Rippe, and C. Rippe, American Journal of Physiology-Renal Physiology 291, F1083 (2006).
- Öberg and Rippe (2014) C. M. Öberg and B. Rippe, American Journal of Physiology-Renal Physiology 306, F844 (2014).
- Fissell et al. (2010) W. H. Fissell, C. L. Hofmann, R. Smith, and M. H. Chen, American Journal of Physiology-Renal Physiology 298, F205 (2010).
- Lavrenko, Mikryukova, and Didenko (1986) P. Lavrenko, O. Mikryukova, and S. Didenko, Polymer Science USSR 28, 576 (1986).
- Georgalis et al. (2012) Y. Georgalis, M. Philipp, R. Aleksandrova, and J. Krüger, Journal of colloid and interface science 386, 141 (2012).
- Palit et al. (2017b) S. Palit, L. He, W. A. Hamilton, A. Yethiraj, and A. Yethiraj, Journal of Chemical Physics , submitted (2017b).
- Groenewold and Kegel (2001) J. Groenewold and W. K. Kegel, The Journal of Physical Chemistry B 105, 11702 (2001).
- Stradner et al. (2004) A. Stradner, H. Sedgwick, F. Cardinaux, W. Poon, S. Egelhaaf, and P. Schurtenberger, Nature 432, 492 (2004).
- Barhoum and Yethiraj (2010) S. Barhoum and A. Yethiraj, The Journal of Physical Chemistry B 114, 17062 (2010).
- Porcar et al. (2010) L. Porcar, P. Falus, W.-R. Chen, A. Faraone, E. Fratini, K. Hong, P. Baglioni, and Y. Liu, The Journal of Physical Chemistry Letters 1, 126 (2010).
- Barhoum, Agarwal, and Yethiraj (2013) S. Barhoum, A. Agarwal, and A. Yethiraj, in New Challenges in Electrostatics of Soft and Disordered Matter, edited by D. Dean, J. Dobnikar, A. Naji, and R. Podgornik (Pan Stanford, 2013).
- Sweatman, Fartaria, and Lue (2014) M. B. Sweatman, R. Fartaria, and L. Lue, The Journal of Chemical Physics 140, 124508 (2014).
- Sörensson et al. (1998) J. Sörensson, M. Ohlson, K. Lindström, and B. Haraldsson, Acta physiologica Scandinavica 163, 83 (1998).
- Luby-Phelps et al. (1987) K. Luby-Phelps, P. E. Castle, D. L. Taylor, and F. Lanni, Proceedings of the National Academy of Sciences 84, 4910 (1987).
- Price (1997) W. S. Price, Concepts in Magnetic Resonance 9, 299 (1997).
- Barhoum, Palit, and Yethiraj (2016) S. Barhoum, S. Palit, and A. Yethiraj, Progress in Nuclear Magnetic Resonance Spectroscopy 94-95, 1 (2016).
- Rosenfeld (1977) Y. Rosenfeld, Physical Review A 15, 2545 (1977).
- Dzugutov (1996) M. Dzugutov, Nature 381, 137 (1996).
- Thorneywork et al. (2015) A. L. Thorneywork, R. E. Rozas, R. P. Dullens, and J. Horbach, Physical Review Letters 115, 268301 (2015).
- Goins, Sanabria, and Waxham (2008) A. B. Goins, H. Sanabria, and M. N. Waxham, Biophysical Journal 95, 5362 (2008).
- Holmberg et al. (1997) M. Holmberg, J. Berg, S. Stemme, L. Ödberg, J. Rasmusson, and P. Claesson, Journal of Colloid and Interface Science 186, 369 (1997).