A Multi-wavelength Study of the Turbulent Central Engine of the Low-mass AGN hosted by NGC 404
Abstract
The nearby dwarf galaxy NGC 404 harbors a low-luminosity active galactic nucleus (AGN) powered by the lowest-mass (¡ 150,000 M⊙) central massive black hole (MBH) with a dynamical mass constraint currently known, thus providing a rare low-redshift analog to the MBH “seeds” that formed in the early Universe. Here, we present new imaging of the nucleus of NGC 404 at 12–18 GHz with the Karl G. Jansky Very Large Array (VLA) and observations of the CO(2–1) line with the Atacama Large Millimeter/Submillimeter Array (ALMA). For the first time, we have successfully resolved the nuclear radio emission, revealing a centrally peaked, extended source spanning 17 pc. Combined with previous VLA observations, our new data place a tight constraint on the radio spectral index and indicate an optically-thin synchrotron origin for the emission. The peak of the resolved radio source coincides with the dynamical center of NGC 404, the center of a rotating disk of molecular gas, and the position of a compact, hard X-ray source. We also present evidence for shocks in the NGC 404 nucleus from archival narrowband HST imaging, Chandra X-ray data, and Spitzer mid-infrared spectroscopy, and discuss possible origins for the shock excitation. Given the morphology, location, and steep spectral index of the resolved radio source, as well as constraints on nuclear star formation from the ALMA CO(2–1) data, we find the most likely scenario for the origin of the radio source in the center of NGC 404 to be a radio outflow associated with a confined jet driven by the active nucleus.
1 Introduction and Motivation
Although our knowledge of galaxy evolution has made great strides over the past several decades, we still lack a complete understanding of the formation of the first galaxies. A number of lines of evidence, such as the effects of feedback from active galactic nuclei (AGNs) on the host galaxies in which they reside, strongly suggest that the formation and growth of galaxies and massive black holes (MBHs) are inextricably linked (Kormendy & Ho, 2013; Heckman & Best, 2014). More specifically, AGN feedback is believed to contribute to the observed scaling relations between MBH and host galaxy properties, the regulation of cooling flows in clusters, galaxy-scale outflows, the suppression of SF, and the build-up of the red sequence of massive early-type galaxies (Croton et al., 2006; Fabian, 2012; Somerville & Davé, 2015; Volonteri et al., 2016). Determining the evolutionary impact of AGN feedback over cosmic time is therefore of great importance.
A key observational parameter in improving our understanding of the growth and evolution of MBHs and galaxies is the mass distribution of MBH “seeds” (Volonteri, 2010; van Wassenhove et al., 2010; Greene et al., 2012; Mezcua, 2017). The shape of this distribution at high redshift would help distinguish between different dominant MBH formation mechanisms (hierarchical merging vs. direct gas collapse), thus providing a strong constraint for cosmological simulations (e.g., Shirakata et al. 2016). Some progress has been made at high redshift with the detection of luminous quasars at , which argues for heavier MBH seed masses of M⊙ and/or super-Eddington accretion (e.g., Mortlock et al. 2011; Wu et al. 2015). However, high-redshift MBH mass estimates, along with detailed information on the properties of the host galaxy, are notoriously difficult to obtain.
Measurements of the properties and distribution of MBHs with M⊙ hosted by lower-mass galaxies at low redshifts may offer a more promising population for probing MBH seed formation observationally. A number of recent studies have sought to characterize this population in a statistical sense (e.g., Reines & Volonteri 2015; Mezcua et al. 2016), however, detailed studies of these objects capable of providing insights into MBH accretion and feedback physics are still rare, particularly at radio frequencies. Detections of radio continuum emission associated with low-mass ( M⊙) AGNs include NGC 4395 (Ho & Ulvestad, 2001; Wrobel et al., 2001; Wrobel & Ho, 2006), GH10 (Greene et al., 2006; Wrobel et al., 2008), and NGC 404 (Nyland et al., 2012).
NGC 404 is a nearby (D = Mpc; Karachentsev et al. 2002), dwarf S0 galaxy harboring a candidate accreting MBH with M⊙ ( stellar dynamics upper limit; Nguyen et al. 2017), making it the galaxy with the lowest-mass central MBH with a dynamical constraint known. A number of lines of evidence suggest that the putative MBH in the center of NGC 404 is actively accreting material. NGC 404 hosts the nearest low-ionization nuclear emission-line region (LINER) (Ho et al., 1997) believed to be powered in part by a low-luminosity active galactic nucleus (LLAGN; Binder et al. 2011). Additional evidence includes AGN-like nuclear mid-infrared emission line ratios (Satyapal et al., 2004), UV and optical continuum variability on timescales of decades (Maoz et al., 2005; Nguyen et al., 2017), variable hot dust emission at near-infrared wavelengths (Seth et al., 2010), the presence of an AGN power-law component in HST observations within the central 0.2′′ (Nguyen et al., 2017), and the identification of a hard X-ray nuclear point source characterized by a power-law spectrum (Binder et al., 2011).
Recent radio continuum observations also support the presence of an active nucleus. Nyland et al. (2012) detected a 5 GHz source in their sub-arcsecond-resolution () observations that is spatially-coincident with the location of the hard X-ray point source and the optical center of the galaxy, within the positional uncertainties. Assuming a common origin, they argued that the faint radio and hard X-ray emission, with and , respectively, could conceivably be produced by an X-ray binary, nuclear star formation, a single supernova remnant, or an LLAGN powered by the central low-mass MBH. They concluded that the most likely scenario for the origin of the radio and X-ray emission is an accreting MBH since the other explanations could not simultaneously explain the observed X-ray and radio emission, were inconsistent with the known conditions in the nucleus of NGC 404, or were statistically unlikely.
Follow-up very long baseline interferometric (VLBI) 1.5 GHz continuum observations of NGC 404 with sub-parsec-scale spatial resolution were carried out in 2012 with the Very Long Baseline Array (Project 12B-164; P.I. K. Nyland) and the European VLBI Network (EVN; Paragi et al. 2014). No radio emission was detected in either dataset at their respective sensitivities of 16 Jy beam-1 and 7 Jy beam-1. The brightness temperature limit implied by the EVN observations of Paragi et al. (2014) is 2 105 K, near the limit of 105 K (Condon, 1992) distinguishing compact starbursts ( 105 K) from AGNs ( 105 K).
| Date | Array | rms | Beam | B.P.A. | ||||
|---|---|---|---|---|---|---|---|---|
| (GHz) | (Jy beam-1) | (′′) | (degrees) | (mJy beam-1) | (mJy) | (W Hz-1) | ||
| (1) | (2) | (3) | (4) | (5) | (6) | (7) | (8) | (9) |
| 1.5 | 2011 April 11, 30 | B | 55 | 3.42 2.79 | 122 | 2.10 0.08 | 2.83 0.14 | 18.51 0.02 |
| 5.0 | 2011 July 9 | A | 16 | 0.39 0.32 | 103 | 0.25 0.01 | 0.66 0.06 | 17.88 0.04 |
| 7.5 | 2011 July 9 | A | 11 | 0.39 0.32 | 103 | 0.11 0.01 | 0.47 0.04 | 17.73 0.04 |
| 15.0 | 2014 February 24, 26 | A | 1.5 | 0.15 0.11 | 81 | 0.04 0.01 | 0.29 0.03 | 17.53 0.05 |
Note. — Column (1): Central observing frequency. Column (2): Observing date. Column (3): VLA array configuration. Column (4): Image rms noise. Column (5): Clean beam major minor axis. Column (6): Clean beam position angle. Column (7): Peak intensity. For the 1.5, 5.0, and 7.5 GHz data the peak intensity and error are measured using the JMFIT task in the Astronomical Image Processing System (AIPS) in which a fit to an elliptical Gaussian model is performed. The errors include a 3% uncertainty in the absolute flux density scale, added in quadrature. For the 15 GHz data, the intensity is measured using the IMSTAT task in CASA and the error is calculated as , where is the number of synthesized beams subtended by the source and is the peak intensity. Column (8): Total integrated flux density. The measurements and uncertainties were calculated in the same manner as described for the peak flux density in Column (7). Column (9): Spectral luminosity.
From a physical standpoint, the VLBA and EVN non-detections could be an indication that the emission detected previously in the center of NGC 404 at lower spatial resolution in Nyland et al. (2012) is not powered by MBH accretion. Another possibility is that the radio source is characterized by extended emission in the form of a radio outflow on scales intermediate to those probed by the existing radio observations. The fact that the detected 5 GHz emission was slightly extended ( 8.4 5.3 pc) compared to the synthesized beam (5.9 4.8 pc) lends some support to this possibility. This would also be consistent with the known radio-loud nature of NGC 404 (Nyland et al., 2012).
The VLBA and EVN continuum upper limits in the NGC 404 nucleus are precedented by observations of other low-mass AGNs in which radio sources were resolved-out when observed at milliarcsecond-scale spatial resolutions (though we note that due to the close proximity of NGC 404, the physical scale probed is much smaller than in most AGN). An example is the million-solar-mass MBH in the center of the dwarf starburst galaxy Henize 2-10 (Reines et al., 2011; Reines & Deller, 2012). Henize 2-10 was detected at (4–8 GHz) and (8–12 GHz) band at sub-arcsecond spatial resolution with the VLA, and is characterized by a classic core+jet radio AGN morphology. However, follow-up VLBA observations of Henize 2-10 failed to detect the central radio core at milliarcsecond-scale spatial resolution. Long Baseline Array observations with a spatial resolution intermediate to those of the previous radio studies proved successful (Reines & Deller, 2012) in detecting the compact nuclear radio source, emphasizing the importance of probing a wide range of spatial scales when studying weakly accreting MBHs in nearby dwarf galaxies.
Here, we report the results of new Karl G. Jansky Very Large Array (VLA) -band (12-18 GHz) continuum observations of NGC 404 that bridge the gap in spatial scales previously studied. We also present the detection of circumnuclear CO(2–1) emission with the Atacama Large Millimeter/Submillimeter Array (ALMA) at near-matched spatial resolution to the new VLA data. In Section 2, we describe our new VLA -band and ALMA CO(2–1) observations and data reduction. In Section 3, we discuss the properties of the resolved radio and CO(2–1) emission in the nucleus of NGC 404. In Section 4, we re-evaluate the origin of the resolved nuclear radio source. We examine evidence for the presence of shocks in the center of NGC 404 based on archival HST, Chandra, and Spitzer data, consider the possibility of localized AGN feedback, and discuss the implications of this work on our understanding of galaxy evolution in Section 5. We summarize our results and suggest future areas of research in Section 6.
2 Data
2.1 VLA
NGC 404 was observed with the VLA at band (12-18 GHz) in the A-configuration on February 24 and 26, 2014 (project ID: 14A-305). The observations were split into two scheduling blocks (SBs) spanning 2.5 hours each for a total observing time of 5 hours (2.5 hours on-source). We performed reference pointing scans at -band using a standard correlator set-up three times during each SB. We configured the Wideband Digital Architecture (WIDAR) correlator with 4 2048 MHz basebands centered at 13, 15, 16, and 17 GHz using the 3-bit samplers to cover the full 6 GHz bandwidth at -band. Each baseband was divided into 16 spectral windows (spws), each containing 64 channels. The correlator integration time was set to one second.
We performed phase referencing using the calibrator J0111+3906 every three minutes with a switching angle of 4∘. The positional accuracy of our phase calibrator was . We observed the standard flux density calibrator 3C48 to set the amplitude scale to an accuracy of 3% and calibrate the bandpass (Perley & Butler, 2013). Pointing solutions were derived approximately once per hour at X-band following standard VLA high-frequency observing guidelines. All flagging, calibration, and imaging was performed using the Common Astronomy Software Applications (CASA) package111http://casa.nrao.edu (version 4.1.0). Antenna 21 experienced tracking malfunctions in both SBs and was thus flagged from our observations. Each SB was independently calibrated using the CASA VLA calibration pipeline version 1.2.0222https://science.nrao.edu/facilities/vla/data-processing/pipeline. This pipeline performs all standard calibrations, runs the RFLAG algorithm to automatically flag radio frequency interference, and calculates data weights using the STATWT task.
After combining our SBs into a single dataset, we formed images of the -band data using the CLEAN task in CASA with an image size of 1′ (2048 pixels) and a pixel size of 0.03′′. We utilized the MS-MFS algorithm in CLEAN, which performs a multi-scale, multi-frequency deconvolution (Rau & Cornwell, 2011), by setting the parameters nterms = 2 and multiscale = [0, 5, 15]. We chose Briggs weighting (Briggs, 1995) with a robustness parameter of 0.5 to obtain the best compromise among sensitivity, spatial resolution, and sidelobe suppression. We utilized the -projection algorithm (Cornwell et al., 2005) by setting the parameters gridmode = ‘widefield’ and wprojplanes = 128 to correct for the effects of non-coplanar baselines. Our final image at a central frequency of 15 GHz has a synthesized beam size of and an rms noise of 1.5 Jy beam-1.
2.2 ALMA
ALMA observations in band 6 covering the CO(2–1) line at a rest frequency of 230 GHz were performed on October 31, 2015 (P.I. Anil Seth). Full details on these data will be presented in Davis et al. (in preparation). In brief, calibration was performed using the ALMA calibration pipeline. No continuum sources were detected (see Figure 2). Imaging was performed in CASA using the CLEAN task with Briggs weighting and a robustness parameter of 0.5. We produced a continuum-subtracted spectral line cube using the UVCONTSUB task in CASA. The final cube used in our analysis has a channel width of 10 km s-1, a sensitivity of 0.4 mJy beam-1 per channel, and a synthesized beam size of (0.9 0.6 pc).
The ALMA observations also include continuum data centered at a frequency of about 230 GHz. After combining the three continuum basebands spanning about 6 GHz with the line-free channels from the spectral line cube, we find a 5 upper limit of 51 Jy beam-1 for the presence of a compact millimeter continuum source in the center of NGC 404. We include this upper limit in our radio spectral index plot shown in Figure 2.
3 Results
3.1 Radio Continuum Properties
3.1.1 Morphology and Flux Density
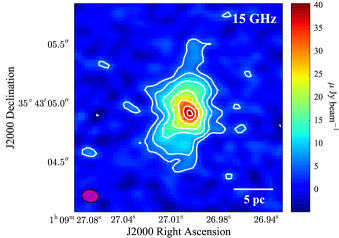
We summarize the basic observational properties of our new -band data, as well as the - and -band data presented in Nyland et al. (2012), in Table 1. A map of the 15 GHz emission with contours is shown in Figure 1. The full-width at half maximum (FWHM) of the major axis of the synthesized beam in this map is 0.15 (2.25 pc). The spatially-resolved 15 GHz source has a major axis extent of 1.13 17 pc with a position angle of 169.3 1.3 degrees333Due to the complex nature of the resolved radio continuum source, we caution readers that this position angle measurement may carry a significantly larger uncertainty.. The integrated flux density is 0.29 0.03 mJy, with a peak intensity of 0.04 0.01 mJy beam-1 (see Table 1).
3.1.2 Radio Spectral Index
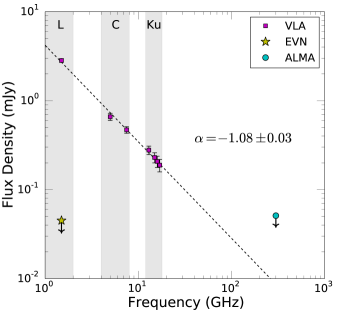
In Figure 2, we show the radio spectrum of NGC 404 from 1 to 18 GHz. After tapering the -band data to match the angular resolution of the -band data presented in Nyland et al. (2012), we compute the radio spectral index over this range - which spans more than a factor of ten in frequency - of 0.03. The 118 GHz radio spectral index is consistent with the in-band 48 GHz and the 1.58 GHz spectral index measurements reported in Nyland et al. (2012) of and 0.05, respectively. The steep spectral index is incompatible with pure thermal emission and suggests an optically-thin, non-thermal origin for the radio source (Condon, 1992).
We also include the upper limit to the 230 GHz (1 mm) continuum emission from the ALMA band 6 observations in Figure 2. Millimeter continuum emission may arise from thermal processes (free-free emission or the Rayleigh-Jeans tail of thermal dust emission heated by young stars or an active nucleus), non-thermal processes (synchrotron emission associated with a radio jet), or a combination of these mechanisms (Hönig et al., 2008; Krips et al., 2011). Distinguishing between these possibilities, and constraining the relative contribution of each emission mechanism, would require spectral energy distribution (SED) modeling of additional (sub-)millimeter and infrared data at sub-arcsecond resolution (e.g., following the strategy of Koay et al. 2016). However, sufficient measurements at these wavelengths (particularly in the mid-infrared) with high enough resolution to isolate the nuclear component of the continuum emission are currently lacking for NGC 404.
3.1.3 Radio Energetics
The previous study of the nuclear radio emission associated with NGC 404 presented in Nyland et al. (2012) lacked sufficient spatial resolution to accurately measure the extent of the radio source. The robust radio source size measurement presented here allows us to calculate the minimum synchrotron energy and magnetic field strength assuming equipartition between the particle and magnetic energy densities. We assume a prolate spheroid geometry () as in Mezcua et al. (2015) with and . We use Equations 1 and 2 below (based on Moffet 1975) to determine the minimum energy () and magnetic field strength () of the radio source:
| (1) |
| (2) |
where is the contribution of protons relative to electrons to the total particle energy, is the luminosity of the source, and is the volume of the synchrotron emitting region. For , we assume the Milky Way value of (e.g., Beck 2001), however, we note that this assumption carries a large uncertainty since measurements of in external galaxies are not currently available. The term in Equations 1 and 2 is defined as follows:
| (3) |
where is a constant444The cgs units of are (g/cm)3/4 s-1. of value 1.057 1012, is the spectral index, and and are the assumed lower and upper frequencies of the radio spectrum, respectively. We assume , MHz, and GHz. We find a minimum energy of erg and magnetic field strength of G.
3.2 Molecular Gas Properties
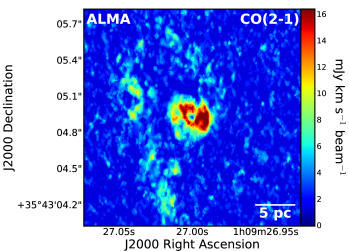
The CO(2–1) moment 0 (integrated intensity) map shown in Figure 3 is dominated by a bright, resolved, molecular disk with a central hole and a total extent of pc. This source is located at = 01h09m27.000s and = +354304.93, spatially coincident with the position of the peak of the radio continuum emission. The molecular gas mass may be estimated using the following equation from Bolatto et al. (2013):
| (4) |
where is the CO-to-H2 conversion factor, is the integrated CO(1–0) line flux in units of Jy km s-1, is the distance in units of Mpc, and is the redshift of the source.
For NGC 404, . We assume a standard Milky Way value of 2.3 1020 cm-2 (K km s-1)-1 (Bolatto et al., 2013) and a CO(2–1)/CO(1–0) flux density ratio of 3.2 (Carilli & Walter, 2013). Using Equation 4 with the integrated CO(2–1) line flux of 2.68 Jy km s-1 (measured over a linewidth of 100 km s-1) and accounting for the CO(2–1)/CO(1–0) ratio555For completeness, we note that the average Milky Way value of the line ratio CO(2–1)/CO(1–0) = 3.2 that we use in our analysis is equivalent to (2–1)/(1–0) = 0.8., we obtain a molecular gas mass of M⊙ for the nuclear CO(2–1) disk. This mass, which is similar to typical giant molecular cloud (GMC) masses in the Milky Way (Solomon et al., 1987), is about 1% of the total molecular gas mass measured in Taylor et al. (2015) of 9.0 106 M⊙ (or 7.7 106 M⊙ after converting to the distance of 3.06 Mpc adopted in our study) at a spatial resolution of 7.6′′ using the Berkeley-Illinois-Maryland Association (BIMA) interferometer. This is not unexpected given the substantial difference in synthesized beam size between the BIMA and ALMA CO observations. Thus, the ALMA CO(2–1) observations have likely resolved out most of the molecular gas detected in Taylor et al. (2015).
The moment 0 map also reveals a more extended, curved feature to the west of the central brighter source spanning 1.7 pc. This CO(2–1) structure has a slightly higher integrated line flux compared to the central disk of 4.03 Jy km s-1, which corresponds to a molecular gas mass of M⊙. Possible origins for the extended, low-surface-brightness molecular gas structure include a faint nuclear spiral arm or a tidally-disrupted GMC that is feeding cold gas onto the central MBH. Additional ALMA observations with higher surface brightness sensitivity will ultimately be needed to distinguish between these possibilities.
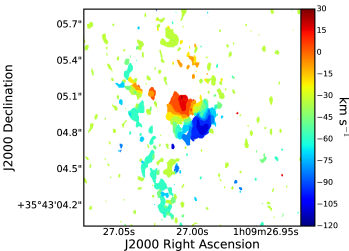
In Figure 3, we also show the CO(2–1) moment 1 map, which is characterized by a velocity field consistent with a regularly rotating gas disk on scales of a few parsecs. The range of velocities spans about to km s-1, which we note is significantly larger than the range velocities over which Taylor et al. (2015) detected CO(1-0) emission in their BIMA observations. This discrepancy is likely due to the substantially higher sensitivity of our ALMA observations. Additional information on the properties of the CO(2–1) data, along with new MBH constraints from dynamical modeling using the ALMA data, will appear in Davis et al. (in preparation).
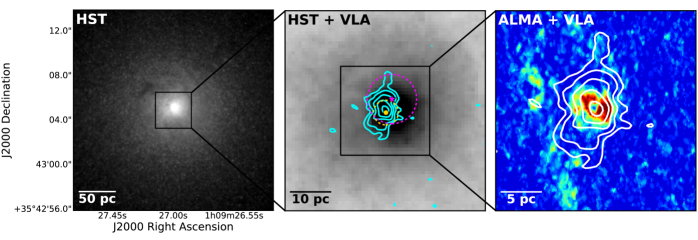
3.3 Astrometry
The position of the peak of the 15 GHz emission is located at = 01h09m26.999s and = +354304.91, identical to the radio position at 5 GHz reported in Nyland et al. (2012). The conservative one-dimensional positional uncertainty of this measurement is 0.1′′, and is dominated by our calibration strategy and the positional uncertainty of our phase-reference calibrator. The VLA position is well-matched to that of the center of rotation of the CO(2–1) nuclear disk detected by ALMA, with a spatial offset of only 0.02′′. In Figure 4, we show an optical HST image of NGC 404. As described in Nguyen et al. (2017), these HST data have a positional uncertainty of 0.2′′. Thus, within the known positional uncertainties, Figure 4 demonstrates that the radio continuum and central rotating CO(2–1) emission both appear to spatially coincident with the center of NGC 404. We note that we use the central position based on the stellar kinematics; this differs by 0.025′′ (0.37 pc) from the hot-dust-corrected photocenter (Seth et al., 2010; Nguyen et al., 2017).
The central region of NGC 404 also hosts a hard X-ray source with a power law spectrum that has previously been studied in detail at X-ray wavelengths (Binder et al., 2011; Paragi et al., 2014). Figure 4 shows the location of the hard X-ray source with respect to the optical and radio emission, along with the Chandra positional uncertainty reported in Binder et al. (2011) of 0.4′′. The spatial coincidence between the radio, X-ray, and optical emission was a key factor in the conclusion of Nyland et al. (2012) that the compact radio source detected at 5 GHz was most likely associated with an accreting low-mass AGN. This highlights the importance of Chandra X-ray data for improving our understanding of low-mass AGNs (e.g., Reines et al. 2016).
The astrometry of the NGC 404 Chandra data was recently re-assessed by Paragi et al. (2014). This study, which presented an analysis of new Chandra observations of NGC 404, found a positional offset of 1.1′′ with respect to previous Chandra observations, possibly due to an issue with the aspect reconstruction of the data used in one or both of the studies. However, since the time of publication, newer versions of the data from Binder et al. (2011) and Paragi et al. (2014) are now available on the Chandra archive that have been reprocessed using improved calibration heuristics. Comparing the reprocessed data from Paragi et al. (2014) with the deeper observations from Binder et al. (2011), we find an offset of about 0.4′′, which is consistent with the typical astrometric accuracy for Chandra. Given the currently available data, we conclude as in Nyland et al. (2012) that, within the known positional uncertainties, the hard X-ray source is most likely spatially coincident with the peak of the radio continuum source and the optical center of the galaxy.
4 Origin of the Extended Radio Source
Due to the low luminosity and diffuse morphology of the radio continuum emission in the center of NGC 404, there are multiple possibilities for the physical origin of the radio source detected in our new 15 GHz VLA observations. Nyland et al. (2012) investigated a number of scenarios for the origin of the compact 5 GHz emission detected at lower spatial resolution, concluding that the accreting black hole scenario was the most likely explanation. However, the possibility that the radio source is instead associated with star formation or a single ultraluminous radio supernova remnant could not be definitively ruled out. Here, we re-examine all viable possibilities for the origin of the radio source using the new constraints provided by our higher-resolution -band VLA observations and the ALMA CO(2–1) data.
4.1 Star Formation
4.1.1 Radio Star Formation Rate
Evidence for low-level star formation in the center of NGC 404 includes the presence of young stars ( 100 Myr) in the integrated spectra of the nuclear star cluster (Seth et al., 2010; Bouchard et al., 2010) within the inner 0.7′′, a central population of young stars detected in ultraviolet observations (Maoz et al., 1998, 2005), and soft nuclear X-ray emission with a diffuse morphology (Binder et al., 2011). Ground-based, extinction-corrected H measurements suggest an upper limit to the star formation rate (SFR) of 1 10-3 M⊙ yr-1 in the inner 1′′ (Seth et al., 2010). At 15 GHz, the radio-SFR calibration from Murphy et al. (2011) predicts that a SFR of 1.0 10-3 M⊙ yr-1 will produce radio emission with a flux density of 0.295 mJy, which is consistent with the integrated flux density measured in our new VLA observations (Table 1).
If the extended radio source detected in our -band observations is indeed associated with current star formation, the radio emission could in principle be produced by thermal emission from a compact HII region. However, the steepness of the integrated radio spectral index (see Figure 2) is indicative of optically-thin, non-thermal synchrotron emission. While this effectively rules out a current star formation origin for the radio continuum emission, synchrotron emission associated with a supernova remnant produced during a recent episode of star formation could conceivably explain the radio source. We explore this possibility in Section 4.2.
4.1.2 Molecular Gas Constraints on Star Formation
Additional evidence for the presence of star formation in the center of NGC 404 includes the detection of warm (Seth et al., 2010) and cold (e.g., Sage & Wrobel 1989; Wiklind & Henkel 1990; Taylor et al. 2015, this work) molecular gas from near-infrared spectroscopy and CO(1–0) imaging, respectively. However, the near-infrared ro-vibrational H2 transitions generally trace only a small fraction of the total molecular gas mass (1 M⊙; Seth et al. 2010), and the previous CO(1–0) observations lacked sufficient spatial resolution to place strong constraints on the SFR in the nucleus (inner 1′′) of NGC 404. The recent detection of resolved CO(2–1) emission with ALMA allows us to accurately estimate the SFR in the center of NGC 404 for the first time.
Using the mass of the CO(2–1) disk of (/M⊙) = 5.04 and the SFR-H2 mass relation from Gao & Solomon (2004) shown below:
| (5) |
we find a nuclear SFR of M⊙ yr-1. We also estimate the SFR based on the H2 gas surface density, , using the so-called Kenicutt-Schmidt (KS) relation (Kennicutt, 1998). After converting to a Kroupa stellar initial mass function (Kroupa, 2001), this SFR calibration is as follows:
| (6) |
where . To measure the surface area, , we assume an annular disk geometry with an inner radius of pc and an outer radius of pc. This gives pc2. Based on our molecular gas mass measurement in the CO(2–1) disk, this yields M⊙ yr-1 kpc-2, which corresponds to a nuclear SFR of M⊙ yr-1.
These molecular gas SFR estimates are factors of about 2 to 7 times lower than the SFR upper limit from the nuclear H observations of Seth et al. (2010) and the radio SFR based on the 15 GHz source flux density presented in this study. This further strengthens the case against a star formation origin for the extended radio source detected in our new VLA observations.
4.2 Supernova Remnant
While current star formation cannot account for the observed properties of the spatially-resolved radio emission, we consider the possibility of non-thermal emission associated with a supernova remnant as the origin of the radio source. Previously, Nyland et al. (2012) concluded that a single supernova remnant origin for the radio emission was unlikely. Specific evidence used to argue against the supernova remnant scenario includes the radio-X-ray-ratio (unlike NGC 404, supernova remnants are typically relatively faint at hard X-ray wavelengths), the deconvolved size of the compact radio source on scales of parsecs, and the steep nature of the radio spectral index.
The 15 GHz VLA data presented here have more firmly established the extent of the radio source (17 pc) as well as the radio spectral index (). We used this information to determine the minimum synchrotron energy in Section 3.1.3 of erg. This energy is 10% of the total energy budget of a type II core-collapse supernova (1051 erg; Smith et al. 1998). Thus, a supernova remnant origin for the radio emission in the center of NGC 404 is energetically plausible, though we remind readers that synchrotron energy estimates based on the equipartition assumption are lower limits and carry a large degree of uncertainty.
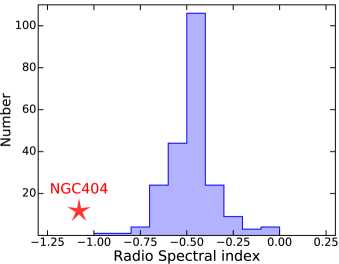
We also re-examined the radio spectral index distribution of supernova remnants in light of the new, tighter constraint on the radio spectral index reported here. Using the database of Galactic supernova remnant properties compiled by Green (2014), we show the number distribution of supernova remnant spectral indices in Figure 5. NGC 404 is shown on this figure as an obvious outlier with a considerably steeper radio spectral index compared to the Galactic supernova remnant sample. While supernova remnants with spectral indices comparable to that of NGC 404 are known to exist in external galaxies (e.g., Lacey et al. 2007), these objects tend to be associated with young (i.e., less than a couple hundred years old) supernova remnants with extents on the order of one parsec or less. The extent of NGC 404 of 17 pc is therefore incompatible with that of a young supernova remnant characterized by a steep radio spectrum.
The radio luminosities and spectral indices of radio supernova remnants are also known to depend on the ISM properties into which the supernova remnant is expanding (Dubner & Giacani, 2015). It is therefore possible that the radio properties of the source detected in the center of NGC 404 are due to an extraordinary interaction between a supernova remnant and the surrounding ISM. However, we emphasize that the circumnuclear cold molecular gas detected in our CO(2–1) ALMA observations has a more compact extent than the 15 GHz radio source (Figure 4). This suggests that supernova remnant cosmic ray re-acceleration due to a strong interaction with this phase of the ISM is unlikely to be the dominant production mechanism of the radio continuum emission.
4.3 Stellar Mass Black Hole
4.3.1 X-ray Binary
Although the luminosity of the hard X-ray point source in the vicinity of the NGC 404 nucleus could conceivably be produced by a single X-ray binary (XRB), previous studies have argued against this possibility. Binder et al. (2011) argued that the X-ray luminosity and power-law photon index were most consistent with a low-luminosity AGN scenario and inconsistent with the XRB interpretation. Nyland et al. (2012) reported that the high radio luminosity and high radio-X-ray-ratio were incompatible with ordinary Galactic XRBs. They also showed that the black hole mass predicted by the fundamental plane of black hole activity (Merloni et al., 2003; Falcke et al., 2004) of M⊙ was consistent with radio and X-ray emission produced by a MBH but not a stellar-mass black hole. Here, our spatially-resolved map provides a robust size measurement of 17 pc, which further argues against a typical XRB origin since these objects are typically much more compact.
It is possible that a microquasar, or high-accretion-rate XRB characterized by the presence of prominent radio jets (Mirabel & Rodríguez, 1999), could lead to the observed radio properties of NGC 404. While the radio jets of microquasars are generally compact compared to the extent of NGC 404, some microquasars are known to display particularly unusual radio properties, such as source extents of hundreds of parsecs and bright continuum emission comparable to the luminosity of the radio source in the center of NGC 404. The most well-known example of such a source is the Galactic microquasar SS433 (Fabrika, 2004; Goodall et al., 2011). The extraordinary properties of this source are the result of an interaction between the radio jets of the microquasar itself and the dense ambient medium shed by the nearby supernova remnant W50. A handful of analogues to SS433 in external galaxies are also known, such as the microquasar S26 hosted by the nearby galaxy NGC 7793 (Pakull et al., 2010; Soria et al., 2010). The radio emission associated with objects like SS433 and S26 is believed to be produced by a jet-inflated, over-pressured bubble with an edge-brightened, cocoon-like morphology. This type of radio continuum structure contrasts with that of NGC 404, which consists of a central peak surrounded by less luminous, extended emission. We therefore consider a microquasar origin for the central radio source in NGC 404 to be unlikely.
4.4 Accreting Massive Black Hole
Nyland et al. (2012) concluded that the most likely scenario for the origin of the unresolved nuclear radio source they detected was an active nucleus powered by MBH accretion. This conclusion was based primarily on the spatial coincidence of the radio emission with a hard X-ray point source and the optical center of the galaxy as well as the radio-X-ray ratio, defined as (Terashima & Wilson, 2003). The radio-X-ray-ratio of NGC 404 is , consistent with the radio-loud emission characteristic of low-luminosity AGNs with radio jets or outflows (Nagar et al., 2005; Ho, 2008; Wrobel & Nyland, 2012; Nyland et al., 2016). The detection of resolved radio emission in the 15 GHz study presented here is therefore consistent with the radio-loud, low-luminosity AGN interpretation.
Although the 15 GHz emission in the nucleus of NGC 404 is resolved, it does not display the classic, well-collimated, core+jet morphology sometimes associated with low-luminosity AGNs on similar scales (e.g., Nagar et al. 2005). However, a number of studies have suggested that compact radio continuum structures lacking well-collimated morphologies may also be powered by nuclear activity (e.g., Baldi et al. 2015; Mukherjee et al. 2016; Soker 2016). Explanations for the radio continuum morphology in such systems include a variable black hole accretion rate, lower bulk jet velocities, a lower black hole spin, jet precession, a higher susceptibility to interaction/entrainment with the ambient ISM, or perhaps a combination of multiple factors (Ulvestad et al., 1999; Sikora, 2009; Chai et al., 2012; Baldi et al., 2015). In NGC 404, a plausible scenario is that the radio emission originates as weak jets that quickly become confined by the ISM as they strongly interact with the surrounding gas disk, resulting in a diffuse morphology. Such a scenario may also lead to shocks, thus contributing to the observed H emission (see Section 5.1). The radio continuum emission could also conceivably originate from an accretion disk wind (Yuan & Narayan, 2014; Wong et al., 2016). However, we find this possibility unlikely given the steep spectral index indicative of optically-thin synchrotron emission that is incompatible with a thermal wind origin.
Examples of nearby galaxies with radio emission associated with the central AGN that have similar radio morphologies to that seen in NGC 404 include NGC 1266 (Nyland et al., 2013) and NGC 6764 (Hota & Saikia, 2006; Kharb et al., 2010). The radio emission in both of these galaxies is considerably more extended than that of NGC 404 (1 kpc vs. 10 pc), possibility as a result of their higher MBH masses and accretion rates. Nevertheless, both of these objects display centrally-peaked radio emission embedded within a more diffuse, extended, and poorly-collimated structure. In NGC 1266, the radio emission is spatially coincident with warm ionized gas energized by shock excitation (Davis et al., 2012) and turbulent molecular gas (Alatalo et al., 2015), suggesting the impact of the radio jet as it attempts to propagate through the ISM is responsible for the shocks. In NGC 6764, the diffuse morphology of the radio source is believed to result from a combination of jet precession and disruption via interaction/entrainment with the ISM (Kharb et al., 2010). While the underlying physics responsible for producing the observed radio source properties in NGC 404 is still unclear (e.g., deceleration, ISM entrainment, jet precession, etc.), we conclude that a confined radio jet origin is a plausible scenario.
5 Discussion
5.1 Shocks
Shocks produced by supernovae, AGN-driven winds, or radio jet-ISM interactions are commonly associated with galaxy nuclei (e.g., Zakamska & Greene 2014; Alatalo et al. 2016; Belfiore et al. 2016), and represent a possible means of energetic feedback capable of altering the chemistry and conditions of the ISM. We therefore consider evidence for the presence of shocks in the center of NGC 404 from the Balmer emission line properties (including archival H data from HST), soft X-ray emission from Chandra, mid-infrared data from Spitzer spectroscopy, and near-infrared spectroscopic studies from the literature.
5.1.1 Warm Ionized Gas
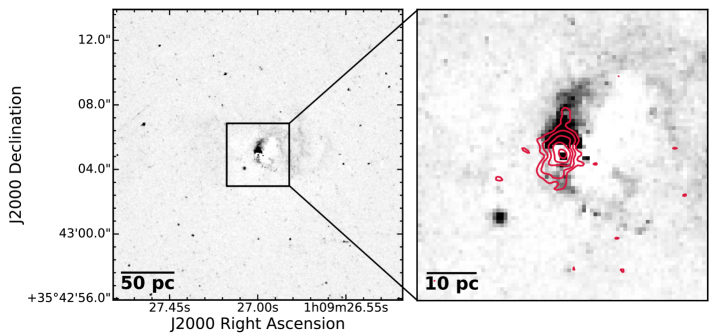
The LINER emission line classification of NGC 404, along with the presence of extended, nuclear H emission, are consistent with the possible presence of shock excitation in the NGC 404 nucleus as observed in other nearby galaxies (e.g., NGC 1266; Davis et al. 2012). In Figure 6, we show an image of the HST F656-F814 emission, which provides an approximate continuum-subtracted map of the H emission. Bright, clumpy H emission with an arc-like morphology is clearly visible in the circumnuclear region of NGC 404. This H emission is brightest at the location of the northern extension of the radio source, suggesting the possibility of a link between the radio source and the production of the warm ionized gas via shock excitation.
Previously, the extended H emission in the center of NGC 404 has been interpreted as a filament of a superbubble blown out by a circumnuclear starburst (Pogge et al., 2000; Eracleous et al., 2002). However, this interpretation was based primarily on the morphology of the H emission, and alternative scenarios, such as AGN feedback (e.g., NGC1052; Dopita et al. 2015) have been advocated for other objects with similar H morphologies. We explore the possibility of “localized” AGN feedback in the NGC 404 nucleus in Section 5.2.
5.1.2 Soft X-rays
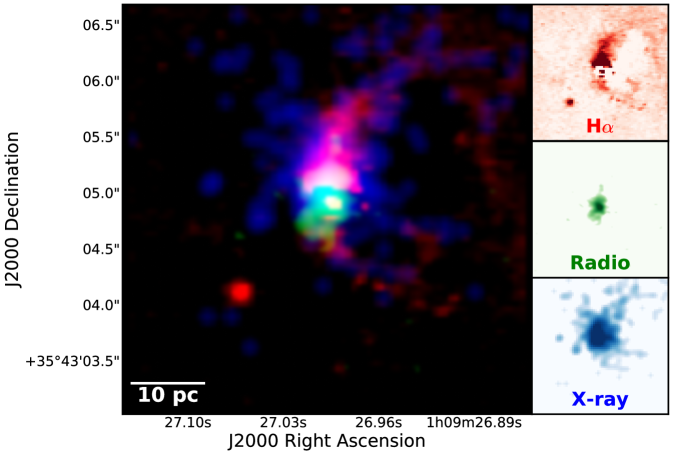
Based on previous Chandra studies, the center of NGC 404 also hosts extended soft X-ray emission (Binder et al., 2011). In Figure 7, we show a three-color composite image highlighting the H emission from the archival HST data, the spatially-resolved 15 GHz source from the VLA observations presented in this work, and the morphology of the soft ( keV) X-ray emission from archival Chandra data. The Chandra data have been re-binned to improve upon the default pixel resolution of 0.492′′, thereby taking advantage of the finer positional information from spacecraft dithering and aspect corrections. To accomplish this, we reprocessed obsid 12239 using CIAO v4.9 (Fruscione et al., 2006). We then used dmcopy in CIAO to create a subpixel-binned image from the reprocessed event file, with image pixel scales equal to 1/8th of the native ACIS pixel scale. Our final, improved X-ray image has also been adaptively smoothed (Ebeling et al., 2006) to improve the signal-to-noise ratio using the csmooth algorithm in CIAO.
The reprocessed soft X-ray image has allowed us to perform a more direct comparison between the HST H and VLA 15 GHz data that were observed at higher spatial resolutions. As illustrated in Figure 7, the re-binned soft X-ray image aligns well with the HST H continuum-subtracted image, tracing the arc-like structure that is clearly visible in the warm ionized gas. The good agreement between the warm ionized gas and soft X-rays further supports the possibility of shocks in the center of NGC 404. The radio continuum source also appears to spatially overlap with the diffuse X-ray and warm ionized gas emission. The spectral index of the radio source rules out a thermal origin, suggesting that a shock origin for the 15 GHz emission is unlikely. However, we speculate that the interaction between the non-thermal radio continuum emission and the surrounding gas could contribute to shock excitation in the vicinity of the nucleus.
5.1.3 Infrared Spectroscopy
Near-infrared spectroscopic data with sub-arcsecond spatial resolution also indicate that shocks may be present in the nucleus of NGC 404 based on the detection of strong [Fe ii] and H2 (Larkin et al., 1998; Seth et al., 2010; Mason et al., 2015), tracers commonly associated with shocked gas energized by supernova remnants or radio jets (e.g., Mouri et al. 2000; Alonso-Herrero et al. 1997; Rodríguez-Ardila et al. 2004; Riffel et al. 2013). Seth et al. (2010) investigated the origin of the ro-vibrational H2 emission on sub-arcsecond scales by computing the line ratio of the H2 2–1 S(1) and 1–0 S(1) lines. They found a value of 0.11 to 0.16, which is consistent with either shocks or X-ray excitation in a dense medium ( cm-3).
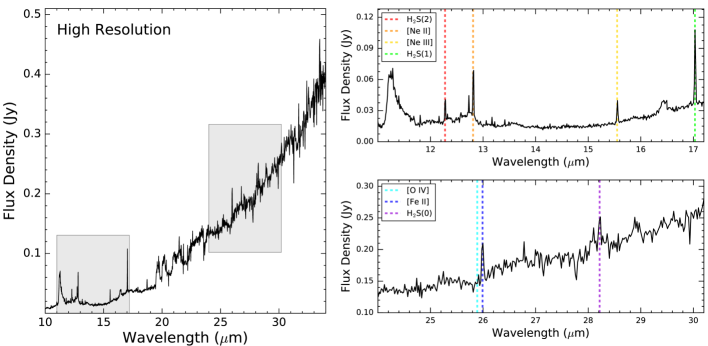
To search for signposts of shocks in the mid-infrared, we obtained archival Spitzer Infrared Spectrograph (IRS; Houck et al. 2004) data from The Cornell Atlas of Spitzer/IRS Sources (CASSIS666The Spitzer IRS data obtained from CASSIS correspond to AOR 10514944 and were automatically reduced using the S18.18 pipeline (Lebouteiller et al., 2011).). We show the high-resolution IRS spectrum from the combined Short-high and Long-high modules () in Figure 8. These modules have slit sizes of 4.7′′ 11.3′′ (70 pc 168 pc) and 11.1′′ 22.3′′ (165 pc 331 pc), respectively, covering the entire NGC 404 region of interest.
The Spitzer IRS data have been published in Pereira-Santaella et al. (2010), however, only the fine-structure lines [Ne ii], [Ne iii], and [O iv] were identified and measured ([Ne v] is not detected). We identify these lines in Figure 8, along with previously unpublished detections of pure rotational transitions of molecular hydrogen and strong [Fe ii] emission at 26 m. The fluxes of the fine-structure and molecular hydrogen lines are presented in Table 2. We note that the detected fine-structure lines may arise via AGN photoionization (Veilleux & Osterbrock 1987) or shocks (Dopita & Sutherland 1996), and distinguishing between these possibilities is challenging due to model degeneracies (e.g., Groves et al. 2006).
The rotational H2 transitions detected in the Spitzer IRS data may offer additional constraints. The presence of the warm molecular hydrogen emission is substantial given the relatively low level of star formation in the central region of this galaxy, since rotationally-excited H2 lines in most galaxies are powered by FUV radiation associated with photodissociation regions (PDRs). AGN excitation by photoionization or X-ray heating may also lead to the production of mid-infrared H2 lines, though given the low hard X-ray luminosity of the NGC 404 nucleus we find such a scenario unlikely (Lanz et al., 2015) (although we cannot rule out a contribution by lower-energy X-ray photons associated with supernova remnants).
In extreme cases, rotational H2 lines can also be produced in shocks. Previous studies have argued that prominent H2 emission associated with radio galaxies and less powerful low-luminosity AGNs is predominantly produced via shock excitation (Roussel et al., 2007; Ogle et al., 2010; Guillard et al., 2012a; Alatalo et al., 2015). The shock front in Stephan’s Quintet also shows significant warm H2 emission (Appleton et al., 2006; Guillard et al., 2012b). Hickson Compact Group galaxies undergoing rapid transformation are another class of objects that show elevated warm H2 emission, originating from shocks in the systems (Cluver et al., 2013). The presence of the rotationally-excited H2 lines and the 26 m [Fe ii] feature in the mid-infrared, as well as the near-infrared shock tracers H2 and [Fe ii] in the band, suggest that shocks may be present in the center of NGC 404, and may even be a dominant excitation mechanism for the gas. To test this possibility, we compare tracers able to differentiate between dominant excitation mechanisms: the warm H2 emission traced by the Spitzer IRS spectrum, and the 7.7 µm polycyclic aromatic hydrocarbon (PAH) emission.
| Line | Flux | Error | |
|---|---|---|---|
| (m) | (10-17 W m-2) | (10-17 W m-2) | |
| (1) | (2) | (3) | (4) |
| H2 S(2) | 12.28 | 1.80 | 0.30 |
| ii | 12.81 | 3.09 | 0.30 |
| iii | 15.55 | 1.85 | 0.20 |
| H2 S(1) | 17.03 | 5.60 | 0.80 |
| iv | 25.89 | 0.79 | 0.20 |
| ii | 25.99 | 1.60 | 0.20 |
| H2 S(0) | 28.22 | 1.42 | 0.20 |
Notes - The properties of the mid-infrared lines detected in archival, high-resolution Spitzer IRS data in this table were measured using IRAF. Column (1): line name. Column (2): central wavelength. Column (3): line flux. Column (4): uncertainty in the line flux measurement from Column (3).
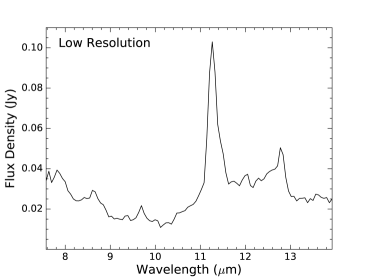
In Figure 9, we show the low-resolution IRS spectrum, which contains the 7.7 µm PAH emission region. Data are only available from the SL1 order of the Short-low module, in the wavelength range 7.4 to 14.5 m. The slit size corresponding to these data is 3.7′′ 57′′ (55 pc 846 pc). Although this slit size is larger than the slit size associated with the high-resolution IRS data, the region of interest in NGC 404 is sufficiently small that both likely encompass comparable emitting regions. In Tables 2 and 3, we provide summaries of the mid-infrared spectral line and PAH properties, respectively, from the archival Spitzer IRS data. Measurements of the PAH features were obtained using the spectral fitting tool PAHFIT (Smith et al., 2007). Following Ogle et al. (2010), we calculate the ratio of the sum of the rotational H2 transitions identified in Table 2 and the PAH feature near 7.7 m, and find H2/PAH . This ratio is well within the definition for a molecular hydrogen emitting galaxy (MOHEG) given in Ogle et al. (2010) of . This definition encompasses a wide range of AGNs, including powerful FRI/FRII (Fanaroff & Riley, 1974) radio galaxies (Ogle et al., 2010), as well as nearby low-luminosity AGNs from SINGS777Spitzer Infrared Nearby Galaxies Survey (Kennicutt et al., 2003). (Roussel et al., 2007).
Confirmation of the presence of emission line ratios consistent with shocks, as well as determination of their relative importance compared to other excitation mechanisms, will ultimately require a high-angular-resolution line ratio study of the optical and infrared emission lines that is able to differentiate between activity directly related to the AGN (such as the narrow-line region) and that which is due to shocks, but is beyond the scope of this work. Velocity information from future two-dimensional integral-field-unit studies are also strongly motivated by the data presented here to allow a more quantitative analysis of the conditions in the center of NGC 404, determining the direct and indirect effects of the AGN versus other influences, such as supernova remnants and the minor merger that NGC 404 experienced 1 Gyr ago.
| FWHM | EW | Flux | Error | |
|---|---|---|---|---|
| (m) | (m) | (m) | (10-17 W m-2) | (10-17 W m-2) |
| (1) | (2) | (3) | (4) | (5) |
| 7.60 | 0.334 | 0.196 | 12.20 | 3.85 |
| 7.85 | 0.416 | 0.644 | 35.60 | 3.31 |
| 8.61 | 0.336 | 0.616 | 24.40 | 1.72 |
| 10.68 | 0.214 | 0.189 | 4.76 | 0.56 |
| 11.23 | 0.135 | 0.953 | 24.80 | 0.98 |
| 11.33 | 0.363 | 2.480 | 65.20 | 1.42 |
| 11.99 | 0.540 | 0.932 | 27.70 | 1.47 |
| 12.62 | 0.530 | 0.975 | 33.70 | 1.56 |
| 13.48 | 0.539 | 0.083 | 3.62 | 1.75 |
Notes - The properties of the mid-infrared PAH features identified in archival, low-resolution Spitzer IRS data in this table were measured using PAHFIT (Smith et al., 2007). Column (1): central wavelength. Column (2): full width at half maximum. Column (3): equivalent width. Column (4): integrated flux. Column (5): uncertainty in the flux measurement from Column (4).
5.2 Localized MBH Feedback?
Feedback from luminous AGNs may dramatically alter the cold-gas content of the ISM on galaxy-wide scales. This form of “global” AGN feedback is believed to typically proceed either radiatively via the direct expulsion of gas by quasar winds, or mechanically by radio-lobe-driven heating of the intracluster medium that prevents the deposition of cooled hot halo gas onto the host galaxy. However, mounting observational and theoretical evidence for “localized” feedback from much lower-luminosity AGNs, including those hosted by dwarf galaxies associated with MBH masses M⊙, has begun to transform long-held beliefs that only the most powerful AGNs residing in massive clusters or associated with quasar-level activity are capable of significantly affecting their surroundings (e.g., Alatalo et al. 2011; Nyland et al. 2013; Mukherjee et al. 2016; Godfrey & Shabala 2016; Silk 2017). Thus, we consider the possibility that the accreting MBH in the center of the dwarf galaxy NGC 404 may be injecting energy into its immediate surroundings, leading to feedback on local (i.e., tens of parsecs) scales.
Localized AGN feedback driven by the central engine of NGC 404 may manifest itself as a nuclear outflow. Detections of outflows launched by radio jets or winds associated with low-luminosity AGNs in nearby galaxies have become increasingly common over recent years. Examples include NGC 1266 (Alatalo et al., 2011, 2015; Davis et al., 2012; Nyland et al., 2013), M51 (Querejeta et al., 2016), and NGC3801 (Hota et al., 2012), IC5063 (Dasyra & Combes, 2012; Morganti et al., 2015), Circinus (Zschaechner et al., 2016), and NGC1068 (García-Burillo et al., 2014; Lamastra et al., 2016). However, the extent to which these outflows affect the ISMs and subsequent evolution of their host galaxies remain unclear. If localized AGN feedback in the form of an outflow is present in the center of NGC 404, it would provide an important comparison point to the low-luminosity AGN-driven outflows in these systems, providing constraints on the types of environments in which localized AGN feedback operates as well as the scope of the feedback.
Although convincing evidence for a nuclear outflow is currently lacking, Nguyen et al. (2017) note the presence of non-gravitational motions in the hot H2 in the center of NGC 404 that prevent them from obtaining a reliable MBH mass measurement from the gas dynamics. One possible explanation for the observed non-gravitational motions is the presence of an outflow. However, gas inflow, or confusion with foreground gas located at a further distance from the NGC 404 nucleus, could also explain the H2 properties. Indirectly, evidence for the presence of shocks also suggests that AGN feedback could be present in the NGC 404 nucleus, though as discussed in Section 5.1, other mechanisms capable of producing shocks that are unrelated to excitation by jets/AGN winds are also possible.
The H morphology shown in Figure 6 could be the remnant of a bubble blown by a recent starburst, ram-pressure-shocked gas fueling the central AGN, or an outflow with an ionization-cone-like structure. Ionization cones are commonly observed in association with Seyfert nuclei (e.g., Pogge 1988; Müller-Sánchez et al. 2011; Fischer et al. 2013; Maksym et al. 2016), though examples exist in the literature of ionization cones associated with LINERs as well (e.g., Dopita et al. 2015). These objects are believed to be powered by AGN winds or radio jets (Netzer, 2015). We emphasize that the presence of an ionization cone in the center of NGC 404, while plausible, remains speculative given the currently available data. Future observations will ultimately be needed to confirm or rule-out the possibility of localized AGN feedback in the center of NGC 404. We therefore advocate for additional high-angular-resolution, multi-transition spectroscopic studies of the molecular gas in the NGC 404 nucleus to provide constraints on the ISM conditions and excitation mechanisms.
5.3 Implications for Galaxy Evolution
5.3.1 A Dwarf Galaxy in Transition?
Previous studies of the stellar population of NGC 404 have revealed that the circumnuclear region is dominated by stars with ages of 1 Gyr (e.g., Nguyen et al. 2017). This is consistent with a large, centrally-concentrated population of A stars, a characteristic feature of post-starburst galaxies (e.g., Quintero et al. 2004; Goto 2007). Since NGC 404 harbours prominent H emission, it would be disqualified from many traditional post-starburst diagnostics that require low levels of H emission to rule-out significant levels of current star formation. Such post-starburst selection constraints aim to ensure that candidate post-starburst galaxies are likely to have experienced a substantial decline in star formation over the past 1 Gyr. However, aside from star formation, H emission may be produced via a variety of other processes, including shock excitation.
If the central H emission is primarily produced by shock excitation, NGC 404 may represent an example of a dwarf shocked post-starburst galaxy (SPOG; Alatalo et al. 2016), with similar properties to the prototypical SPOG NGC 1266 (Alatalo et al., 2015). Thus, NGC 404 may belong to a class of objects that are believed to be transitioning from actively star-forming systems to quiescent, early-type galaxies. It is therefore of interest to consider what might have led to the post-starburst stellar population in the center of NGC 404. A variety of mechanisms, including AGN feedback, mergers, gas stripping in dense cluster environments, and secular evolution via the consumption of gas in a starburst event, may be responsible for transitioning the stellar populations of SPOGs.
NGC 404 does not reside in a cluster or group environment (Tikhonov et al., 2003), and levels of AGN feedback are believed to be low (though additional studies are needed to investigate the possibility of an AGN-driven-outflow origin for the nuclear H emission discussed in Section 5.2). Given these constraints, the transitioning stellar population identified in the NGC 404 nucleus is possibly a consequence of the minor merger it experienced 1 Gyr ago (e.g., del Río et al. 2004) followed by the consumption of the majority of the gas deposited by the merger during a subsequent star formation episode. We speculate that minor mergers and secular evolution may be common triggering mechanisms among field dwarf galaxies classified as SPOGs.
5.3.2 Stunted MBH Growth in Dwarf Galaxies?
As illustrated in Figure 16 of Nguyen et al. (2017), the stellar dynamics upper limit on the MBH mass for NGC 404 falls below the linear scaling relation between MBH mass and bulge mass (–) that has been established for massive early-type galaxies (Kormendy & Ho, 2013). This is consistent with recent evidence that low-mass MBHs, particularly those hosted by late-type galaxies with mass measurements based on maser dynamics, do not follow the – relation (Läsker et al., 2016; Greene et al., 2016). One interpretation is that the – relation represents an upper limit or envelope of a much broader distribution of MBH masses at a given velocity dispersion, and the tight correlation is the result of current observational limitations in resolving the gravitational sphere of influence (e.g., Batcheldor 2010). However, Gültekin et al. (2011) evaluated this possibility, and after performing a series of statistical tests, concluded that it can be ruled out for massive galaxies.
Another possibility is that the – relation is broken or bent, where the linear relation for massive galaxies (i.e., those with M⊙) steepens to a nearly quadratic value for galaxies hosting less massive MBHs with masses in the range of (e.g., Dubois et al. 2012; Graham & Scott 2015; Fontanot et al. 2015; Mezcua et al. 2016). Following analyses of the MBH and bulge masses of RGG 118, which has the lowest-mass nuclear MBH known888The mass of the MBH in the center of RGG 118 (also known as LEDA 87300 and PGC 87300) is 50,000 M⊙ and was measured using the virial MBH mass measurement technique (Greene & Ho, 2005). (Baldassare et al., 2015; Graham et al., 2016), this steeper – may also hold at even lower MBH masses extending to the intermediate-mass black hole regime ().
The bending of the – relation suggests different evolutionary paths for high- and low-mass galaxies. This is supported by recent statistically-complete surveys of early-type galaxies (e.g., the ATLAS3D survey; Cappellari et al. 2011) that have found that massive, slowly-rotating early-types are built-up through a series of dry minor mergers, whereas less massive, more rapidly rotating early-types formed via gas-rich minor and major mergers (Cappellari et al., 2013). Thus, Graham & Scott (2015) suggest that for lower-mass galaxies, the bulge and MBH growth is fueled by the same reservoir of cold gas, whereas in more massive galaxies (that presumably host more massive central MBHs), AGN feedback regulates the availability of cold gas and subsequently reduces the growth of the stellar bulge. This would naturally lead to a flatter – relation at low masses. Another explanation for the bent – advocated by Dubois et al. (2015) is that MBHs hosted by lower-mass galaxies are “starved” of fuel as a result of supernova feedback that removes cold gas from the nucleus, leading to lower / ratios. This effect would decrease in significance for more massive bulges as the deeper gravitational potential makes the removal of gas via supernova feedback less efficient.
A gas-rich merger history for NGC 404 is supported by previous studies, and evidence includes the central counter-rotating core of the NSC dominated by A stars (Nguyen et al., 2017) as well as the presence of an outer star-forming, cold-gas disk (del Río et al., 2004; Thilker et al., 2010; Lelli et al., 2014). The recent evolutionary history of NGC 404 is therefore consistent with the quadratic – relation. In addition to unregulated growth of the stellar bulge by sufficiently powerful AGN feedback, supernova-driven feedback may further hinder MBH accretion onto the NGC 404 nucleus, thereby stunting its growth relative to that of the stellar bulge. We also speculate that the putative AGN-driven radio outflow itself may further impede fueling and subsequent growth of the central MBH, as suggested for other systems (e.g., NGC3115; Wrobel & Nyland 2012).
6 Summary and Future Work
We have presented new VLA 1218 GHz radio continuum and ALMA CO(2–1) observations of the nucleus of the low-mass MBH ( M⊙) in the center of the dwarf galaxy NGC 404. For the first time, we have spatially resolved the structure of the radio continuum source previously detected in the NGC 404 nucleus at lower spatial resolution (Nyland et al. 2012), thus highlighting the importance of high-angular-resolution, interferometric radio observations in studies of low-mass MBHs accreting at extremely low Eddington ratios. The radio source is centrally peaked, has an extent of 1.13′′ (17 pc), and an integrated 15 GHz luminosity of log(/W Hz-1) = 17.53. By incorporating all radio continuum measurements of the central regions of NGC 404 available from 1 to 18 GHz, we find a steep radio spectral index of that is consistent with optically-thin synchrotron emission. The ALMA molecular gas data reveal a resolved, bright, circumnuclear disk as well as a clumpy, extended structure possibly related to a circumnuclear spiral arm or a disrupted GMC. The center of the CO(2–1) disk is spatially coincident with the peak of the extended radio source, the dynamical center of NGC 404, and the hard X-ray source identified by Binder et al. (2011), and the disk appears to be regularly rotating.
The radio source and molecular disk are also coincident with bright, extended H emission detected in narrow-band HST images. Based on supporting evidence from the presence of extended soft X-ray emission in archival Chandra data, as well as common shock tracers detected in near- and mid-infrared spectroscopic data, the H emission may be produced via shock excitation. We further investigated the possible presence of shocks in the central region of NGC 404 by analyzing archival Spitzer IRS data and identifying, for the first time, strong [Fe ii] at 26 m and rotational H2 emission in the S(0), S(1), and S(2) transitions. The ratio between the total warm molecular hydrogen emission and the 7.7 m PAH feature is 0.7, indicating that mid-infrared spectrum of NGC 404 is consistent with the MOHEG class and strengthening the case for significant shock excitation in the center of NGC 404. This could be a signpost of low-level, localized AGN feedback from the dwarf AGN. However, constraints from future kinematic studies on the presence of an outflow driven by this feedback, as well as an analysis of chemical models to determine the ISM conditions in the vicinity of the nucleus of NGC 404, are needed to confirm this intriguing possibility.
The spatial coincidence of the radio source, hard X-ray source, dynamical center of NGC 404, and the rotating circumnuclear CO(2–1) disk point to a confined radio jet/outflow launched by the central low-mass, low-Eddington ratio MBH as the most likely origin for the radio source. This radio outflow may also be interacting with the ISM within the inner 8 pc of the nucleus, producing shocked emission in the process. A consequence of the low-level radio outflow may be to help maintain the low mass accretion rate of the MBH, thus contributing to the low / ratio that characterizes NGC 404 and other lower-mass galaxy spheroids. While it is not possible to definitively rule-out an unusually luminous supernova remnant origin for the radio emission, the radio spectral index, extent of the radio source, and its centrally-peaked morphology, pose substantial challenges to the supernova remnant scenario. This work demonstrates the importance of multi-wavelength observations for identifying the AGN signatures of a low-mass AGN, and we emphasize that similarly detailed observations will be needed to identify more objects like NGC 404, as well as growing MBHs in high-redshift dwarf galaxies.
Although we have made progress in our understanding of the complex nature of the central engine of NGC 404 in this study, much additional work is warranted. Deep, interferometric radio continuum observations with slightly higher angular resolution would provide an important constraint on the presence of a central, flat-spectrum radio core embedded in the extended source identified in this work. In the optical and infrared regimes, future, high-angular-resolution, spectroscopic analysis of the excitation mechanisms in the nucleus of NGC 404 will be important for verifying the presence of shocks and their energetic importance compared to other excitation mechanisms.
Additional high-resolution observations with ALMA probing the excitation mechanisms of molecular gas species such as HCO+, HCN, and CS will help distinguish between AGN excitation and excitation driven by star formation (Izumi et al., 2016), and multi-transition observations of molecular shock tracers such as SiO and HNCO (e.g., Kelly et al. 2017, and references therein) will provide new insights on the physical conditions in the center of NGC 404. Finally, the high angular resolution and sensitivity of upcoming facilities such as the James Webb Space Telescope will make it possible to isolate the emission from low-luminosity AGNs residing in nearby lower-mass or dwarf galaxies from the emission of the host, which will allow the nuclear infrared SEDs and emission lines of objects like NGC 404 to be studied in detail for the first time. Ultimately, future statistical studies of the population of nearby low-mass AGNs will be necessary to improve our understanding of the link between MBH growth and galaxy evolution.
Acknowledgments
We thank Preshanth Jagannathan for helpful discussions on imaging the VLA -band data and Kyle Penner for assisting us with analyzing the archival Spitzer IRS data. The National Radio Astronomy Observatory is a facility of the National Science Foundation operated under cooperative agreement by Associated Universities, Inc. This paper makes use of the following ALMA data: ADS/JAO.ALMA#2015.1.00597.S. ALMA is a partnership of ESO (representing its member states), NSF (USA) and NINS (Japan), together with NRC (Canada) and NSC and ASIAA (Taiwan) and KASI (Republic of Korea), in cooperation with the Republic of Chile. The Joint ALMA Observatory is operated by ESO, AUI/NRAO and NAOJ. We also utilized data from The Cornell Atlas of Spitzer/IRS Sources (CASSIS). CASSIS is a product of the Infrared Science Center at Cornell University, supported by NASA and JPL. This research has made use of the NASA/IPAC Extragalactic Database (NED) which is operated by the Jet Propulsion Laboratory, California Institute of Technology, under contract with the National Aeronautics and Space Administration. TAD acknowledges support from a Science and Technology Facilities Council Ernest Rutherford Fellowship. Support for K.A. is provided by NASA through Hubble Fellowship grant #HST-HF2-51352.001 awarded by the Space Telescope Science Institute, which is operated by the Association of Universities for Research in Astronomy, Inc., for NASA, under contract NAS5-26555. Finally, we thank the anonymous referee for helpful comments that have improved the clarity of this paper.
References
- Alatalo et al. (2011) Alatalo, K., Blitz, L., Young, L. M., et al. 2011, ApJ, 735, 88
- Alatalo et al. (2015) Alatalo, K., Lacy, M., Lanz, L., et al. 2015, ApJ, 798, 31
- Alatalo et al. (2016) Alatalo, K., Cales, S. L., Rich, J. A., et al. 2016, ApJS, 224, 38
- Alonso-Herrero et al. (1997) Alonso-Herrero, A., Rieke, M. J., Rieke, G. H., & Ruiz, M. 1997, ApJ, 482, 747
- Appleton et al. (2006) Appleton, P. N., Xu, K. C., Reach, W., et al. 2006, ApJ, 639, L51
- Baldassare et al. (2015) Baldassare, V. F., Reines, A. E., Gallo, E., & Greene, J. E. 2015, ApJ, 809, L14
- Baldi et al. (2015) Baldi, R. D., Capetti, A., & Giovannini, G. 2015, A&A, 576, A38
- Batcheldor (2010) Batcheldor, D. 2010, ApJ, 711, L108
- Beck (2001) Beck, R. 2001, Space Sci. Rev., 99, 243
- Belfiore et al. (2016) Belfiore, F., Maiolino, R., Maraston, C., et al. 2016, MNRAS, 461, 3111
- Binder et al. (2011) Binder, B., Williams, B. F., Eracleous, M., et al. 2011, ApJ, 737, 77
- Bolatto et al. (2013) Bolatto, A. D., Wolfire, M., & Leroy, A. K. 2013, ARA&A, 51, 207
- Bouchard et al. (2010) Bouchard, A., Prugniel, P., Koleva, M., & Sharina, M. 2010, A&A, 513, A54
- Briggs (1995) Briggs, D. S. 1995, in Bulletin of the American Astronomical Society, Vol. 27, American Astronomical Society Meeting Abstracts, 112.02
- Cappellari et al. (2011) Cappellari, M., Emsellem, E., Krajnović, D., et al. 2011, MNRAS, 413, 813
- Cappellari et al. (2013) Cappellari, M., McDermid, R. M., Alatalo, K., et al. 2013, MNRAS, 432, 1862
- Carilli & Walter (2013) Carilli, C. L., & Walter, F. 2013, ARA&A, 51, 105
- Chai et al. (2012) Chai, B., Cao, X., & Gu, M. 2012, ApJ, 759, 114
- Cluver et al. (2013) Cluver, M. E., Appleton, P. N., Ogle, P., et al. 2013, ApJ, 765, 93
- Condon (1992) Condon, J. J. 1992, ARA&A, 30, 575
- Cornwell et al. (2005) Cornwell, T. J., Golap, K., & Bhatnagar, S. 2005, in Astronomical Society of the Pacific Conference Series, Vol. 347, Astronomical Data Analysis Software and Systems XIV, ed. P. Shopbell, M. Britton, & R. Ebert, 86
- Croton et al. (2006) Croton, D. J., Springel, V., White, S. D. M., et al. 2006, MNRAS, 365, 11
- Dasyra & Combes (2012) Dasyra, K. M., & Combes, F. 2012, A&A, 541, L7
- Davis et al. (2012) Davis, T. A., Krajnović, D., McDermid, R. M., et al. 2012, MNRAS, 426, 1574
- del Río et al. (2004) del Río, M. S., Brinks, E., & Cepa, J. 2004, AJ, 128, 89
- Dopita & Sutherland (1996) Dopita, M. A., & Sutherland, R. S. 1996, ApJS, 102, 161
- Dopita et al. (2015) Dopita, M. A., Ho, I.-T., Dressel, L. L., et al. 2015, ApJ, 801, 42
- Dubner & Giacani (2015) Dubner, G., & Giacani, E. 2015, A&A Rev., 23, 3
- Dubois et al. (2012) Dubois, Y., Devriendt, J., Slyz, A., & Teyssier, R. 2012, MNRAS, 420, 2662
- Dubois et al. (2015) Dubois, Y., Volonteri, M., Silk, J., et al. 2015, MNRAS, 452, 1502
- Ebeling et al. (2006) Ebeling, H., White, D. A., & Rangarajan, F. V. N. 2006, MNRAS, 368, 65
- Eracleous et al. (2002) Eracleous, M., Shields, J. C., Chartas, G., & Moran, E. C. 2002, ApJ, 565, 108
- Fabian (2012) Fabian, A. C. 2012, ARA&A, 50, 455
- Fabrika (2004) Fabrika, S. 2004, Astrophysics and Space Physics Reviews, 12, 1
- Falcke et al. (2004) Falcke, H., Körding, E., & Markoff, S. 2004, A&A, 414, 895
- Fanaroff & Riley (1974) Fanaroff, B. L., & Riley, J. M. 1974, MNRAS, 167, 31P
- Fischer et al. (2013) Fischer, T. C., Crenshaw, D. M., Kraemer, S. B., & Schmitt, H. R. 2013, ApJS, 209, 1
- Fontanot et al. (2015) Fontanot, F., Monaco, P., & Shankar, F. 2015, MNRAS, 453, 4112
- Fruscione et al. (2006) Fruscione, A., McDowell, J. C., Allen, G. E., et al. 2006, in Proc. SPIE, Vol. 6270, Society of Photo-Optical Instrumentation Engineers (SPIE) Conference Series, 62701V
- Gao & Solomon (2004) Gao, Y., & Solomon, P. M. 2004, ApJ, 606, 271
- García-Burillo et al. (2014) García-Burillo, S., Combes, F., Usero, A., et al. 2014, A&A, 567, A125
- Godfrey & Shabala (2016) Godfrey, L. E. H., & Shabala, S. S. 2016, MNRAS, 456, 1172
- Goodall et al. (2011) Goodall, P. T., Alouani-Bibi, F., & Blundell, K. M. 2011, MNRAS, 414, 2838
- Goto (2007) Goto, T. 2007, MNRAS, 377, 1222
- Graham et al. (2016) Graham, A. W., Ciambur, B. C., & Soria, R. 2016, ApJ, 818, 172
- Graham & Scott (2015) Graham, A. W., & Scott, N. 2015, ApJ, 798, 54
- Green (2014) Green, D. A. 2014, Bulletin of the Astronomical Society of India, 42, 47
- Greene & Ho (2005) Greene, J. E., & Ho, L. C. 2005, ApJ, 630, 122
- Greene et al. (2006) Greene, J. E., Ho, L. C., & Ulvestad, J. S. 2006, ApJ, 636, 56
- Greene et al. (2012) Greene, J. E., Zakamska, N. L., & Smith, P. S. 2012, ApJ, 746, 86
- Greene et al. (2016) Greene, J. E., Seth, A., Kim, M., et al. 2016, ApJ, 826, L32
- Groves et al. (2006) Groves, B., Dopita, M., & Sutherland, R. 2006, A&A, 458, 405
- Guillard et al. (2012a) Guillard, P., Ogle, P. M., Emonts, B. H. C., et al. 2012a, ApJ, 747, 95
- Guillard et al. (2012b) Guillard, P., Boulanger, F., Pineau des Forêts, G., et al. 2012b, ApJ, 749, 158
- Gültekin et al. (2011) Gültekin, K., Tremaine, S., Loeb, A., & Richstone, D. O. 2011, ApJ, 738, 17
- Heckman & Best (2014) Heckman, T. M., & Best, P. N. 2014, ARA&A, 52, 589
- Ho (2008) Ho, L. C. 2008, ARA&A, 46, 475
- Ho et al. (1997) Ho, L. C., Filippenko, A. V., & Sargent, W. L. W. 1997, ApJS, 112, 315
- Ho & Ulvestad (2001) Ho, L. C., & Ulvestad, J. S. 2001, ApJS, 133, 77
- Hönig et al. (2008) Hönig, S. F., Prieto, M. A., & Beckert, T. 2008, A&A, 485, 33
- Hota et al. (2012) Hota, A., Rey, S.-C., Kang, Y., et al. 2012, MNRAS, 422, L38
- Hota & Saikia (2006) Hota, A., & Saikia, D. J. 2006, MNRAS, 371, 945
- Houck et al. (2004) Houck, J. R., Roellig, T. L., van Cleve, J., et al. 2004, ApJS, 154, 18
- Izumi et al. (2016) Izumi, T., Kohno, K., Aalto, S., et al. 2016, ApJ, 818, 42
- Karachentsev et al. (2002) Karachentsev, I. D., Sharina, M. E., Makarov, D. I., et al. 2002, A&A, 389, 812
- Kelly et al. (2017) Kelly, G., Viti, S., García-Burillo, S., et al. 2017, A&A, 597, A11
- Kennicutt (1998) Kennicutt, Jr., R. C. 1998, ApJ, 498, 541
- Kennicutt et al. (2003) Kennicutt, Jr., R. C., Armus, L., Bendo, G., et al. 2003, PASP, 115, 928
- Kharb et al. (2010) Kharb, P., Hota, A., Croston, J. H., et al. 2010, ApJ, 723, 580
- Koay et al. (2016) Koay, J. Y., Vestergaard, M., Bignall, H. E., Reynolds, C., & Peterson, B. M. 2016, MNRAS, 460, 304
- Kormendy & Ho (2013) Kormendy, J., & Ho, L. C. 2013, ARA&A, 51, 511
- Krips et al. (2011) Krips, M., Martín, S., Eckart, A., et al. 2011, ApJ, 736, 37
- Kroupa (2001) Kroupa, P. 2001, MNRAS, 322, 231
- Lacey et al. (2007) Lacey, C. K., Goss, W. M., & Mizouni, L. K. 2007, AJ, 133, 2156
- Lamastra et al. (2016) Lamastra, A., Fiore, F., Guetta, D., et al. 2016, A&A, 596, A68
- Lanz et al. (2015) Lanz, L., Ogle, P. M., Evans, D., et al. 2015, ApJ, 801, 17
- Larkin et al. (1998) Larkin, J. E., Armus, L., Knop, R. A., Soifer, B. T., & Matthews, K. 1998, ApJS, 114, 59
- Läsker et al. (2016) Läsker, R., Greene, J. E., Seth, A., et al. 2016, ApJ, 825, 3
- Lebouteiller et al. (2011) Lebouteiller, V., Barry, D. J., Spoon, H. W. W., et al. 2011, ApJS, 196, 8
- Lelli et al. (2014) Lelli, F., Verheijen, M., & Fraternali, F. 2014, MNRAS, 445, 1694
- Maksym et al. (2016) Maksym, W. P., Fabbiano, G., Elvis, M., et al. 2016, ApJ, 829, 46
- Maoz et al. (1998) Maoz, D., Koratkar, A., Shields, J. C., et al. 1998, AJ, 116, 55
- Maoz et al. (2005) Maoz, D., Nagar, N. M., Falcke, H., & Wilson, A. S. 2005, ApJ, 625, 699
- Mason et al. (2015) Mason, R. E., Rodríguez-Ardila, A., Martins, L., et al. 2015, ApJS, 217, 13
- Merloni et al. (2003) Merloni, A., Heinz, S., & di Matteo, T. 2003, MNRAS, 345, 1057
- Mezcua (2017) Mezcua, M. 2017, ArXiv e-prints, arXiv:1705.09667
- Mezcua et al. (2016) Mezcua, M., Civano, F., Fabbiano, G., Miyaji, T., & Marchesi, S. 2016, ApJ, 817, 20
- Mezcua et al. (2015) Mezcua, M., Roberts, T. P., Lobanov, A. P., & Sutton, A. D. 2015, MNRAS, 448, 1893
- Mirabel & Rodríguez (1999) Mirabel, I. F., & Rodríguez, L. F. 1999, ARA&A, 37, 409
- Moffet (1975) Moffet, A. T. 1975, Strong Nonthermal Radio Emission from Galaxies (the University of Chicago Press), 211
- Morganti et al. (2015) Morganti, R., Oosterloo, T., Oonk, J. B. R., Frieswijk, W., & Tadhunter, C. 2015, A&A, 580, A1
- Mortlock et al. (2011) Mortlock, D. J., Warren, S. J., Venemans, B. P., et al. 2011, Nature, 474, 616
- Mouri et al. (2000) Mouri, H., Kawara, K., & Taniguchi, Y. 2000, ApJ, 528, 186
- Mukherjee et al. (2016) Mukherjee, D., Bicknell, G. V., Sutherland, R., & Wagner, A. 2016, MNRAS, 461, 967
- Müller-Sánchez et al. (2011) Müller-Sánchez, F., Prieto, M. A., Hicks, E. K. S., et al. 2011, ApJ, 739, 69
- Murphy et al. (2011) Murphy, E. J., Condon, J. J., Schinnerer, E., et al. 2011, ApJ, 737, 67
- Nagar et al. (2005) Nagar, N. M., Falcke, H., & Wilson, A. S. 2005, A&A, 435, 521
- Netzer (2015) Netzer, H. 2015, ARA&A, 53, 365
- Nguyen et al. (2017) Nguyen, D. D., Seth, A. C., den Brok, M., et al. 2017, ApJ, 836, 237
- Nyland et al. (2012) Nyland, K., Marvil, J., Wrobel, J. M., Young, L. M., & Zauderer, B. A. 2012, ApJ, 753, 103
- Nyland et al. (2013) Nyland, K., Alatalo, K., Wrobel, J. M., et al. 2013, ApJ, 779, 173
- Nyland et al. (2016) Nyland, K., Young, L. M., Wrobel, J. M., et al. 2016, MNRAS, 458, 2221
- Ogle et al. (2010) Ogle, P., Boulanger, F., Guillard, P., et al. 2010, ApJ, 724, 1193
- Pakull et al. (2010) Pakull, M. W., Soria, R., & Motch, C. 2010, Nature, 466, 209
- Paragi et al. (2014) Paragi, Z., Frey, S., Kaaret, P., et al. 2014, ApJ, 791, 2
- Pereira-Santaella et al. (2010) Pereira-Santaella, M., Diamond-Stanic, A. M., Alonso-Herrero, A., & Rieke, G. H. 2010, ApJ, 725, 2270
- Perley & Butler (2013) Perley, R. A., & Butler, B. J. 2013, ApJS, 204, 19
- Pogge (1988) Pogge, R. W. 1988, ApJ, 328, 519
- Pogge et al. (2000) Pogge, R. W., Maoz, D., Ho, L. C., & Eracleous, M. 2000, ApJ, 532, 323
- Querejeta et al. (2016) Querejeta, M., Schinnerer, E., García-Burillo, S., et al. 2016, A&A, 593, A118
- Quintero et al. (2004) Quintero, A. D., Hogg, D. W., Blanton, M. R., et al. 2004, ApJ, 602, 190
- Rau & Cornwell (2011) Rau, U., & Cornwell, T. J. 2011, A&A, 532, A71
- Reines & Deller (2012) Reines, A. E., & Deller, A. T. 2012, ApJ, 750, L24
- Reines et al. (2016) Reines, A. E., Reynolds, M. T., Miller, J. M., et al. 2016, ApJ, 830, L35
- Reines et al. (2011) Reines, A. E., Sivakoff, G. R., Johnson, K. E., & Brogan, C. L. 2011, Nature, 470, 66
- Reines & Volonteri (2015) Reines, A. E., & Volonteri, M. 2015, ApJ, 813, 82
- Riffel et al. (2013) Riffel, R., Rodríguez-Ardila, A., Aleman, I., et al. 2013, MNRAS, 430, 2002
- Rodríguez-Ardila et al. (2004) Rodríguez-Ardila, A., Pastoriza, M. G., Viegas, S., Sigut, T. A. A., & Pradhan, A. K. 2004, A&A, 425, 457
- Roussel et al. (2007) Roussel, H., Helou, G., Hollenbach, D. J., et al. 2007, ApJ, 669, 959
- Sage & Wrobel (1989) Sage, L. J., & Wrobel, J. M. 1989, ApJ, 344, 204
- Satyapal et al. (2004) Satyapal, S., Sambruna, R. M., & Dudik, R. P. 2004, A&A, 414, 825
- Seth et al. (2010) Seth, A. C., Cappellari, M., Neumayer, N., et al. 2010, ApJ, 714, 713
- Shirakata et al. (2016) Shirakata, H., Kawaguchi, T., Okamoto, T., et al. 2016, MNRAS, 461, 4389
- Sikora (2009) Sikora, M. 2009, Astronomische Nachrichten, 330, 291
- Silk (2017) Silk, J. 2017, ApJ, 839, L13
- Smith et al. (1998) Smith, H. E., Lonsdale, C. J., & Lonsdale, C. J. 1998, ApJ, 492, 137
- Smith et al. (2007) Smith, J. D. T., Draine, B. T., Dale, D. A., et al. 2007, ApJ, 656, 770
- Soker (2016) Soker, N. 2016, ArXiv e-prints, arXiv:1605.02672
- Solomon et al. (1987) Solomon, P. M., Rivolo, A. R., Barrett, J., & Yahil, A. 1987, ApJ, 319, 730
- Somerville & Davé (2015) Somerville, R. S., & Davé, R. 2015, ARA&A, 53, 51
- Soria et al. (2010) Soria, R., Pakull, M. W., Broderick, J. W., Corbel, S., & Motch, C. 2010, MNRAS, 409, 541
- Taylor et al. (2015) Taylor, C. L., Petitpas, G. R., & del Rio, M. S. 2015, AJ, 149, 187
- Terashima & Wilson (2003) Terashima, Y., & Wilson, A. S. 2003, ApJ, 583, 145
- Thilker et al. (2010) Thilker, D. A., Bianchi, L., Schiminovich, D., et al. 2010, ApJ, 714, L171
- Tikhonov et al. (2003) Tikhonov, N. A., Galazutdinova, O. A., & Aparicio, A. 2003, A&A, 401, 863
- Ulvestad et al. (1999) Ulvestad, J. S., Wrobel, J. M., Roy, A. L., et al. 1999, ApJ, 517, L81
- van Wassenhove et al. (2010) van Wassenhove, S., Volonteri, M., Walker, M. G., & Gair, J. R. 2010, MNRAS, 408, 1139
- Veilleux & Osterbrock (1987) Veilleux, S., & Osterbrock, D. E. 1987, ApJS, 63, 295
- Volonteri (2010) Volonteri, M. 2010, A&A Rev., 18, 279
- Volonteri et al. (2016) Volonteri, M., Dubois, Y., Pichon, C., & Devriendt, J. 2016, MNRAS, 460, 2979
- Wiklind & Henkel (1990) Wiklind, T., & Henkel, C. 1990, A&A, 227, 394
- Wong et al. (2016) Wong, O. I., Koss, M. J., Schawinski, K., et al. 2016, MNRAS, 460, 1588
- Wrobel et al. (2001) Wrobel, J. M., Fassnacht, C. D., & Ho, L. C. 2001, ApJ, 553, L23
- Wrobel et al. (2008) Wrobel, J. M., Greene, J. E., Ho, L. C., & Ulvestad, J. S. 2008, ApJ, 686, 838
- Wrobel & Ho (2006) Wrobel, J. M., & Ho, L. C. 2006, ApJ, 646, L95
- Wrobel & Nyland (2012) Wrobel, J. M., & Nyland, K. 2012, AJ, 144, 160
- Wu et al. (2015) Wu, X.-B., Wang, F., Fan, X., et al. 2015, Nature, 518, 512
- Yuan & Narayan (2014) Yuan, F., & Narayan, R. 2014, ARA&A, 52, 529
- Zakamska & Greene (2014) Zakamska, N. L., & Greene, J. E. 2014, MNRAS, 442, 784
- Zschaechner et al. (2016) Zschaechner, L. K., Walter, F., Bolatto, A., et al. 2016, ApJ, 832, 142