PHL 6625: A Minor Merger-Associated QSO Behind NGC 247
Abstract
PHL 6625 is a luminous quasi-stellar object (QSO) at located behind the nearby galaxy NGC 247 (). Hubble Space Telescope (HST) observations revealed an arc structure associated with it. We report on spectroscopic observations with the Very Large Telescope (VLT) and multiwavelength observations from the radio to the X-ray band for the system, suggesting that PHL 6625 and the arc are a close pair of merging galaxies, instead of a strong gravitational lens system. The QSO host galaxy is estimated to be , and the mass of the companion galaxy of is estimated to be , suggesting that this is a minor merger system. The QSO displays typical broad emission lines, from which a black hole mass of about and an Eddington ratio of about 0.01–0.05 can be inferred. The system represents an interesting and rare case where a QSO is associated with an ongoing minor merger, analogous to Arp 142.
Subject headings:
galaxies: interactions — Galaxies: active — Galaxies: nuclei — quasars: supermassive black holes1. Introduction
Quasi-stellar objects (QSOs) or quasars are believed to be powered by accretion onto supermassive black holes in the centers of galaxies. How quasars are triggered is still not clear and under investigation. It is generally accepted that major mergers can trigger substantial star formation and possibly accretion onto the central black hole. Sanders et al. (1988) proposed that major mergers, particularly between gas-rich disk galaxies, might drive gas to flow toward the nuclear region and initiate starburst, and then the triggering of the quasar phase. This picture is in good agreement with numerical simulations (e.g., Hernquist, 1989; Hopkins et al., 2006). Observations of the ultraluminous infrared galaxies (ULIRGs) indicate that merging features (Sanders & Mirabel, 1996) and the quasar fraction (Kartaltepe et al., 2010) are strongly correlated with their IR luminosities, implying that major mergers and quasar activity may have a connection.
Minor mergers have been proposed to induce the fueling of low-luminosity AGNs and explain some observational features, such as the random orientation of narrow-line regions with respect to the host disks, the excess of ring-like structures and their off-center locations, and their amorphous morphology (e.g., Taniguchi, 1999; Combes et al., 2009). Several authors suggested separating the fueling mechanisms for quasars from that for low-luminosity AGNs: major mergers trigger quasars, while minor mergers trigger low-luminosity AGNs (Hopkins & Hernquist, 2009; Taniguchi, 2013). However, it is still uncertain if minor mergers could trigger high-luminosity AGN (quasar) activity. Significant fine structures such as shells and tidal tails were observed in deep Hubble Space Telescope (HST) images of four out of five elliptical low-redshift quasar host galaxies, which can be explained as due to minor mergers between a dwarf galaxy and a giant elliptical galaxy (Bennert et al., 2008). Thus, Bennert et al. (2008) suggested that minor mergers might trigger the observed quasar activity. Moreover, Tadhunter et al. (2014) examined 32 quasar-like AGN host galaxies and found that their dust masses were intermediate between those of quiescent elliptical galaxies and ULIRGs, suggesting that most of these AGNs were triggered in mergers between giant elliptical galaxies and relatively low gas mass companion galaxies.
It is also debatable whether the central black holes can be ignited in an interacting close pair at the early stage of merging when they start to have tidal interactions but are still spatially separate; some observations lead to a positive answer (e.g., Ellison et al., 2011; Silverman et al., 2011; Liu et al., 2012) while others do not (e.g., Ellison et al., 2008).
This study is unable to address these questions from a statistical point of view, but it presents an interesting case where a luminous QSO (PHL 6625) is found in a close pair of a merging system in the local universe. PHL 6625 (, see § 2.2 for details) is a radio-quiet QSO projected on the outskirts of a nearby spiral galaxy, NGC 247 (, Karachentsev et al., 2013). It was detected as a redshifted object behind NGC 247 by Margon et al. (1985). In 2011 October, Tao et al. (2012) serendipitously discovered that PHL 6625 was associated with an arc structure on an HST image. We thus conducted new observations to further investigate its nature.
| Model | QSO (model) | Host (model) | QSO (mag) | Host (mag) | Reduced (dof) |
|---|---|---|---|---|---|
| (1) | (2) | (3) | (4) | (5) | (6) |
| 1a | PSF | Sérsic () | 1.803 (31954) | ||
| 1b | PSF + Sérsic () | Sérsic () | 1.318 (31947) | ||
| 2a | PSF | Exponential | 2.402 (31955) | ||
| 2b | PSF + Sérsic () | Exponential | 1.393 (31948) | ||
| 3a | PSF | Sérsic () + Sérsic () | 1.318 (31947) | ||
| 3b | PSF + Sérsic () | Sérsic () + Sérsic () | 1.316 (31940) | ||
| 4a | PSF | Sérsic () + Exponential | 1.393 (31948) | ||
| 4b | PSF + Sérsic () | Sérsic () + Exponential | 1.316 (31941) |
Note. — Some models are identical (1b = 3a, 2b = 4a); the difference is whether the small-index Sérsic is attributed to the QSO or the host galaxy.
The projected distance of the quasar from NGC 247 at the distance of NGC 247 (3.4 Mpc, Gieren et al., 2009) is about 4.4 kpc. Thanks to its spatial location and strong X-ray emission, PHL 6625 is of interest in probing the halo of NGC 247 and acts as a useful probe to detect the “missing baryons,” which have an observational deficit (e.g., Shull et al., 2012) compared with cosmological predictions. Some of the missing baryons in the local universe are thought to be locked in the warm-hot intergalactic medium, which can be detected via X-ray absorption lines in the presence of a background QSO using next generation telescopes (Yao et al., 2012).
In this paper, we report spectroscopic observations for PHL 6625 and its nearby arc structure with the Very Large Telescope (VLT) of the European Southern Observatory (ESO), along with multiwavelength observations from the radio to the X-ray band. We adopt a cosmology with , , and and a luminosity distance of 2.14 Gpc to PHL 6625 ().
2. Observations and data analysis
2.1. HST imaging
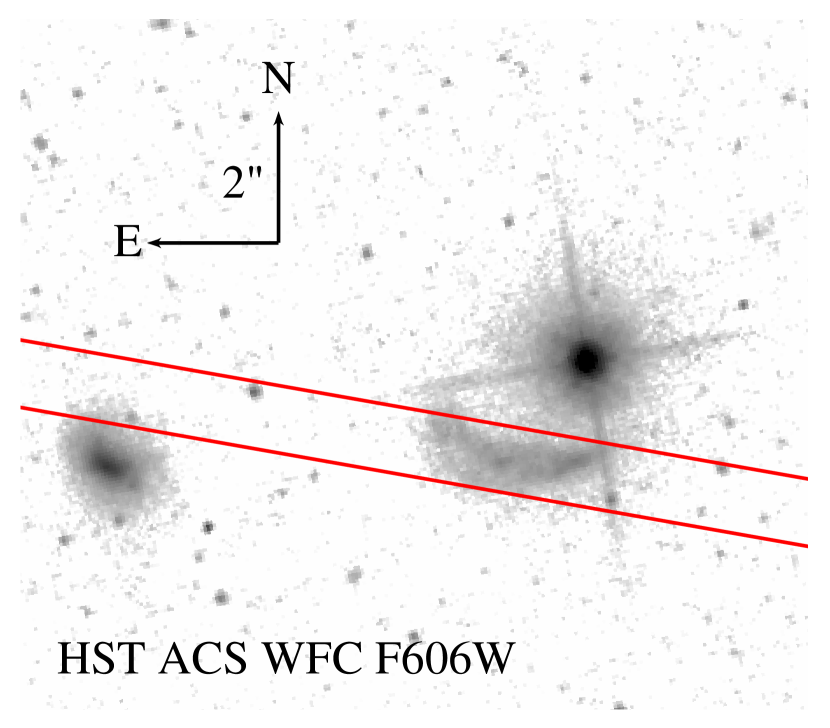
HST observed the northwestern region of NGC 247 on 2011 October 11 (proposal ID 12375), using the broadband filter F606W of the Wide Field Channel (WFC) on the Advanced Camera for Surveys (ACS) with two sub-exposures for a total exposure of 846 s. The observation was designed to use the QSO PHL 6625, which was known to be bright in both the X-ray and optical bands, to align the Chandra and HST images to improve their relative astrometry (Tao et al., 2012). However, it serendipitously found that the QSO was associated with an arc structure to its southeast; see Figure 1. The QSO is projected at about 0.4 times the radius of NGC 247 (de Vaucouleurs et al., 1991) in a relatively uncrowded environment.
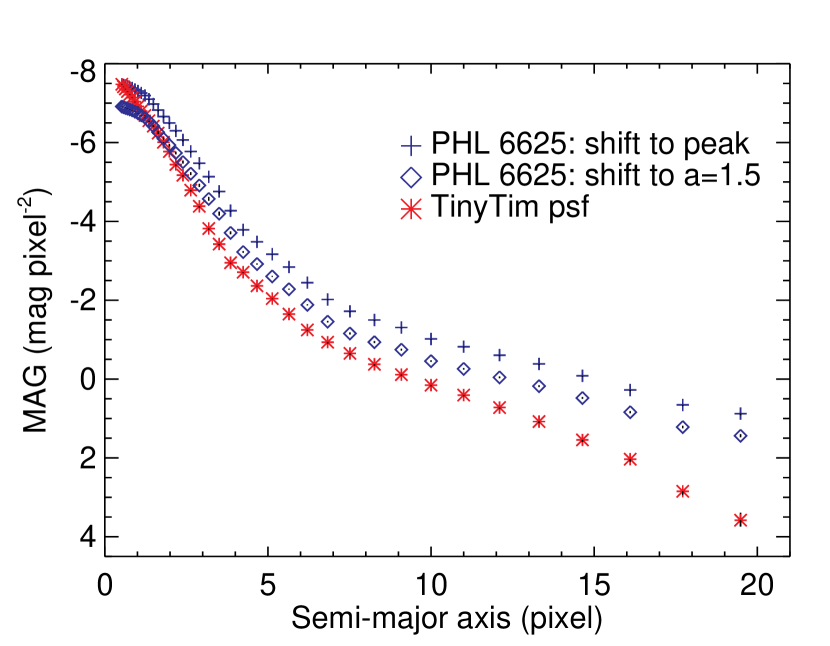
A reasonable point-spread function (PSF) is needed to analyze the QSO image. Looking through the archival HST images111The observing date of proposal ID 12375 was later than the Servicing Mission 4 (SM4) of HST. In SM4, the ACS was repaired, and the PSF might be affected. Therefore, the PSF stars are searched in the observations after SM4., isolated bright stars with a flat background cannot be found at a similar chip position. We thus derived a synthetic PSF by synthesizing PSF models generated by the TinyTim tool (Krist, 1995) onto the flat-fielded calibrated (_flc) data and drizzling them into science images using the astrodrizzle task. The azimuthally averaged radial profiles of the QSO and the TinyTim PSF are computed using the ellipse task in the IRAF/STSDAS package and plotted in Figure 2 for comparison. They are shifted to have the same brightness at the center (0.5 pixel). As the core ( pixels) of the QSO image is saturated due to high brightness and may be not useful, we also compared the two profiles by matching their magnitudes at a radius of 1.5 pixels, beyond which there is no saturation. In either way, the PSF profile is significantly narrower than that for the QSO, suggestive of an additional component (likely the host galaxy) underneath the QSO component.
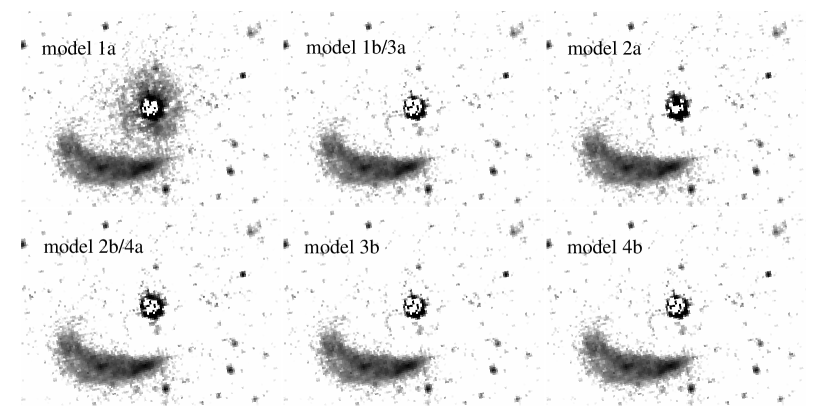
The QSO image is decomposed into a QSO component and a host galaxy component using GALFIT (Peng et al., 2002, 2010). The arc structure, central saturated pixels, and nearby stars are masked away during the fit. Without information from the central pixels, it is hard to reconstruct the bulge component unless it is sufficiently extended. We thereby experimented with several models to explore the systematics in the modeling. For the QSO, we also tried a PSF with the addition of a small-index Sérsic profile to account for PSF artifacts. For the host galaxy, we tested with either a single-component model (a Sérsic or an exponential disk) or a two-component model (two Sérsics or a Sérsic + an exponential disk). These lead to eight combinations of models, tabulated in Table 1. The simplest models with only two components (model 1a and 2a) do not provide adequate fits, while any model with three or four components can fit the image similarly well. The residuals are shown in Figure 3 for comparison. Therefore, we discard the simplest (two-component) models and adopt the magnitude range derived from other models as a conservative estimate of its uncertainty, for both the QSO and the host galaxy.
The flux of the companion arc galaxy is measured using aperture photometry, with a visually defined polygon aperture and nearby source-free regions for background estimate. Assuming a flat spectrum ( ) for the arc and the QSO host galaxy, and a power-law spectrum for the QSO (see § 2.2.1 for details), the measured count rates can be translated to dereddened, K-corrected, absolute magnitudes of [21.87, 22.30], [19.52, 21.62], and 19.86, respectively, for the QSO, the QSO host galaxy, and the arc galaxy. Assuming a solar -band magnitude of 5.48 (Binney & Merrifield, 1998), the total luminosity in the -band is, respectively, , , and for the three objects in the same order. The projected size of the arc galaxy is roughly 16 by 4 kpc.
2.2. VLT spectroscopy
To unveil the nature of the QSO and the arc galaxy, we conducted spectroscopic observations with the ESO 8.2-m diameter VLT at Paranal in Chile (program ID 091.A-0149(A)), using the FORS2 long-slit spectrograph mounted on the unit telescope 1 (UT1). A red (GRIS_300I) and blue (GRIS_600B) grism is used, respectively, to cover a wavelength range from 3700–10000Å. The blue setup of the arc is spilt into two identical observations. Each observation consists of two (for the QSO) or three (for the arc) observation blocks (OBs) with an offset of 3″ along the spatial direction between successive ones for bad pixel and cosmic-ray removal. We used a 1″ slit and a binning of pixels, resulting in a sampling of 2.8Å/pixel in the red and 1.32Å/pixel in the blue. The spectral resolution in FWHM found from the lamp lines varies from 11.3–12.9Å in the red and 5.3–5.9Å in the blue. For the QSO observations, the slit is oriented across both the QSO and the central region of the arc, while for the arc observations, the slit is placed along its major axis. The observational log is listed in Table 2 and the location of the slit for the arc observation is displayed in Figure 1.
| Obj | Start time | Grism | Exposure | Airmass | Seeing |
|---|---|---|---|---|---|
| (2013; UT) | (s) | (″) | |||
| QSO | Jul 17 09:04:08 | 300I | 1.009 | 0.6 | |
| QSO | Jul 18 09:30:59 | 600B | 1.003 | 0.7 | |
| arc | Aug 04 05:54:06 | 300I | 1.169 | 0.7 | |
| arc | Aug 04 06:51:06 | 600B | 1.054 | 0.9 | |
| arc | Aug 04 07:44:30 | 600B | 1.012 | 0.7 |
The esorex package was used to create bias-subtracted, flat-fielded, and wavelength-calibrated 2D spectra for each OB, using calibration files obtained in the same night. The imcombine task in IRAF was then used to combine different OBs and remove cosmic rays with the option crreject. The 1D spectra were extracted using the apall task. The trace information was obtained by fitting the QSO spectra and was applied for the extraction of the arc spectra. The source aperture size is around 10–11 pixels for the QSO and 18–20 pixels for the arc, and the background was estimated by fitting fluxes from two source-free regions on each side. The standard star LTT 1020 observed in the same night as the arc observations was used for flux calibration. An extinction table created on 2011 January 18 was used for atmospheric extinction correction.
The red or blue spectra from individual OBs for either the QSO or arc are averaged. The red spectra have a flux higher than the blue spectra in their overlapping region, which is due to a smaller PSF image size in the red. We thus scale the blue flux by a constant factor of 1.2 to yield a consistent flux in their overlapping wavelength range. Spectral smoothing is done with a 5 pixel median filter.
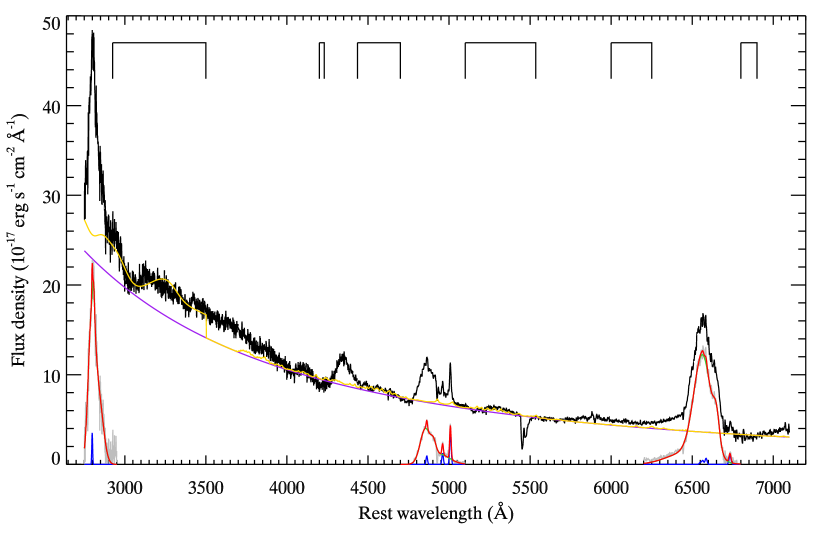
The observed QSO and arc spectra are shown in Figures 4 and 5, respectively. The QSO spectrum exhibits characteristic emission lines, such as broad Mg ii, H and H, narrow [O iii] 4959,5007 and Balmer lines. The absorption features around 5450Å are telluric. The arc spectrum shows some narrow emission lines, such as [O ii] 3728, H, [O iii] 5007, H and [N ii] 6583 and some weak absorption lines, such as Ca ii K 3933 and Ca ii H 3968. The arc spectrum is contaminated by the QSO, showing broad H and Mg ii lines (see § 2.2.2 for details). The redshift of the QSO is measured to be from the [O iii] 4959,5007 emission lines. The redshift of the arc, using the QSO-contamination-subtracted spectrum, is measured to be via [O ii] and H emission lines, and consistent with the value of measured via the Ca ii K 3933 and Ca ii H 3968 absorption lines. The arc is likely located nearer than the QSO and moving toward it with a line-of-sight velocity of roughly 340 km s-1.
2.2.1 Decomposition of the QSO spectrum
The QSO spectrum is decomposed into multiple emission components following Shen et al. (2008). The fitting is performed in the rest-frame wavelength range of 2750–7100Å, where the S/N is sufficiently high. First, a pseudo-continuum was fitted to the spectrum in some continuum windows2222925–3500Å, 4200–4230Å, 4435–4700Å, 5100–5535Å, 6000–6250Å, and 6800–6900Å at the rest frame., consisting of a power-law component and Fe ii templates in both the Mg ii region (Salviander et al., 2007) and the H region (Boroson & Green, 1992). The continuum-subtracted line spectrum was then fitted with multiple Gaussian components: three Gaussians for each of the H, H, and Mg ii broad components; five Gaussians for narrow lines in the H region333Two for [S ii], two for [N ii], and one for narrow H., three near H444Two for [O iii] and one for narrow H., and one for narrow Mg ii. All of the narrow lines are imposed to have the same shift and width.
| Note | ||
|---|---|---|
| Power-law spectral index, | ||
| erg s-1 | of the power-law component | |
| erg s-1 | of the power-law component | |
| FWHM(Mg ii) | 6269 km s-1 | Broad component |
| FWHM(H) | 6447 km s-1 | Broad component |
| FWHM(H) | 7314 km s-1 | Broad component |
| 8.43 | Based on and FWHM(H), and (Ref. 1) | |
| 8.74 | Based on and FWHM(H), and (Ref. 2) | |
| 8.47 | Based on and FWHM(H), and (Ref. 3) | |
| 8.29 | Based on and FWHM(H), and (Ref. 1) | |
| 8.25 | Based on filtered luminosities (Ref. 1) |
The monochromatic continuum luminosity of the power-law component at the rest frame 3000Å and 5100Å, the power-law spectral index, and the broad-line width derived from the global fitting are listed in Table 2.2.1. Based on the radius-luminosity () relation, the black hole mass in the QSO can be estimated from the line width and the continuum luminosity with a single-epoch spectrum, i.e., (Shen, 2013). Here we use five recipes that were calibrated against H reverberation-mapped masses: the updated Vestergaard & Peterson (2006) formula described in Feng et al. (2014) that assumes theoretical slopes ( and ) on the luminosity and line width, the calibration of Ho & Kim (2015) based on a best-fit slope for the relation (; Bentz et al., 2013) and , the calibration of Wang et al. (2009) with and a best-fit slope for the single-epoch FWHM versus rms line dispersion relation (), one based on best-fit slopes for both the luminosity and line width ( and ; Feng et al., 2014), and a novel technique (Feng et al., 2014) that establishes a correlation between the black hole mass and filtered luminosities (luminosities extracted in two wavelength bands). All the recipes give consistent results for a black hole mass of about , also listed in Table 2.2.1. If we use the second moment (line dispersion; Peterson et al., 2004) instead of the FWHM, the inferred black hole mass is consistent with the result above within the intrinsic scatter (a factor of 2).
| Extinction () | |||||
|---|---|---|---|---|---|
| [O ii] 3728 | H | [O iii] 5007 | H | [N ii] 6583 |
|---|---|---|---|---|
Note. — in units of erg s-1
2.2.2 Population synthesis for the Arc galaxy
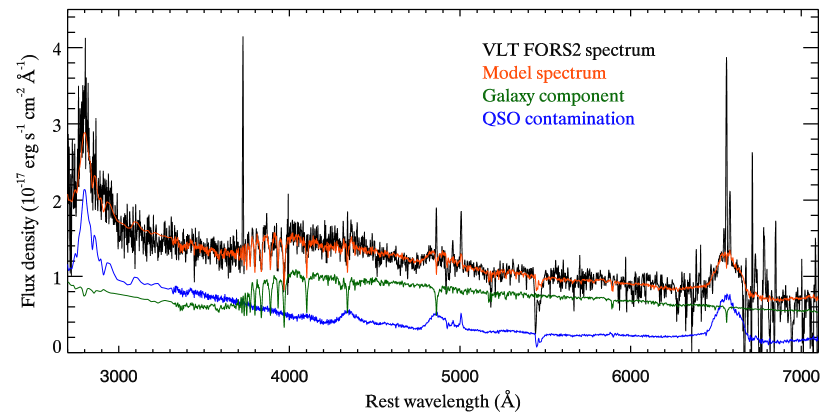
The stellar population synthesis code STARLIGHT (Cid Fernandes et al., 2005) was used to fit the arc spectrum. As the arc spectra may be contaminated by flux from the QSO, we added the QSO spectrum into the simple stellar population (SSP) fitting library as a model template. We then fit the arc spectrum with the stellar components using the BC03 theoretical library (150 SSPs with 25 ages and 6 metallicities, Bruzual & Charlot, 2003) with Chabrier’s initial mass function (Chabrier, 2003). Assuming that the flux error follows a Gaussian distribution, we generated 50 mock spectra to estimate the parameter uncertainties.
The scaling factor for a QSO contribution to the arc spectrum is found to be 3.5% from the fit. We fit a Moffat function to the QSO on the acquisition image, and estimate that the QSO roughly contributes 3.4% of its flux to the arc aperture, in reasonable agreement with the result from the spectral fitting. After the QSO contribution is removed, the arc spectrum barely shows broad-line components (H and Mg ii).
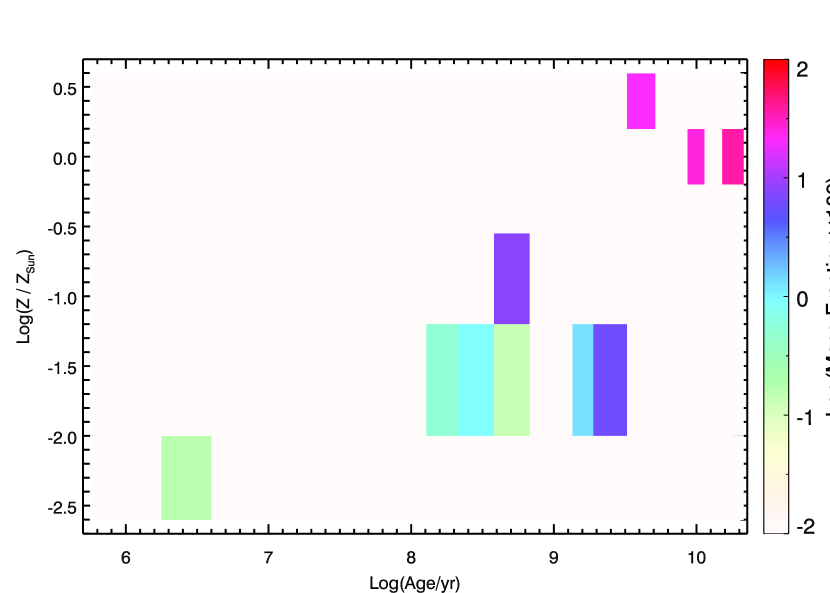
The STARLIGHT fitting results are listed in Table 4, including the stellar mass, star-derived extinction, and luminosity-weighted and mass-weighted ages and metallicities. The best-fit model spectrum is shown in Figure 5 and the decomposed star formation history (SFH) is shown in Figure 6. The emission line luminosities are measured from the galaxy model and QSO template subtracted spectrum. The gas-derived extinction was derived from the star-derived extinction, assuming the ratio between the gas-derived and star-derived extinction to be 0.44 (Calzetti, 2001). The dereddened luminosities are listed in Table 5. The ratio of , , is consistent with the Balmer decrement (2.86, Osterbrock, 1989). The luminosity of the [O iii] 5007 line only accounts for 0.1% of the observed flux in the HST F606W filter, suggesting that the arc is truly made of stars rather than some extended ionized gas.
A single Gaussian component is able to fit each of the narrow lines in the contamination-subtracted arc spectrum, and no obvious residuals are seen. The observed FWHM of the emission/absorption lines corrected for instrumental broadening is consistent with zero within errors, which agrees with the result that the stellar velocity dispersion (200 km s-1) derived from the fundamental plane (summarized in Kormendy & Ho, 2013) is smaller than the instrument dispersion (¿ 300 km s-1) and hence unresolved.
The star formation rate (SFR) is estimated from the strongest emission line H (Kennicutt et al., 1994; Madau et al., 1998; Kennicutt, 1998) assuming solar abundance and Salpeter (1955)’s IMF,
| (1) |
We derived an SFR for the arc galaxy, yr-1, and a specific SFR (SFR per stellar-mass unit), = 0.15 Gyr-1. Using Kennicutt (1998)’s calibration, the SFR derived from the [O ii] 3728 line gives a marginally consistent result, yr-1. Given a redshift of 0.3954 and the range estimated above, the stellar mass is estimated to be if the source lies on the main sequence of star-forming galaxies (Whitaker et al., 2012), consistent with derived from the population synthesis.
Given the metallicities and ages in Table 4, we can predict a mass-to-light ratio () of and in the -band following Maraston (2005), for luminosity-weighted and mass-weighted measurements, respectively. Using the mass obtained from the stellar population synthesis and the blue luminosity measured from the HST image, this ratio is , larger than the luminosity-weighted estimate but smaller than the mass-weighted estimate.
The [N ii][O ii] of the arc galaxy is , which meets the criterion for the upper branch (Kewley & Ellison, 2008). Using the metallicity calibration of Zaritsky et al. (1994), we obtained to be 8.88. Assuming a solar metallicity of (Delahaye & Pinsonneault, 2006), the metallicity is estimated to be , similar to the value derived from the STARLIGHT mass-weighted measurement and consistent with the value of estimated from 10 different mass-metallicity relations listed in Kewley & Ellison (2008). These results are not sensitive to QSO contamination; consistent results are obtained without removing the QSO contamination.
2.3. X-Ray spectra with XMM-Newton
| Parameter | 2009 | 2014 |
|---|---|---|
| ( cm-2) | 2.07 fixed | 2.07 fixed |
| ( cm-2) | ||
| PL photon index | ||
| PL normaaPower-law normalization in units of photons keV-1 cm-2 s-1 at 1 keV. | ||
| (keV) | ||
| (ph cm-2 s-1) | ||
| EW (eV) | 71 | |
| (erg cm-2 s-1) | ||
| (erg cm-2 s-1) | ||
| (erg s-1) | ||
| (erg s-1) | ||
| / degree of freedom | 96.5/93 | 135.9/121 |
Note. — The XSPEC models are TBabs phabs(zgauss + zpowerlw) for the 2009 observation and TBabs phabs zpowerlw for the 2014 observation. is the energy of the absorption feature in the rest frame. is the observed flux quoted in the observed frame and is the intrinsic luminosity corrected for absorption in the rest frame. All errors are quoted at the 90% confidence level.


The Chandra observation suggests that the X-ray emission arises from a point-like source spatially coincident with the QSO; there is no X-ray emission detected in the arc region (Tao et al., 2012). XMM-Newton observed the galaxy on 2009 December 27 and 2014 July 1 (ObsID 0601010101 and 0728190101, respectively). An earlier observation made on 2001 July 8 was not used due to heavy background contamination. Only data from the PN CCD were used for analysis. New events files were created with up-to-date calibration files. Events were selected from low background intervals, where the background flux is within of the mean quiescent level, adding up to an effective exposure of 19.0 ks and 24.3 ks, respectively, for the two observations. The source energy spectra were extracted from a circular region of 32″radius, and the background spectra were extracted from nearby circular regions on the same chip at a similar readout distance. The spectral bins were grouped such that each new bin is 1/4 of the local FWHM and has at least 15 counts, from 0.2 keV to 10 keV.
We tried to fit the energy spectra with a redshifted power-law model subject to interstellar absorption. The TBabs model (Wilms et al., 2000) is used to account for Galactic absorption, and the column density is fixed at the Galactic value cm-2 (Kalberla et al., 2005), while phabs is adopted for additional extragalactic absorption. For the 2009 observation, we obtained consistent results with those reported by Jin et al. (2011), if the same model and energy range are used. However, we found that a simple power-law model is insufficient to fit the data. An absorption feature near 2.12 keV in the rest frame (or 1.54 keV in the observed frame) and excessive emission above 10 keV in the rest frame (or 7 keV in the observed frame) are possibly shown in the residual. We further added a zero-width Gaussian component to fit the absorption feature. The addition of the absorption line reduced the by 24.6, corresponding to a chance probability of . The hard excess could be due to a reflection component, which is often seen in the spectra of AGNs and Galactic accreting black holes, but the current data quality and energy coverage do not allow us to quantify it. For the 2014 observation, a simple power-law model can adequately fit the data. The spectra are shown in Figure 7 and the best-fit parameters are listed in Table 6.
2.4. Multiwavelength SED
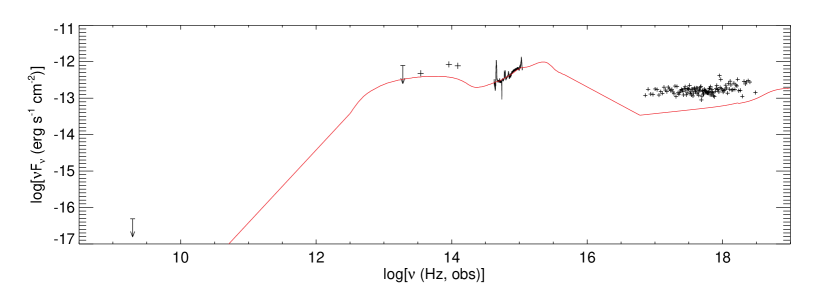
NGC 247 was observed by the Wide-field Infrared Survey Explorer (WISE) in 2010 with the passbands W1 (3.4 m), W2 (4.6 m), W3 (12 m) and W4 (22 m). The QSO was detected in the W1, W2 and W3 bands with a signal-to-noise ratio (SNR) larger than 9, while in the W4 band, the source was not detected. From the AllWISE Source Catalog in NASA/IPAC Infrared Science Archive (IRSA)555http://irsa.ipac.caltech.edu/applications/Radar/, we obtained the profile-fitting photometry for the W1, W2, and W3 bands in VEGA magnitudes, and a 95% upper limit for the W4 band, which are , , and for the W1, W2, W3 and W4 bands, respectively. Using the zero magnitude flux density and the color corrections from Wright et al. (2010), the observed VEGA magnitudes were translated to flux density, which are , , and erg cm-2 s-1 Hz-1 for the four bands in the same order. Moreover, the QSO was not detected in the 1.4 GHz NRAO VLA Sky Survey (NVSS), suggesting a flux less than 2.5 mJy (Elvis et al., 1997). The multiwavelength spectral energy distribution (SED) from the radio to the X-ray band with a QSO SED template renormalized in the optical band (Hopkins et al., 2007) is shown in Figure 8.
3. Discussion
The consistent redshifts of the two galaxies suggest that they are a merger event, between a luminous QSO (PHL 6625) and a tidally distorted companion galaxy, instead of a strong gravitational lens system. The stellar content of the two galaxies are not in contact yet, and the mass fraction of young stars is less than 1% (Figure 6), suggesting they are at the early stage of a merging process. Such a system seems to be an analogue of the nearby event Arp 142 (NGC 2936/37) in morphology (e.g., Romano et al., 2008), except that the central black hole in PHL 6625 is an active quasar.
3.1. A major or minor merger?
The broadening of the QSO image (Figure 2) suggests that an underlying component possibly due to its host galaxy is detected. However, due to the saturation of the central pixels, the galaxy bulge cannot be spatially resolved. A conservative estimate of the -band luminosity of the QSO host galaxy is , corresponding to a mass of assuming a typical mass-to-light ratio of 4 (Faber & Gallagher, 1979). The black hole mass for the QSO is estimated to be via different techniques. Assuming an - relation (Kormendy & Ho, 2013),
| (2) |
we can derive the bulge mass to be with an intrinsic scatter of 0.28 dex (a factor of 2). This is consistent with the mass range estimated from image decomposition, and suggests that the QSO host galaxy may be an elliptical or a bulge-dominated system. If we adopt the total mass range of the host galaxy, PHL 6625 also follows the distribution of AGNs at in the - plane (Figure 38 of Kormendy & Ho, 2013), and is consistent with the - relation at (Kormendy & Ho, 2013). In summary, the QSO and its host seem to be a canonical example on the co-evolution path.
The stellar mass of the arc galaxy, using the population synthesis measurement, is about , indicating that the mass ratio of the QSO host galaxy and the arc galaxy is around 10, suggesting that the system is a minor merger. Given the -band luminosity of the arc galaxy of and derived from the luminosity-weighted metallicity of the population synthesis model, the stellar mass of the arc galaxy is on the order of , and the system is also likely to be a minor merger. But if derived from the mass-weighted metallicity is used, the stellar mass of the arc galaxy will be more than 10 times higher, and the system could be a major merger. However, during the population synthesis fit, the mass-to-light ratio of young stars (age year) is about one-sixth that of old stars (age year), then any small light-fraction variations of young stellar populations will make large mass-fraction variations on old stellar populations and result in huge uncertainties in the mass-weighted metallicity and mass-to-light ratio. Thus, the luminosity-weighted measurement is more reliable than the mass-weighted measurement, and the system is more likely to be a minor merger, although a major merger cannot be excluded.
3.2. Multiwavelength properties of the QSO
While there is some weak evidence for mild spectral variability, the QSO outputs a consistent luminosity in the X-ray band ( erg s-1 in 0.3-10 keV, rest frame). The bolometric luminosities, , calculated from the unabsorbed flux in the 0.01–100 keV range, are, respectively, erg s-1 and erg s-1 for the 2009 and 2014 observations, corresponding to an Eddington ratios () of about . This implies a bolometric correction factor of 3–5 for the luminosity or 5–11 for the 2-10 keV X-ray luminosity.
The observed power-law photon index and the Eddington ratio are consistent with the relation for AGNs (Brightman et al., 2013). The hardening of the spectrum along with the decrease of the bolometric luminosity between the 2009 to 2014 observations, if true, is also consistent with the above relation.
The X-ray to optical/UV ratio, , is defined as
| (3) |
where and are the monochromatic luminosities at 2 keV and 2500 Å in the rest frame, respectively. With erg s-1 Hz-1 and erg s-1 Hz-1 for the 2014 XMM-Newton observation, we derive , which is consistent with the derived from the relation of Just et al. (2007).
The Fe ii strength of the QSO, defined as the ratio of the equivalent width for the optical Fe ii 4570 blend and the broad H (), is . The FWHM of the broad H is 6447 km s-1. The measured log[EW (Å)] is about 0.8. These properties are not typical for SDSS quasars (Shen & Ho, 2014) on the eigenvector 1 plane (Boroson & Green, 1992), although the QSO presents a typical luminosity among the SDSS DR7 quasars (Shen et al., 2011). Quasars similar to PHL 6625 that have a small and a low equivalent width of [O iii] 5007 compose only 3.4% of the SDSS DR7 quasars with a small , regardless of [O iii] 5007 strength, but the physical explanation is not clear.
To conclude, this system gives us a case where a luminous quasar is associated with a minor merger in the close pair phase, although there is no conclusive evidence to show a link between the quasar activity and the merger event. High-resolution and high-sensitivity observations with a large sample of nearby quasars may address the question whether the case like PHL 6625 is rare or ubiquitous, and whether quasar activity can be triggered by minor mergers.
References
- Bennert et al. (2008) Bennert, N., Canalizo, G., Jungwiert, B., et al. 2008, ApJ, 677, 846-857
- Bentz et al. (2013) Bentz, M. C., Denney, K. D., Grier, C. J., et al. 2013, ApJ, 767, 149
- Binney & Merrifield (1998) Binney, J., & Merrifield, M. 1998, Galactic astronomy (Princeton: Princeton Univ. Press)
- Boroson & Green (1992) Boroson, T. A., & Green, R. F. 1992, ApJS, 80, 109
- Brightman et al. (2013) Brightman, M., Silverman, J. D., Mainieri, V., et al. 2013, MNRAS, 433, 2485
- Bruzual & Charlot (2003) Bruzual, G., & Charlot, S. 2003, MNRAS, 344, 1000
- Calzetti (2001) Calzetti, D. 2001, PASP, 113, 1449
- Chabrier (2003) Chabrier, G. 2003, PASP, 115, 763
- Cid Fernandes et al. (2005) Cid Fernandes, R., Mateus, A., Sodré, L., Stasińska, G., & Gomes, J. M. 2005, MNRAS, 358, 363
- Combes et al. (2009) Combes, F., Baker, A. J., Schinnerer, E., et al. 2009, A&A, 503, 73
- Delahaye & Pinsonneault (2006) Delahaye, F., & Pinsonneault, M. H. 2006, ApJ, 649, 529
- de Vaucouleurs et al. (1991) de Vaucouleurs, G., de Vaucouleurs, A., Corwin, H. G., Jr., et al. 1991, Third Reference Catalogue of Bright Galaxies. Volume I: Explanations and references. Volume II: Data for galaxies between 0h and 12h. Volume III: Data for galaxies between 12h and 24h.
- Ellison et al. (2008) Ellison, S. L., Patton, D. R., Simard, L., & McConnachie, A. W. 2008, AJ, 135, 1877
- Ellison et al. (2011) Ellison, S. L., Patton, D. R., Mendel, J. T., & Scudder, J. M. 2011, MNRAS, 418, 2043
- Elvis et al. (1997) Elvis, M., Fiore, F., Giommi, P., & Padovani, P. 1997, MNRAS, 291, L49
- Faber & Gallagher (1979) Faber, S. M., & Gallagher, J. S. 1979, ARA&A, 17, 135
- Feng et al. (2014) Feng, H., Shen, Y., & Li, H. 2014, ApJ, 794, 77
- Gieren et al. (2009) Gieren, W., Pietrzyński, G., Soszyński, I., et al. 2009, ApJ, 700, 1141
- Hernquist (1989) Hernquist, L. 1989, Nature, 340, 687
- Ho & Kim (2015) Ho, L. C., & Kim, M. 2015, ApJ, 809, 123
- Hopkins et al. (2006) Hopkins, P. F., Hernquist, L., Cox, T. J., et al. 2006, ApJS, 163, 1
- Hopkins et al. (2007) Hopkins, P. F., Richards, G. T., & Hernquist, L. 2007, ApJ, 654, 731
- Hopkins & Hernquist (2009) Hopkins, P. F., & Hernquist, L. 2009, ApJ, 694, 599
- Jin et al. (2011) Jin, J., Feng, H., Kaaret, P., & Zhang, S.-N. 2011, ApJ, 737, 87
- Just et al. (2007) Just, D. W., Brandt, W. N., Shemmer, O., et al. 2007, ApJ, 665, 1004
- Kalberla et al. (2005) Kalberla, P. M. W., Burton, W. B., Hartmann, D., et al. 2005, A&A, 440, 775
- Karachentsev et al. (2013) Karachentsev, I. D., Makarov, D. I., & Kaisina, E. I. 2013, AJ, 145, 101
- Kartaltepe et al. (2010) Kartaltepe, J. S., Sanders, D. B., Le Floc’h, E., et al. 2010, ApJ, 721, 98
- Kennicutt (1998) Kennicutt, R. C., Jr. 1998, ARA&A, 36, 189
- Kennicutt et al. (1994) Kennicutt, R. C., Jr., Tamblyn, P., & Congdon, C. E. 1994, ApJ, 435, 22
- Kewley & Ellison (2008) Kewley, L. J., & Ellison, S. L. 2008, ApJ, 681, 1183-1204
- Krist (1995) Krist, J. 1995, Astronomical Data Analysis Software and Systems IV, 77, 349
- Kormendy & Ho (2013) Kormendy, J., & Ho, L. C. 2013, ARA&A, 51, 511
- Liu et al. (2012) Liu, X., Shen, Y., & Strauss, M. A. 2012, ApJ, 745, 94
- Maraston (2005) Maraston, C. 2005, MNRAS, 362, 799
- Margon et al. (1985) Margon, B., Downes, R. A., & Chanan, G. A. 1985, ApJS, 59, 23
- Madau et al. (1998) Madau, P., Pozzetti, L., & Dickinson, M. 1998, ApJ, 498, 106
- Osterbrock (1989) Osterbrock, D. E. 1989, Research supported by the University of California, John Simon Guggenheim Memorial Foundation, University of Minnesota, et al. Mill Valley, CA, University Science Books, 1989, 422 p.,
- Peng et al. (2002) Peng, C. Y., Ho, L. C., Impey, C. D., & Rix, H.-W. 2002, AJ, 124, 266
- Peng et al. (2010) Peng, C. Y., Ho, L. C., Impey, C. D., & Rix, H.-W. 2010, AJ, 139, 2097
- Peterson et al. (2004) Peterson, B. M., Ferrarese, L., Gilbert, K. M., et al. 2004, ApJ, 613, 682
- Romano et al. (2008) Romano, R., Mayya, Y. D., & Vorobyov, E. I. 2008, AJ, 136, 1259
- Salpeter (1955) Salpeter, E. E. 1955, ApJ, 121, 161
- Salviander et al. (2007) Salviander, S., Shields, G. A., Gebhardt, K., & Bonning, E. W. 2007, ApJ, 662, 131
- Sanders & Mirabel (1996) Sanders, D. B., & Mirabel, I. F. 1996, ARA&A, 34, 749
- Sanders et al. (1988) Sanders, D. B., Soifer, B. T., Elias, J. H., et al. 1988, ApJ, 325, 74
- Shen et al. (2011) Shen, Y., Richards, G. T., Strauss, M. A., et al. 2011, ApJS, 194, 45
- Shen et al. (2008) Shen, Y., Greene, J. E., Strauss, M. A., Richards, G. T., & Schneider, D. P. 2008, ApJ, 680, 169
- Shen (2013) Shen, Y. 2013, Bulletin of the Astronomical Society of India, 41, 61
- Shen & Ho (2014) Shen, Y., & Ho, L. C. 2014, Nature, 513, 210
- Shull et al. (2012) Shull, J. M., Smith, B. D., & Danforth, C. W. 2012, ApJ, 759, 23
- Silverman et al. (2011) Silverman, J. D., Kampczyk, P., Jahnke, K., et al. 2011, ApJ, 743, 2
- Taniguchi (1999) Taniguchi, Y. 1999, ApJ, 524, 65
- Taniguchi (2013) Taniguchi, Y. 2013, Galaxy Mergers in an Evolving Universe, 477, 265
- Tadhunter et al. (2014) Tadhunter, C., Dicken, D., Morganti, R., et al. 2014, MNRAS, 445, L51
- Tao et al. (2012) Tao, L., Feng, H., Kaaret, P., Grisé, F., & Jin, J. 2012, ApJ, 758, 85
- Vestergaard & Peterson (2006) Vestergaard, M., & Peterson, B. M. 2006, ApJ, 641, 689
- Wang et al. (2009) Wang, J.-G., Dong, X.-B., Wang, T.-G., et al. 2009, ApJ, 707, 1334
- Whitaker et al. (2012) Whitaker, K. E., van Dokkum, P. G., Brammer, G., & Franx, M. 2012, ApJ, 754, L29
- Wilms et al. (2000) Wilms, J., Allen, A., & McCray, R. 2000, ApJ, 542, 914
- Wright et al. (2010) Wright, E. L., Eisenhardt, P. R. M., Mainzer, A. K., et al. 2010, AJ, 140, 1868-1881
- Yao et al. (2012) Yao, Y., Shull, J. M., Wang, Q. D., & Cash, W. 2012, ApJ, 746, 166
- Zaritsky et al. (1994) Zaritsky, D., Kennicutt, R. C., Jr., & Huchra, J. P. 1994, ApJ, 420, 87