Luminous and Variable Stars in M31 and M33 V. The Upper HR Diagram
Abstract
We present HR Diagrams for the massive star populations in M31 and M33 including several different types of emission-line stars: the confirmed Luminous Blue Variables (LBVs), candidate LBVs, B[e] supergiants and the warm hypergiants. We estimate their apparent temperatures and luminosities for comparison with their respective massive star populations and to evaluate the possible relationships of these different classes of evolved, massive stars, and their evolutionary state. Several of the LBV candidates lie near the LBV/S Dor instability strip which supports their classification. Most of the B[e] supergiants, however, are less luminous than the LBVs. Many are very dusty with the infrared flux contributing one-third or more to their total flux. They are also relatively isolated from other luminous OB stars. Overall, their spatial distribution suggests a more evolved state. Some may be post-RSGs like the warm hypergiants, and there may be more than one path to becoming a B[e] star. There are sufficient differences in the spectra, luminosities, spatial distribution, and the presence or lack of dust between the LBVs and B[e] supergiants to conclude that one group does not evolve into the other.
1 Introduction – The Complex Upper HR Diagram
The upper HR Diagram is populated with some of the most interesting and challenging stars with respect to their physics, evolution and eventual fate. Massive stars are distinguished by their relatively short lifetimes, mass loss and their eventual fate as supernovae, neutron stars and black holes. In addition to stellar winds and mass loss, many of them show evidence for periods of enhanced mass loss, such as the Luminous Blues Variables (LBVs) and the warm and cool hypergiants with resolved ejecta. In addition, Wolf-Rayet stars of various types, Oe and Of stars, the B[e] supergiants, and the Fe II emission line stars occupy the same parts of the HR Diagram. Supernovae surveys have identified numerous non-terminal giant eruptions, in which the object greatly increases its total luminosity possibly expelling several solar masses. Some of these events are confused with true SNe and thus have been called “supernova impostors” (Van Dyk, 2005; Van Dyk and Matheson, 2012). Very little is known about their progenitors, although several have been identified with likely massive stars. The nature of their instability is unknown, but proximity to the Eddington Limit may be crucial. The pre-eruption stars very likely have like LBVs (Humphreys et al., 2016), but there is no proof that they are indeed classical LBVs/S Doradus variables. Most of the other categories mentioned above may have lower , but rotation can magnify its effective value in B[e] stars, for example.
Thus we observe a complex upper HR diagram with several types of stars not only experiencing continuous mass loss, but also high mass loss events. Some of these classes of stars may be related to each other and may represent stars of similar mass but in different stages in their evolution as they shed mass. Complicating our understanding are recent results suggesting that the most massive stars may not actually end their lives as supernovae. Smartt (2009, 2015) has suggested an upper mass limit of 18 M for the red supergiant progenitors of the Type II SNe, while Jennings et al.(2014) find a lack of massive progenitors in M31 and M33 and suggest an upper mass limit of 35-45 M for the Type II SNe.
An improved census of the upper HR Diagram , including the most luminous evolved stars, the LBVs, the hot emission line stars, and the warm and cool hypergiants is needed for a more complete picture of the pre-terminal stages of very massive stars.
In this series of papers we have described the results of a spectroscopic survey of luminous and variable stars in the nearby spirals M31 and M33. In Paper I (Humphreys et al., 2013a) we discussed a small group of very luminous intermediate temperature supergiants, the warm hypergiants, and showed that they were likely post-red supergiants. In Paper II (Humphreys et al., 2014b), we reviewed the spectral characteristics, spectral energy distributions (SEDS), circumstellar ejecta, and mass loss for 82 luminous and variable stars including the confirmed LBVs, candidate LBVs, and other emission line stars. Many of these stars have circumstellar dust including several of the Fe II emission line stars, but found that the confirmed LBVs in M31 and M33 do not. The confirmed LBVs also have relatively low wind speeds even in their hot, quiescent or visual minimum state compared to the B-type supergiants and Of/WN stars which they spectroscopically resemble.
Gordon et al. (2016) (Paper III) presented a more comprehensive spectroscopic survey of the yellow supergiants. Based on spectroscopic evidence for mass loss and the presence of circumstellar dust in their SEDs, we conclude that of the yellow supergiants are likely in a post-red supergiant state. Comparison with evolutionary tracks shows that these mass-losing, post-RSGs have initial masses between 20 to 40 M⊙ suggesting that red supergiants in this mass range evolve back to warmer temperatures before their terminal state.
In Paper IV (Humphreys et al., 2017), we reported spectroscopy of 132 additional luminous stars and emission line objects including LBVs and candidates, the B[e] supergiants, and the warm hypergiants. Many of these stars are spectroscopically similar and are often confused with each other. We discussed their similarities and differences and proposed guidelines that can be used to help distinguish them in future work.
In this final paper we present the upper HR Diagrams for M31 and M33 based on this work and that of Massey (2016). We determine the luminosities of the emission line stars from Papers II and IV to place them on the HR Diagram for comparison with their respective massive star populations and a discussion of their possible evolutionary state. In the next section we briefly describe the observations used for what we call the representative supergiant or massive star populations, the corrections for interstellar extinction, and their luminosities. In §3, we discuss the SEDs, circumstellar dust, interstellar extinction and the derivation of the luminosities and temperature estimates for the different types of emission line stars. In §4 we present the HR diagrams and compare the distribution of the emission line objects with the massive star populations in M31 and M33. In the final section we discuss the implications for their evolutionary states.
2 The Observational Data for the Supergiant Populations
We use the large data set published by Massey et al. (2016), together with our own spectral classifications from Papers II, III and IV, to create a catalog of luminous O,B and A type stars representative of the hot star populations in M31 and M33. We are careful to avoid duplication, and only stars with spectral types are used. The WR stars are not included. All foreground stars and those labeled “H II” or “double” are omitted.
In our previous work we have found that the interstellar extinction can vary considerably across the face of these galaxies, especially in M31. Since many of these stars are also in nebulous and dusty regions, we determine the extinction for each star individually instead of assuming a mean extinction for the host galaxy. We use its spectral type and corresponding intrinsic color together with the multi-color photometry from Massey et al. (2006) and the standard extinction curve from Cardelli et al. (1989) with . However, several stars in each galaxy have negative derived Av’s. All except one are described as isolated (I) by Massey et al. (2016). We therefore assume that the anomalous Av values are due to photometric error or unresolved blends and replace them with our mean values, 0.62 0.02 mag for M31 and 0.33 0.01 mag for M33, determined from the other stars. The mean Av for M33 is similar to the value adopted by Massey et al. (2016), but our mean for M31 is significantly higher than theirs.
We also identified 13 stars with high Av values ( 2 mag). High extinction in star forming regions in M31 and M33 is not necessarily erroneous. However most of these cases yielded physically implausible luminosities i.e. too high in Mv and MBol. Eight were classed as extremely crowded (X) by Massey et al. (2016). We checked all 13 stars and confirm that these 8 were blended, unresolved images, or embedded in nebulosity. The remaining 5 were listed as isolated (I) meaning that their spectra and photometry are not contaminated by nearby stars or nebulosity. Their high extinction values are confirmed from neighboring stars and also from the neutral hydrogen density (see §3). Three have derived luminosities appropriate to their spectral types and are included in our catalog. The other two have luminosities 107 Lsun which if correct imply initial masses above 250 M⊙. These two stars are of special interest, deserve more attention, and are discussed in the Appendix.
The absolute visual magnitudes are then derived from distance moduli, 24.4 mag for M31 (Riess et al., 2012) and 24.5 mag for M33 (Scowcroft et al., 2009). The corresponding effective temperatures and bolometric corrections are adopted from Martins et al. (2005) for the O-type stars and Flower (1996) for the B and A-type supergiants. There are also numerous A-type supergiants in Table 4 in our Paper III. For those stars, some of which have mass loss and circumstellar dust, we use our classifications and derived luminosities from that paper.
For the evolved yellow supergiants (YSGs) with F and G-type spectra and the red supergiants (RSGs) we use the stars from Figures 10 and 11 in our Paper III. Many of these stars show an infrared excess in their SEDs. This contribution to their luminosities from circumstellar dust is included in their bolometric luminosities by integrating their SEDs.
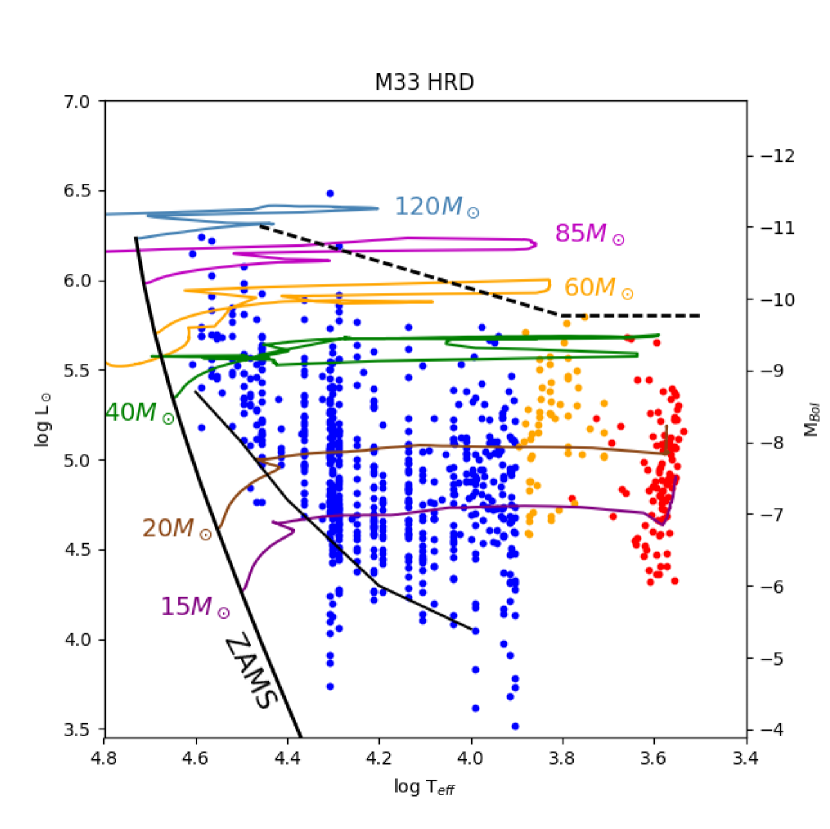
Table 1 is a summary of the total number of stars of different spectral types used in our HR Diagrams for M31 and M33. These spectral type groups are not intended to be complete. They are used in this paper to represent the massive star populations in their respective galaxies. The resulting HR Diagrams are shown in Figures 1 and 2. Although M31 and M33 have somewhat higher and lower metallicities, respectively, than the Milky Way, we chose to use the evolutionary tracks from Ekstrom et al. (2012) for solar metallicity, because they cover a wide range of masses and include tracks with and without rotation. In this paper they are used to provide an estimate of the likely mass range for some of the stars discussed later. In the next section, we discuss the luminosities and apparent temperatures of the emission line stars for placement on the HR Diagrams for comparison with the representative massive star populations shown here and with the evolutionary models.

3 LBVs and Other Emission Line Stars
Our population of emission line stars are from Tables 5 and 6 in Paper IV and our list of candidate LBVs in Table 7 based on the guidelines described in that paper. To place these stars with strong emission lines on the HR Diagram we must determine their intrinsic luminosities and estimate their surface temperatures. Their photometry and SEDs must first be corrected for interstellar extinction. This is an uncertain procedure for stars with strong emission lines because their broad-band colors in the blue-visual region cannot be safely used. Furthermore the lack of absorption lines, especially in the spectra of the B[e]sgs and Fe II emission line stars (Paper IV), prevents accurate spectral classification and adoption of the corresponding temperatures, and bolometric corrections. Spectra of all of the stars discussed in this paper and the previous papers in this series are available at http://etacar.umn.edu/LuminousStars/M31M33.
We follow the procedure described in Paper II. We first estimate the visual extinction, Av, from two independent methods, the Q-method for nearby OB-type stars, typically within 2 arcsec, based on their observed colors from Massey et al. (2006), and the well-known relation between neutral hydrogen column density (N) and the color excess EB-V (Knapp et al., 1973; Savage & Jenkins, 1972). We define Av from N as the foreground reddening (A 0.3 mag for M31 and 0.26 mag for M33) plus 1/2 Av from the N111We adopt half the extinction value because we do not know the exact locations of the stars along the line of sight with respect to the neutral hydrogen.. The results are summarized in Tables 2 and 3. We prefer the extinction estimates from neighboring stars when available because of their proximity to the target stars, compared to the H I surveys which have spatial resolutions of 30 for M31 (Braun et al., 2009) and 17 for M33 (Gratier et al., 2010). The number of nearby stars used is given in parenthesis. The tables also include the adopted Av and the corresponding extinction-corrected absolute visual magnitudes, Mv. We also re-examined the extinction estimates for the stars in Paper II and they are included here. Differences in the parameters for the confirmed LBVs in Paper II and Humphreys et al. (2016) are due to minor adjustments in the adopted extinction.
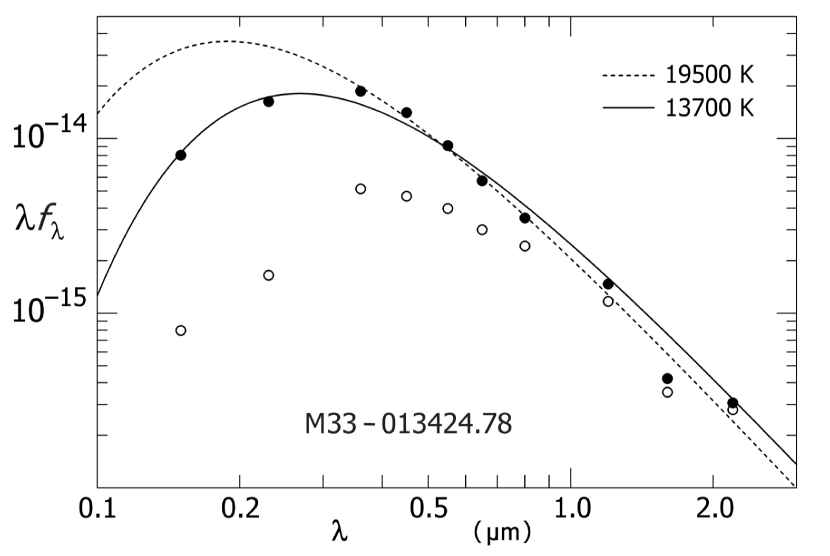
To estimate their intrinsic luminosities and their surface temperatures, we integrate their extinction-corrected SEDs. Many of these stars are also relatively hot. So to avoid understimating their total luminosity, the NUV and FUV fluxes, when available, from the UIT survey (Massey et al., 1996) and the GALEX Nearby Galaxy Survey were included in the SEDs. The cross identification of our M33 stars with GALEX was aided by the catalog of UV sources in M33 by Mudd & Stanek (2015). We used Galex View to identify UV counterparts for the M31 stars. For some stars though, no UV counterpart was identified. We adopt the LMC average extinction curve from Gordon et al. (2003) for the NUV and FUV fluxes. To illustrate the UV contribution to the total flux and how it constrains the Planck curve fit, we show the SED for M33-013424.78 in Figure 3 with and without the UV flux. A simple Planck curve is fit to the SEDs to estimate the surface temperature. We use the Planck curve instead of trying to fit a model atmosphere, because the spectra of many of the stars are dominated by strong emission lines with a poorly defined continuum. More elaborate modeling is beyond the scope of this paper. A strong H line can contribute significantly to the R-band photometry as can be seen in some of the SEDs. In those cases the R band photometry is not included in the fit. The Planck fit to the SED is then integrated from 0.15m to 0.8m to determine the bolometric luminosities in the UV/blue-visual wavelength region.
The primary source of uncertainty with this procedure is the adopted extinction correction which directly affects the derived temperatures and luminosities in the visual. The range in the Av values from the nearby stars is typically 0.2 mag. To estimate the expected uncertainty in the final adopted luminosities and temperatures, we use the range in the Av values from the nearby stars for two different stars, one with a high luminosity and temperature (M33C-16364, 31000°K, -9.4 MBol) and one of lower temperature and luminosity (M33C-2976, 17000°K, -7.2 MBol). Varying the Av value by 0.2 mag for each gave a range in temperature of about 16% and 50% in luminosity for the hotter star, and 5% and 20% in temperature and luminosity, respectively for the fainter star. These results will of course vary from star to star, but they give an indication of what uncertainties to expect for the stars’ positions on the HR Diagrams.
3.1 Circumstellar Dust
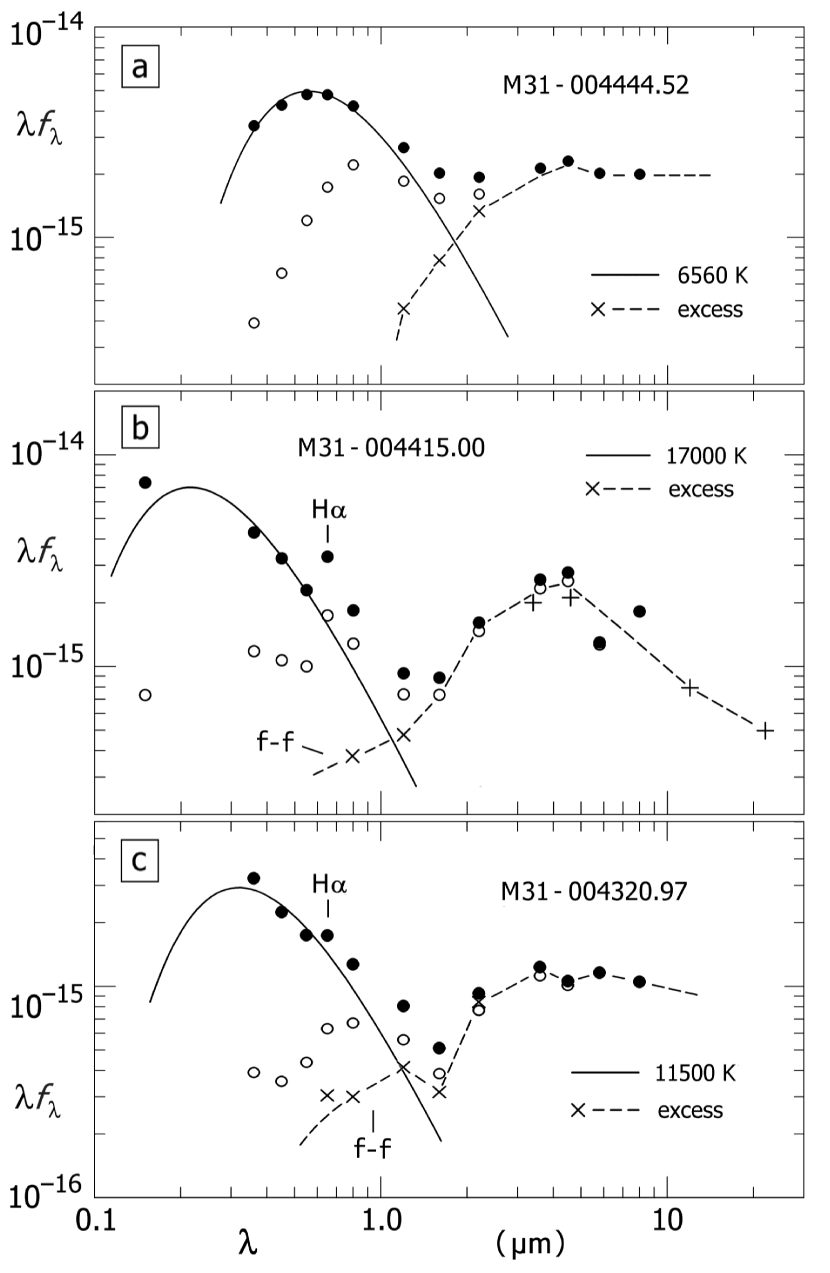
The warm hypergiants and most of the B[e]sgs have significant excess radiation longwards of 1m due to dust. The contribution to their total luminosities from their flux readiated by dust can be determined by integrating under a curve fit to the long wavelength data.
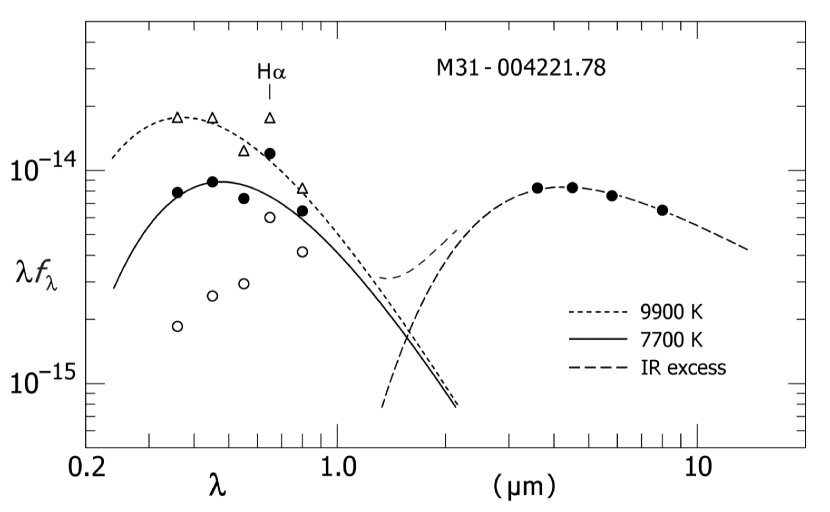
Figure 4 shows three examples, the warm hypergiant, M31-004444.52 and two B[e] supergiants, M31-004415.00 and M31-004320.97. Despite the differences in the stars’ apparent surface temperatures, the infrared flux is about one third or more of the total flux of the star. Many of the B[e]sgs are remarkable for a large infrared emission relative to the star, which may be on the order of one-half the star’s total flux or more. The infrared flux in M31-004221.78, shown in Figure 5, is equal to the visual luminosity222In this case and some others, there is no data in the wavelength range 1–3 m where the total SED normally has a local minimum. We use simple dust models to assess their integrated fluxes. A range of dust temperatures probably occurs for each object. We assume: 1) grain emissivity is , (2) the mass of dust with temperatures in range is a power-law for , and (3) K. We estimate the power-law index by a least-squares fit to the observed IR values of . This approach provides accuracies of the order of 15% for the total flux integrated from 1 to 10 or 22 m.. In this figure we also show an estimate of the effect of the circumstellar extinction on the star’s visual SED and our estimate of its temperature. Of course we may have underestimated the star’s interstellar extinction, and its IR flux is doubtful beyond 10 m, but the main point is that the star is nearly enshrouded in dust. More examples can be seen in Figures 10a and 10b in Paper II.
The fraction of the total luminosity emitted in the infrared is summarized in Table 4 for the 18 B[e] supergiants. Two of the B[e]sgs in Table 3, however, show no evidence for dust out to 20m. Although our sample is small, there is some correlation with the presence of circumstellar dust and the luminosity of the star. The 9 stars with little or no dust have an average luminosity of 4.3 105 L⊙ compared with 1.2 105 L⊙ for the B[e]sgs with dust contributing 25% or more of the total luminosity of the star.
3.2 The Spatial Distribution
When checking the emission line stars discussed in this paper for nearby OB stars for the visual extinction estimates, we noticed that the B[e] supergiants were relatively isolated compared with other emission-line stars, the LBVs and LBV candidates. Humphreys et al. (2016) showed that the confirmed LBVs in M31 and M33 were found primarily in stellar groups. We have added information about the stars’ spatial identification with stellar groups such as known H II regions and Associations to Tables 2 and 3. In addition to their luminosities and temperatures, and the presence of circumstellar dust, the stars’ spatial distribution and association with other stellar groups will also be relevant to understanding their evolutionary state.
4 The HR Diagrams
The HRDs for the M31 and M33 supergiant populations (Figures 1 and 2) have similar distributions. Both show a well-defined upper luminosity boundary or Humphreys-Davidson limit, noted in much earlier studies, which is also clearly visible in Massey’s (2016) HR Diagrams. There is a lack of luminous O-type stars near the main sequence above the survey magnitude limit, shown as a thin dark line on the HR Diagrams. This is most likely due to a combination of observational selection since they are more often in crowded regions and associated with nebulosity and the shift of their energy dsitributions to shorter wavelengths and fainter visual magnitudes.
Figures 6 and 7 show the LBVs, candidate LBVs, the B[e] supergiants and the warm hypergiants on their respective HR Diagrams using the temperatures and derived luminosities in Tables 2 and 3. For comparison, they are over-plotted on the HRDs for the supergiant populations which are shown as a faint background. The confirmed LBVs are plotted in their quiescent or hot state, and those that have had a recent “LBV eruption” or maximum light stage are illustrated with a dashed line. In their quiescent state the LBVs lie along the S Doradus or LBV instability strip (Wolf, 1989; Humphreys & Davidson, 1994) also outlined in these Figures. Although the candidate LBVs have a wide range of temperatures and luminosities, several lie on or near the instability strip which adds support to their classification as possible candidates.
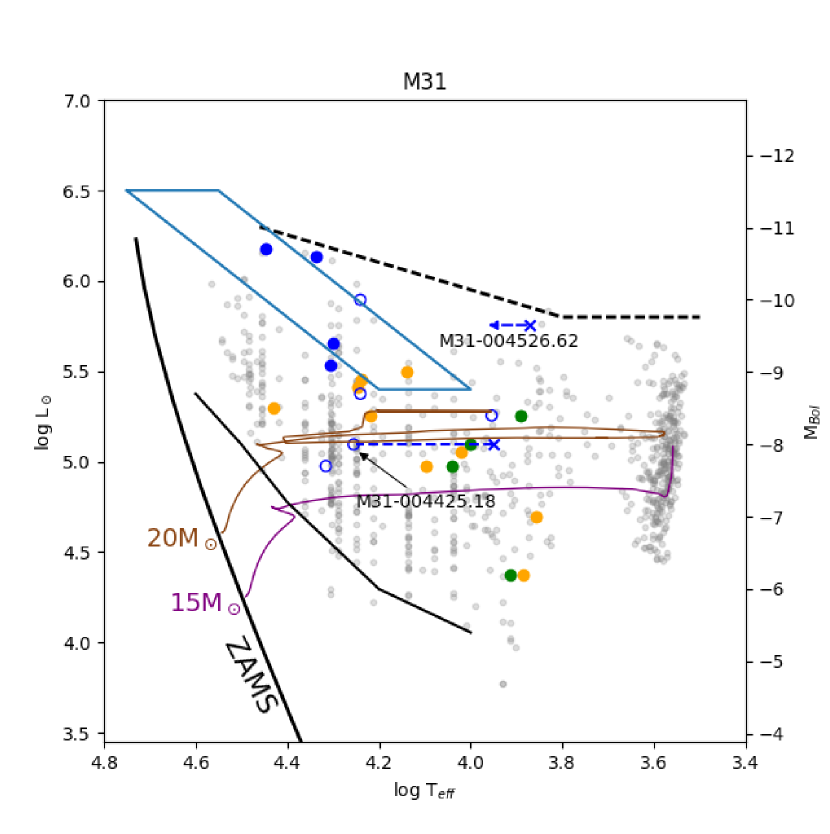
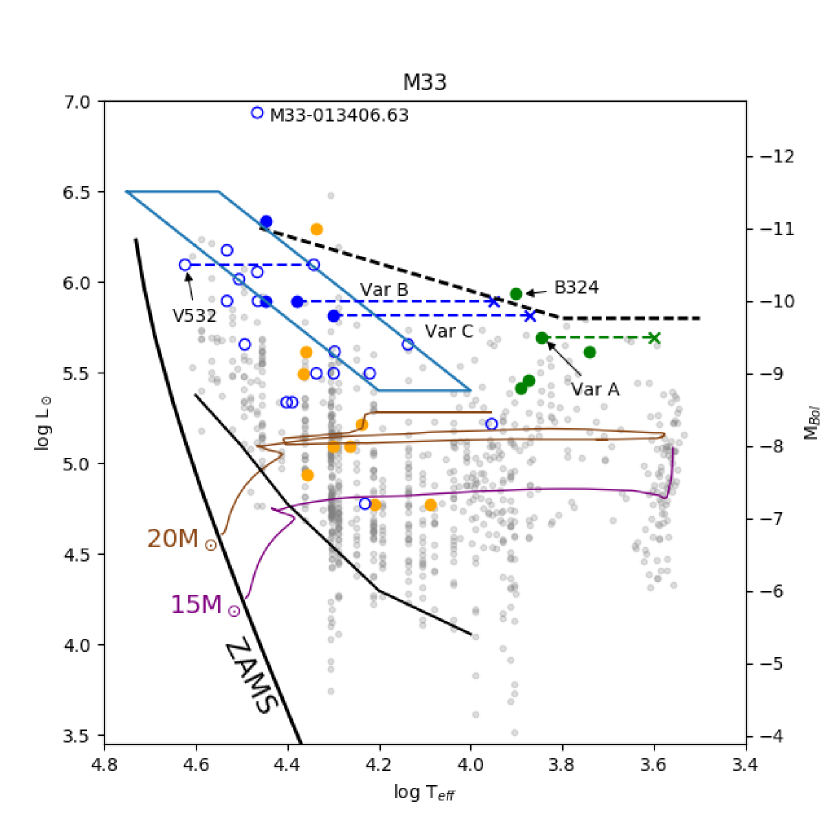
These HR Diagrams illustrate an important point: many normal supergiants are found in the LBV instability strip. Normal mass losing supergiants can evolve through the instability strip to lower temperatures. LBVs are distinguished from the normal supergiants that occupy the same locus in the luminosity-temperature space by their proximity to the Eddington limit. They have high L/M ratios, and their Eddington factor is high, 0.5 or higher due to high mass loss events as hot supergiants for stars with initial masses 40 – 50 M⊙ or as red supergiants for the less luminous LBVs; see Figure 1 and the discussions in Humphreys et al. (2016) and Davidson et al. (2016).
In contrast, most of the B[e]sgs in our sample are less luminous than the LBVs and LBV candidates. Except for one (M33C-15731), they are all below the upper luminosity boundary for evolved massive stars, and although they have a range in temperatures, their luminosities also place most of them below the LBV instability strip; three in M31 and two in M33 are near the lower bound of the instability strip. There are no very hot stars and the coolest members overlap with the warm hypergiants on the HRDs. Published HR Diagrams for the Magellanic Cloud B[e]sgs (Oksala et al., 2013) also show the majority below the upper luminosity boundary for the intermediate temperature supergiants.
The warm hypergiants include the 7 stars described in Paper I plus two additional stars M31-004621.08 (Paper III) and J013358.05+304539.9 (Kourniotis et al., 2017). We have argued that with their spectroscopic evidence for high mass loss and extensive circumstellar gas and dust, they are candidates for post main sequence evolution. The one likely exception is B324 in M33 which we suggest may be evolving to cooler temperatures. Indeed it may be near the end of its redward evolution based on its position on the HR Diagram. Some of the warm hypergiants also spectroscopically resemble the B[e] supergiants. For example, the strong Ca II triplet and [Ca II] doublet in emission are also present in some of the B[e]sgs, and the spectra of two hypergiants, M31-0004522.52 and M31-004621.08 also have [Fe II] and [O I] emission (Figure 4 in Paper IV), the distinguishing spectroscopic characteristic of the B[e]sg class. Thus the B[e]sgs may be the hotter counterparts of some of the warm hypergiants, especially the lower luminosity ones in M31.
5 Concluding Remarks — LBVs and B[e] Supergiants
Numerous authors have suggested possible connections between LBVs and the B[e]sgs based primarily on their spectroscopic similarities, see Zickgraf (2006) and references therein. In paper IV, we discussed their spectroscopic signatures and proposed guidelines for separating the two classes. The B[e]sgs have forbidden lines of [O I] not observed in LBVs, and in many cases Ca II and [Ca II] emission is also present in their spectra, but not in LBVs. Equally significant, and a clear distinction between the two, is the presence of warm dust in most of the B[e]sgs but not in LBVs. Based on their positions on the HRDs, most of the B[e]sgs appear to originate from a lower initial mass population, 15 – 40 M⊙ (15 – 30 M⊙ for tracks with rotation) compared to the LBVs, most of which are 40 M⊙.
The standard model for the B[e] supergiants is an evolved fast-rotating hot supergiant with a two -component wind – a fast low density polar wind and slow dense wind in the equatorial zone (Zickgraf et al., 1985, 1986) with an equatorial disk or ring. The asymmetric mass loss leads to the formation of the high density disk. The extensive dusty region forms in the outerparts of the extended disk protected from the UV radiation from the relatively hot star. Note, however, that many of the B[e] supergiants not only have dusty ejecta but a significant fraction of their luminosity is radiated in the infrared (Table 4). In more than half of the cases with circumstellar dust, the infrared flux accounts for 25% or more of the total flux from the star, and as we noted in §3.1, the less luminous B[e]sgs have a larger fraction of their total luminosity due to re-radiation by dust. Although this dusty circumstellar material is often described as a “disk” or even a “ring” (de Wit et al., 2014), with this much dust that nearly obscures the star in some cases, perhaps “torus” is a better description for these objects. Kastner et al. (2010) also noted the large fraction of the luminosity in the infrared and suggested that the equatorial ejecta was a “puffed up” or flared disk.
There have long been questions about the variability of the B[e] supergiants and if they are variable, if it is due to variation in the equatorial torus. Martin & Humphreys (2017) have monitored these and other emission line stars in M31 and M33, imaging them annually for the past four years with the intention of detecting long-term variability of 0.1 magnitude or greater in BVRI. They find that only one of the 18 stars discussed here is definitely variable, and one other may be variable. Both have a low dust contribution to their luminosities, and none of the very dusty stars showed any significant variability. This implies that the variability is driven by changes in the photosphere or material close to the star, not associated with the dusty material at larger radii.
Although it is generally agreed that the B[e]sgs are post-main sequence stars, their evolutionary state is debated with some argung for a post-RSG or post-yellow/warm supergiant stage (Kastner et al., 2010; Aret et al., 2012) and others for a pre-RSG state (Oksala et al., 2013; de Wit et al., 2014). Oksala et al. (2013) concluded that the C12/C13 ratios measured from the CO bandheads in ten B[e]sgs in the Clouds and the Milky Way are consistent with a pre-RSG stage. Only three stars had the low ratios (5 -14) (Milam et al., 2009) expected for oxygen-rich evolved RSGs and post-RSG or YSG stars.
If the B[e] supergiants are in a pre-red supergiant stage, then, based on their positions on the the HR Diagram, we would expect to find them associated with the B-type supergiants of similar temperatures. The B[e]sgs in our M31 and M33 sample are relatively isolated from nearby OB stars compared to the LBVs and candidates, see §3.1 and Table 3, and most are not found in the stellar associations. This difference is most noticeable for the M31 stars. In M33, star forming regions of young stars are found across its face, so there is a greater possibility of a chance association. Indeed the B[e]sg distribution is similar to what we found for RSGs in Paper III. Sixty percent of the RSGs lacked nearby OB stars. Fifty percent of the B[e]sgs lack nearby stars and 50% are not found in or near a stellar grouping. Becker et al. (2017) report that none of the ten B[e]sgs in the LMC from Oksala’s list have nearby OB stars within the same search radius of 11 pc. We find that only three have nearby B-type supergiants which is similar to the M31 and M33 sample.
Overall, their spatial distribution supports a more evolved state for most of the B[e]sgs. But this apparently contradicts the conclusions from the C12/C13 ratios. The more luminous B[e]sgs, such as M33C-15731 and those in the Magellanic Clouds above the upper luminosity boundary, log L/L⊙ 5.8, however, have not been red supergiants, and must have some other origin for their B[e] characteristics. In our study, the more luminous are also those with the least dust. Furthermore, no measurable CO bandhead emission was detected in those with luminosities below 105 L⊙ (Oksala et al., 2013), and the three B[e]sgs with the lower C12/C13 ratios tend to have the lower luminosities. Since the lower luminosity B[e]sgs are also the dustiest with a higher fraction of their luminosities in the infrared, these would be the more likely candidates for post-RSG evolution. Thus the observations, which appear to be contradictory, may equally suggest that there is more than one path to become a B[e] supergiant, based on the spectroscopic criteria.
If some of the B[e] supergiants are post-RSGs, then what distinguishes them from the “less luminous” LBVs that are also likely post-RSG stars? Humphreys et al. (2016) emphasized that the instability of the LBVs was probably due to their proximity to the Eddington limit for their intial mass; they have an Eddington factor of 0.5 or higher, see Humphreys & Davidson (1994). For the less luminous LBVs, this is attributed to mass loss as a red supergiant. The same may be true for the B[e]sgs. Indeed, their Eddington factor would be enhanced by rapid rotation. Binarity could be a factor; de Wit et al. (2014) suggested that some of the Galactic B[e] stars are short-period binaries with circumbinary disks. This does not necessarily mean that LBVs are binaries. Their instability is most likely a surface phenomenon, while in the B[e]sgs, the proximity of a companion to a rapidly rotating star may generate the mass loss in the equatorial region without the LBV eruption. We also note that many of the B[e] supergiants lie below the LBV instability strip which suggests that the B[e]sg stage may be a more common end state for lower mass supergiants, 15 - 20 M⊙.
In summary, the LBVs and B[e]sgs are not related in an evolutionary sense. There are sufficient differences in their spectra, their luminosities, spatial distribution and the presence or lack of circumstellar dust, to conclude that one group does not evolve into the other. We support the conclusions in our previous papers (Humphreys & Davidson, 1994; Humphreys et al., 2013a, 2016) that the “less luminous” LBVs and the warm hypergiants are post-RSGs. Here we suggest that some of the B[e] supergiants may also be examples of post-red supergiant evolution.
Appendix A Two Exceptionally Luminous O-type Supergiants in M31
Two of the supergiants in M31 with very high extinction values, 3 mag, are classed as isolated (I) by Massey et al. (2016) which means that their spectra and photometry are not contaminated by unresolved nearby stars. It does not mean that they are physically isolated from other luminous stars. We checked their positions and confirm that neither of these stars is blended with nearby stars. Their extinction values derived from their observed colors however lead to luminosities 107 L⊙.
J004246.85+413336.4 (O3-O5 If) has an Mv of -9.8 mag and MBol of -13.5 mag (107.3 L⊙) with its Av of 3.17 mag. It is in a small group of what are apparently hot stars based on their colors. Although it is not in a designated association, it is in a prominent H II region (Azimlu et al., 2011) and a dust cloud, D392, cataloged by Hodge (1981), which of course accounts for the high local interstellar extinction. The mean visual extinction from four nearby stars is 3.0 mag and from the neutral hydrogen density it is 1.8 mag with a possible maximum value of 3.1 mag, see §3. Thus the high extinction is confirmed from nearby stars and from the star’s location in a dust cloud.
J004158.87+405316.7 (O9.5 I) is isolated with only one nearby star. Like the prevous star, it is not in a known association, but is on the edge of a cataloged dust cloud, D222 (Hodge, 1981), and there is no associated nebulosity. Its observed photometry yields an Mv of -9.2 and MBol of -12.0 mag (106.7 L⊙) with Av of 3.25 mag placing it way above the hot supergiants of comparable spectral types on the HR Diagram. The only nearby star has a lower Av of 1.8 mag and derived colors appropriate to an early B-type supergiant. The difference in the extinction values may be due to a gradient in the dust near the edge of the cloud. The extinction from the NHI density is 0.9 mag with a maximum of 1.5 mag similar to the nearby star.
Neither star is on archived “HST mages”, so it is not possible to check for possible blending with unresolved nearby stars. We suspect that both stars are most likely more than one star unresolved at their distance, perhaps similar to J013406.63+304147.8 (UIT 301, B416) in M33, Paper II, although Crowther et al. (2010) has identified WN-type stars with luminosities of 106.5 to 106.9 L⊙ in R136a in the LMC. These two stars in M31 however are relatively isolated by comparison with R136a. Both deserve closer scrutiny with higher resolution spectra and imaging.
References
- Aret et al. (2012) Aret, A., Kraus, M., Muratore, M. F. & Ferna ndes, M. B. 2012, MNRAS, 423,284
- Azimlu et al. (2011) Azimlu, M., Marciniak, R., & Barmby, P. 2011, AJ, 142, 139
- Becker et al. (2017) Becker, A., Bomans, D. J., et al, 2017, in preparation
- Braun et al. (2009) Braun, R., Thilker, D. A., Walterbos, R. A. M. & Corbelli, E, 2009, ApJ, 695, 937
- Cardelli et al. (1989) Cardelli, J. A., Clayton, G. C., & Mathis, J. S. 1989, ApJ, 345, 245
- Crowther et al. (2010) Crowther, P. A. et al. 2010, MNRAS, 408, 731,
- Davidson et al. (2016) Davidson, K., Humphreys, R.M, & Weis, K. 2016, arXiv:1608.02007(v2)
- de Wit et al. (2014) de Wit, W. J., Oudmaijer, R. D. & Vink, J. S. 2014, Advances in Astronomy, 2014, id.270848
- Flower (1996) Flower, P. J. 1996, ApJ, 469, 355
- Ekstrom et al. (2012) Ekstrom, S. et al. 2012, A&A, 537, A146
- Gordon et al. (2003) Gordon, K. D., Clayton, Geoffrey C., Misselt, K. A., Landolt, A. U. & Wolff, M. J. 2003, ApJ, 594, 279
- Gordon et al. (2016) Gordon, M. S., Humphreys, R. M. & Jones, T . J. 2016, ApJ, 825, 50 (Paper III)
- Gratier et al. (2010) Gratier, P. et al., 2010, A&A, 522A, 3G
- Hodge (1981) Hodge, P. W., Atlas of the Andromeda Galaxy, 1981, University of Washington Press, (Seattle and London)
- Humphreys & Sandage (1980) Humphreys, R. M & Sandage, A. 1980, ApJS, 44, 319
- Humphreys et al. (1987) Humphreys, R. M., Jones, T. J. & Gehrz, R. D. 1987, AJ, 94, 315
- Humphreys & Davidson (1994) Humphreys. R. M. and Davidson, K. 1994, PASP, 106, 1025
- Humphreys et al. (2006) Humphreys, R. M., Jones, T. J., Polomski, E., et al. 2006, ApJ, 131, 2105
- Humphreys et al. (2013a) Humphreys. R. M., Davidson, K, Grammer, S., Kneeland, N., Martin, J. C., Weis, K. & Burggraf, B. 2013a, ApJ, 773, 46 (Paper I)
- Humphreys et al. (2014a) Humphreys, R. M., Davidson, K., Gordon, M. Weis, K. Burggraf, B., Bomans, D. J. & Martin, J. C. 2014a, ApJ, 782L, 21H
- Humphreys et al. (2014b) Humphreys, R. M.,Weis, K.,Davidson, K ., Bomans, D. J., & Burggraf, B. 2014b, ApJ, 790, 48 (Paper II)
- Humphreys et al. (2015) Humphreys, R. M., Martin, J. C., & Gordon, M. S., 2015, PASP, 127, 347
- Humphreys et al. (2016) Humphreys, R. M.., Weis, K., Davidson, K., & Gordon, M. S. 2016, ApJ, 825, 64
- Humphreys et al. (2017) Humphreys, R. M.., Gordon, M. S., Martin, J. C., Weis, K., & Hahn, D. 2017, ApJ, 836, 1 (Paper IV)
- Jennings et al. (2014) Jennings, Z. G., Williams, B. F., Murphy, J. W., et al. 2014, ApJ., 795, 170
- Kastner et al. (2010) Kastner, J. H., Buchanan, C., Sahai, R., Forrest, W. J., & Sargent, B. A. 2010, AJ, 139, 1993
- Knapp et al. (1973) Knapp, G. R., Kerr, F. J. & Rose, W. K. 1973, ApJ, 14, 187
- Kourniotis et al. (2017) Kourniotis, M, Bonanos, A. Z., Yuan, W. M., Macri,L. M., Garcia-Alvarez, D. & Lee, C.-H. 2017, A&A, 601, 76
- Martin & Humphreys (2017) Martin, J. C. & Humphreys, R. M. 2017, submitted to AJ
- Martins et al. (2005) Martins, F., Schaerer, D. & Hillier, D. J. 2005, A&A, 436, 1049
- Massey et al. (1996) Massey, P., Bianchi, L., Hutchings, J. B., & Stecher, T. P. 1996, ApJ, 469, 629
- Massey et al. (2006) Massey, P., Olsen, K. A. G., Hodge, P. W. et al. 2006a, AJ, 131, 2478
- Massey et al. (2016) Massey, P., Neugent, K. F., & Smart, B. M. 2016 AJ, 152, 62
- Milam et al. (2009) Milam, S. N., Woolf, N. J. & Ziurys, L. M. 2009, ApJ, 690, 837
- Mudd & Stanek (2015) Mudd, D. & Stanek, K. Z. 2015, MNRAS, 450, 3811
- Oksala et al. (2013) Oksala, M. E., Kraus, M., Cidale, L. S., Mu ratore, M. F., & Borges Fernandes, 2013, A&A, 558, A17
- Riess et al. (2012) Riess, A. G., Fliri, J., & Valls-Gabaud, D . 2012, ApJ, 745, 156
- Savage & Jenkins (1972) Savage, B. D. & Jenkins, E. B, 1972, ApJ, 174, 491
- Scowcroft et al. (2009) Scowcroft, V., Bersier, D., Mould, J. R ., & Wood, P. R. 2009, MNRAS, 396, 1287
- Smartt et al. (2009) Smartt, S. J., Eldridge, J. J., Crockett, R. M., & Maund, J. R. 2009, MNRAS, 395, 1409
- Smartt et al. (2015) Smartt,S. J.2015, PASA, 32, 16 et al. 1995, A&A, 314, 131
- Van Dyk (2005) Van Dyk, S. D. 2005, The Fate of the Most Massive Stars, ASP Conf. Ser 332, (ed. R. M. Humphreys & K. Z. Stanek, Astron. Soc. Pacific, San Francisco), 47
- Van Dyk and Matheson (2012) Van Dyk, S. D. and Matheson, T. 2012, in Eta Carinae and the Supernova Impostors, Astrophys. & Sp. Sci. Library 384 (ed. K. Davidson & R.M. Humphreys, Springer Media, New York), 249
- Valeev et al. (2010) Valeev, A. F., Sholukhova, O. N., & Fabrik a, S. N. 2010, Astrophysical Bull., 65, 140
- Wolf (1989) Wolf, B. 1989, A&A, 217, 87
- Zickgraf et al. (1985) Zickgraf, F.-J., Wolf, B., Stahl, O., Leitherer, C., & Klare, G. 1985, A&A, 143, 421
- Zickgraf et al. (1986) Zickgraf, F.-J., Wolf, B., Leitherer, C., Appenzeller, I., & Stahl, O. 1986, A&A, 163, 119
- Zickgraf (2006) Zickgraf, F.-J. Stars with the B[e] Phenomenon, ASP Conf. Ser 355, (ed. M Kraus & A. S. Miroshnichenko), 211
| Galaxy | OB stars | A-type supergiants | YSGs | RSGs | Total |
|---|---|---|---|---|---|
| M31 | 333 | 52 | 50 | 295 | 730 |
| M33 | 516 | 127 | 57 | 101 | 801 |
| Star | Av (stars) | Av (H I) | Adopted Av | Mv | T | MBol | Stellar GroupaaReferences: Hodge (1981), Humphreys & Sandage (1980) |
|---|---|---|---|---|---|---|---|
| (mag) | (mag) | (mag) | (mag) | K | (mag) | ||
| M31 | |||||||
| LBVs | |||||||
| AE And | 0.9(1) | 0.9 | 0.9 | -7.9: | 20000: | -9.4: | A170, H II |
| AF And | 1.1 | 1.1 | -8.2: | 28000: | -10.7: | ||
| Var A-1bbVar A-1 and Var 15 have both shown spectroscopic and photometric variability in the past few years (see Paper IV). Their SEDs are uncertain. | 1.4(1) | 1.9 | 1.4 | -8.7 | 21700 | -10.6: | A42 |
| Var 15bbVar A-1 and Var 15 have both shown spectroscopic and photometric variability in the past few years (see Paper IV). Their SEDs are uncertain. | 1.3 | 1.3 | -7.3: | 20200: | -9.1: | A38 | |
| M31-004526.62ccNew LBV in M31. See Humphreys et al. (2015). Its quiescent or minimum light state is uncertain. | 1.6(1) | 1.3 | 1.5 | -9.65 | A45, H II | ||
| LBV Candidates | |||||||
| M31-003910.85 | 1.0(3) | 1.0 | 1.0 | -7.2 | 17400 | -8.7 | A127 |
| M31-004051.59ddSee Papers III and IV, LBV candidate or post-RSG. The adopted Av is from the observed colors. Av from the nearby stars would yield Mv , MBol . | 1.7 | 1.6 | 0.6 | -8.1 | 9000 | -8.4 | A82 |
| M31-004411.35 | 2.3(1): | 0.8 | 2.3: | -8.6 | 17400 | -10 | A10 |
| M31-004425.18eeA probable low-luminosity LBV. See discussions in Papers II and IV. | 0.7 | 0.7 | 18000 | -8 | isolated(A9) | ||
| M31-004444.00 | 0.5(3) | 1.0 | 0.5 | -5.9 | 20700 | -7.7 | A54 |
| M33 | |||||||
| LBVs | |||||||
| Var B | 0.4 | 0.3 | 0.4 | -7.7 | 24000: | -10.0 | A142 |
| Var CffVar C is in eruption. See Humphreys et al. (2014a) | 0.5(2) | 0.4 | 0.5 | -8.6 | 20000: | -9.8 | H II |
| Var 83 | 0.8(2) | 0.9 | 0.8 | -8.8: | 28000: | -11.1: | A101,A103, H II |
| Var 2 | 0.9(1) | 1.0 | 0.9 | -7.2 | 28000: | -10.0: | A100 |
| LBV Candidates | |||||||
| M33C-2976 | 0.4(2) | 0.5 | 0.4 | -5.9 | 17000 | -7.2 | A124 |
| M33C-4174 | 0.8(3) | 0.9 | 0.8 | -7.3 | 19900 | -9.0 | A130 |
| UIT008ggUIT 008 (J013245.41+303858.3). See Papers II and IV. | 0.4(1) | 0.8 | 0.6 | -7.5 | 34000 | -10.7 | H II, A27 |
| M33C-14239 | 0.3(2) | 0.4 | 0.4 | -7.6 | 16600 | -9.0 | Spiral arm |
| M33C-4640hhM33C-4640 may be a post-RSG star, not an LBV candidate (Paper II), but it has weak Fe II emission. | 0.6(2) | 0.6 | 0.6 | -8.1 | 9000 | -8.3 | A128 |
| M33C-25255 | 0.7(3) | 0.6 | 0.6 | -6.3 | 24500 | -8.6 | A137 |
| M33-013317.22 | 0.7(2) | 0.5 | 0.7 | -6.5 | 29100 | -10.0 | A17 |
| M31-013334.06 | 0.6 | 0.6 | -7.6 | 19800 | -9.3 | ||
| M33C-7024 | 0.3(3) | 0.3 | 0.3 | -6.3 | 25200 | -8.6 | Spiral Arm |
| M33C-15235 | 1.1(4) | 0.8 | 1.0 | -7.8 | 29200 | -10.4 | A64 |
| M33C-5916 | 0.7 (1) | 0.6 | 0.7 | -6.9 | 34000 | -10.0 | A6 |
| M33-013406.63iiUIT 301, B416) This very lumninous hot supergiant is very likely more than one star as discussed in Paper II. It is listed as an LBV candidate because of the [Fe II] and Fe II emision in its spectrum. | 0.8(1) | 0.7 | 0.7: | -9.1: | 29200: | -12.6: | H II |
| M33C-21386 | 0.9(4) | 1.0 | 0.9 | -8.2 | A71 | ||
| M33C-10788 | 0.8(3) | 0.5 | 0.8 | -7.3 | 32000 | -10.3 | A100 |
| M33-013424.78 | 0.9 | 0.9 | -8.8 | 13700 | -9.4 | A102 | |
| M33C-20109 | 2.4(1): | 2.4: | -8.5 | ||||
| M33-013432.73 | 0.6(2) | 0.6 | 0.6 | -6.0 | 21700 | -9.0 | A84, N604 |
| M33C-16364 | 0.4(6) | 0.5 | 0.4 | -6.7 | 31100 | -9.4 | A88 |
| V532/GR290jjRomano’s star, see discussion in Paper II. | 0.6 | 0.6 | var | 42000-22000 | -10.4-10.7 | A89: |
| Star | Av (stars) | Av (H I) | Adopted Av | Mv | T | MBol | Stellar GroupaaReferences: Hodge (1981), Humphreys & Sandage (1980) |
|---|---|---|---|---|---|---|---|
| (mag) | (mag) | (mag) | (mag) | K | (mag) | ||
| M31 | |||||||
| B[e] supergiants | |||||||
| M31-004043.10*bb* – circumstellar dust | 1.5(1) | 0.8 | 1.0 | -6.8 | 16500 | -8.4 | A120 |
| M31-004057.03 | 0.7 | 0.7 | -6.3 | 7700: | -6.2: | ||
| M31-004220.31* | 1.1 | 1.1 | -6.6 | 12500 | -7.7 | ||
| M31-004221.78* | 0.95 | 1.0 | -5.8 | 7200: | -7.0 | ||
| M31-004229.87* | 1.4(2) | 2.1 | 1.4 | -7.0 | 17600 | -8.8 | |
| M31-004320.97* | 1.5 | 1.5 | -6.7 | 10500 | -7.9 | ||
| M31-004415.00* | 0.9 | 0.9 | -7.0 | 17300 | -8.9 | ||
| M31-004417.10* | 0.7(1) | 1.7 | 0.7 | -8.0 | 13800 | -9.0 | A32: |
| M31-004442.28* | 1.2(1) | 1.7 | 1.2 | -5.9 | 26900 | -8.6 | |
| Warm Hypergiants | |||||||
| M31-004322.50* | 1.5(1) | 1.1 | 1.5 | -5.6 | 8200 | -6.2 | Spiral Arm |
| M31-004444.52* | 1.5(3) | 1.3 | 1.5 | -7.8 | 6600 | -8.4 | A41 |
| M31-004522.58* | 1.2(1) | 1.1 | 1.2 | -7.1 | 11000 | -7.7 | A46 |
| M31-004621.08* | 1.2(1) | 0.3 | 1.2 | -7.6 | 10000 | -8.0 | A104: |
| M33 | |||||||
| B[e] supergiants | |||||||
| M33-013242.26 | 0.7(2) | 0.8 | 0.7 | -7.8 | 22900: | -9.3 | A118 |
| M33-013324.62* | 0.4 | 0.4 | -5.3 | 22800 | -7.6 | ||
| M33C-7256* | 0.5(3) | 0.3 | 0.5 | -5.6 | 18400 | -8.0 | A14 |
| M33C-6448 | 0.5(2) | 0.8 | 0.5 | -6.9 | 17300 | -8.3 | A9 |
| M33C-24812* | 0.7 | 0.7 | -6.2 | 20000 | -8.0 | A35 | |
| M33C-15731* | 1.2(2) | 0.7 | 1.2 | -8.9 | 21700 | -11.0: | A64(bulge) |
| M33-013426.11* | 0.6 | 0.6 | -6.1 | 12300 | -7.2 | ||
| M33-013459.47* | 0.7 | 0.7 | -6.8 | 23200 | -9.0 | ||
| M33-013500.30* | 0.3(3) | 0.7 | 0.3 | -5.5 | 16200 | -7.2 | A88 |
| Warm Hypergiants | |||||||
| Var AccVar A is optically obscured. See Humphreys et al. (1987, 2006) for a discussion of its light curve, spectrum and energy distribution.* | 0.6-0.9 | 1.0 | 7000: | -9.5 | A130 | ||
| B324ddB324 is possibly the visually most luminous star in M33. See Paper II for a discussion of its spectrum and SED. B324 is probably not a post-RSG, but more likely evolving to cooler temperatures. | 0.9(3) | 0.8 | 0.8 | -10.2 | 8000 | -10.1 | A67 |
| N093351eeN is the designator from the Valeev et al. (2010) survey used in Papers I and II. In Papers III and IV we used a V followed by the number.* | 0.45(2) | 0.8 | 0.45 | -8.8 | 7800 | -8.8 | A142 |
| N125093eeN is the designator from the Valeev et al. (2010) survey used in Papers I and II. In Papers III and IV we used a V followed by the number.* | 0.9(1) | 0.8 | 1.6 | -8.8 | 7500 | -8.9 | A105 |
| J013358.05+304539.9ffSee Kourniotis et al. (2017)* | 0.8(2) | 0.6 | 0.8 | -9.2 | 5000-6000 | -9.3: | A68 |
| Star | Visual L⊙ | Infrared L⊙ | Ratio (IR/Total |
|---|---|---|---|
| M31 | |||
| M31-004043.10 | 1.6 | 1.8 | 0.10 |
| M31-004057.08aaThe star is very faint. No 2MASS, IRAC or WISE photometry. | 1.8 | ||
| M31-004220.31 | 6.5 | 1.9 | 0.23 |
| M31-004221.78 | 2.2 | 2.8 | 0.55 |
| M31-004229.87 | 1.8 | 6.8 | 0.27 |
| M31-004320.97 | 6.7 | 5.0 | 0.43 |
| M31-004415.00 | 1.6 | 8.4 | 0.34 |
| M31-004417.10 | 3.0 | 1.4 | 0.04 |
| M31-004442.28 | 2.0 | 1.1 | 0.01 |
| M33 | |||
| M33-013242.26 | 4.0 | ||
| M33-013324.62 | 7.1 | 1.3 | 0.15 |
| M33C-6448 | 1.7 | ||
| M33C-7256 | 6.5 | 6.1 | 0.48 |
| M33C-24812 | 1.2 | 7.0 | 0.05 |
| M33C-15731 | 2.0 | 1.0 | 0.05 |
| M33-013426.11 | 4.3 | 1.5 | 0.26 |
| M33-013459.47 | 3.2 | 1.4 | 0.04 |
| M33-013500.30 | 4.0 | 1.9 | 0.32 |