Globular clusters vs dark matter haloes in strong lensing observations
Abstract
Small distortions in the images of Einstein rings or giant arcs offer the exciting prospect of detecting dark matter haloes or subhaloes of mass below M⊙, most of which are too small to have made a visible galaxy. A very large number of such haloes are predicted to exist in the cold dark matter model of cosmogony; in contrast other models, such as warm dark matter, predict no haloes below a mass of this order which depends on the properties of the warm dark matter particle. Attempting to detect these small perturbers could therefore discriminate between different kinds of dark matter particles, and even rule out the cold dark matter model altogether. Globular clusters in the lens galaxy also induce distortions in the image which could, in principle, contaminate the test. Here, we investigate the population of globular clusters in six early type galaxies in the Virgo cluster. We find that the number density of globular clusters of mass M⊙ is comparable to that of the dark matter perturbers (including subhaloes in the lens and haloes along the line-of-sight). We show that the very different degrees of mass concentration in globular clusters and dark matter haloes result in different lensing distortions. These are detectable with milli-arcsecond resolution imaging which can distinguish between globular cluster and dark matter halo signals.
1 Introduction
Perhaps the most fundamental prediction of cosmogonic models in which the dark matter consists of cold collisionless particles (CDM), such as the current cosmological paradigm, CDM, is the existence of a very large number of dark matter haloes with masses extending well below the masses of even the faintest galaxies known (for example, down to an Earth mass for a few GeV weakly interacting particle Green et al. (2005))(Diemand et al., 2007; Springel et al., 2008; Frenk & White, 2012). This property distinguishes CDM models from models in which the dark matter is a warm particle (WDM), such a sterile neutrino (Boyarsky et al., 2009). In this case, particle free streaming in the early universe induces a low-mass cutoff in the power spectrum of density perturbations. As a result, few dark matter haloes of mass less than about M⊙ (depending on the particle properties, (see Lovell et al., 2016; Bose et al., 2016)) ever form. Searching for haloes smaller than about M⊙ provides a clearcut way to distinguish between these dark matter candidates. Finding a dark matter halo of mass, say, M⊙ would rule out most WDM models of interest. Conversely, failing to find such haloes would conclusive rule CDM models, including CDM.
A major difficulty in applying this test is that the haloes of interest are too small ever to make a galaxy and are thus completely dark (see Sawala et al., 2016, and references therein). For this reason attempts to test CDM or distinguish it from WDM using the abundance of the more massive haloes that do make a galaxy are misguided: many studies dating back to semi-analytic models in the early 2000s (Bullock et al., 2000; Benson et al., 2002; Somerville, 2002) and, more recently, using hydrodynamic simulations (Okamoto & Frenk, 2009; Macciò et al., 2006; Sawala et al., 2016; Wetzel et al., 2016, e.g.) have clearly demonstrated that physically-based CDM models predict the correct number of faint galaxies, including satellites of the Milky Way. By contrast, the observed abundance of satellites can be used to rule out regions of the WDM parameter space Kennedy et al. (2014); Lovell et al. (2016).
A conclusive test of CDM and many other particle dark matter candidates requires counting dark, small-mass haloes. Fortunately these are detectable through gravitational lensing, specifically through the distortions they induce in strongly lensed systems that produce Einstein rings or giant arcs (Koopmans, 2005; Vegetti & Koopmans, 2009a, b; Vegetti et al., 2012; Hezaveh et al., 2016; Li et al., 2016). Until recently, it was thought that the distortions would come from substructures inside the lens. However, Li et al. (2017) have recently shown that the distortions in CDM and WDM models are dominated by intervening haloes projected onto the Einstein ring or strong lens rather than by subhaloes in the lens. This is a fortunate feature because it makes the test of particle candidates particularly clean: small-mass intervening haloes are not affected in any way by baryon effects, unlike subhaloes some of which can be destroyed by interaction with the central galaxy (Sawala et al., 2017; Garrison-Kimmel et al., 2017).
For the lensing test to be effective, it is essential to be able to detect haloes of small mass (Li et al., 2016). The detection limit of a particular observation depends on the resolution of the imaging data. High resolution imaging with the Hubble Space Telescope (HST) can reveal haloes down to at least M⊙ (Vegetti et al., 2010), while adaptive optics on the Keck telescope can reveal haloes down to M⊙ (Vegetti et al., 2012). Simulations show that even smaller haloes, down to M⊙, can be detected in radio-selected strong lenses (McKean et al., 2015).
Li et al. (2016) recently investigated the sample size and detection limit required to distinguish CDM from the particularly interesting WDM model in which the particles are 7 keV sterile neutrinos whose decay could explain the 3.5 keV X-ray line recently detected in galaxies and clusters (Boyarsky et al., 2014; Bulbul et al., 2014). In this case, the cutoff in the halo mass function occurs at a mass of M⊙ (Bose et al., 2016). With a detection limit of M⊙, lenses would suffice to distinguish even the coldest 7 kev sterile neutrino model allowed by the X-ray data from CDM. Li et al. (2016) also showed that the constraining power increases rapidly with improvements in the detection limit. If VLBI imaging could really reach a detection limit of M⊙, a handful of lens systems would already be enough conclusively to rule out all 7 keV sterile neutrinos, if a signal is found, or CDM if it is not.
A potential complication arises because dark matter haloes and subhaloes are not the only objects that can perturb an Einstein ring. Globular clusters in the lens galaxy could also be a source of perturbations. Studies of nearby galaxies show that the mass function of globular clusters has a Gaussian distribution peaking at about M⊙ (Jordán et al., 2007). In the Milky Way, the largest globular cluster is Centauri, which has a mass of M⊙ (D’Souza & Rix, 2013). The most massive globular clusters cannot generate lensing signals strong enough to be detected in optical lenses at HST imaging resolution, but they could be detect in radio lens systems with VLBI imaging resolution.
In this paper we estimate the number density of globular clusters near the Einstein radius of typical early type galaxies. Using a catalogue of globular clusters in the Virgo cluster (Peng et al., 2008; Jordán et al., 2009), we estimate the strong lensing distortions induced by globular clusters and compare them to the distortions induced by dark matter haloes of the same mass.
The paper is organized as follows. We provide a brief description of the globular cluster catalogue in Section 2. In Section 3 we calculate the number density of globular clusters in the Einstein ring region. In Section 4 we calculate the differences in the lensing effects of globular clusters and NFW haloes. We summarize our conclusions in Section 5
2 The globular cluster catalogue
To investigate the distortions induced by globular clusters in strong lensing systems we first estimate the total number of globular clusters expected in the lens galaxy using the catalogue of globular clusters around galaxies in the Virgo cluster compiled by Peng et al. (2008) and Jordán et al. (2009).
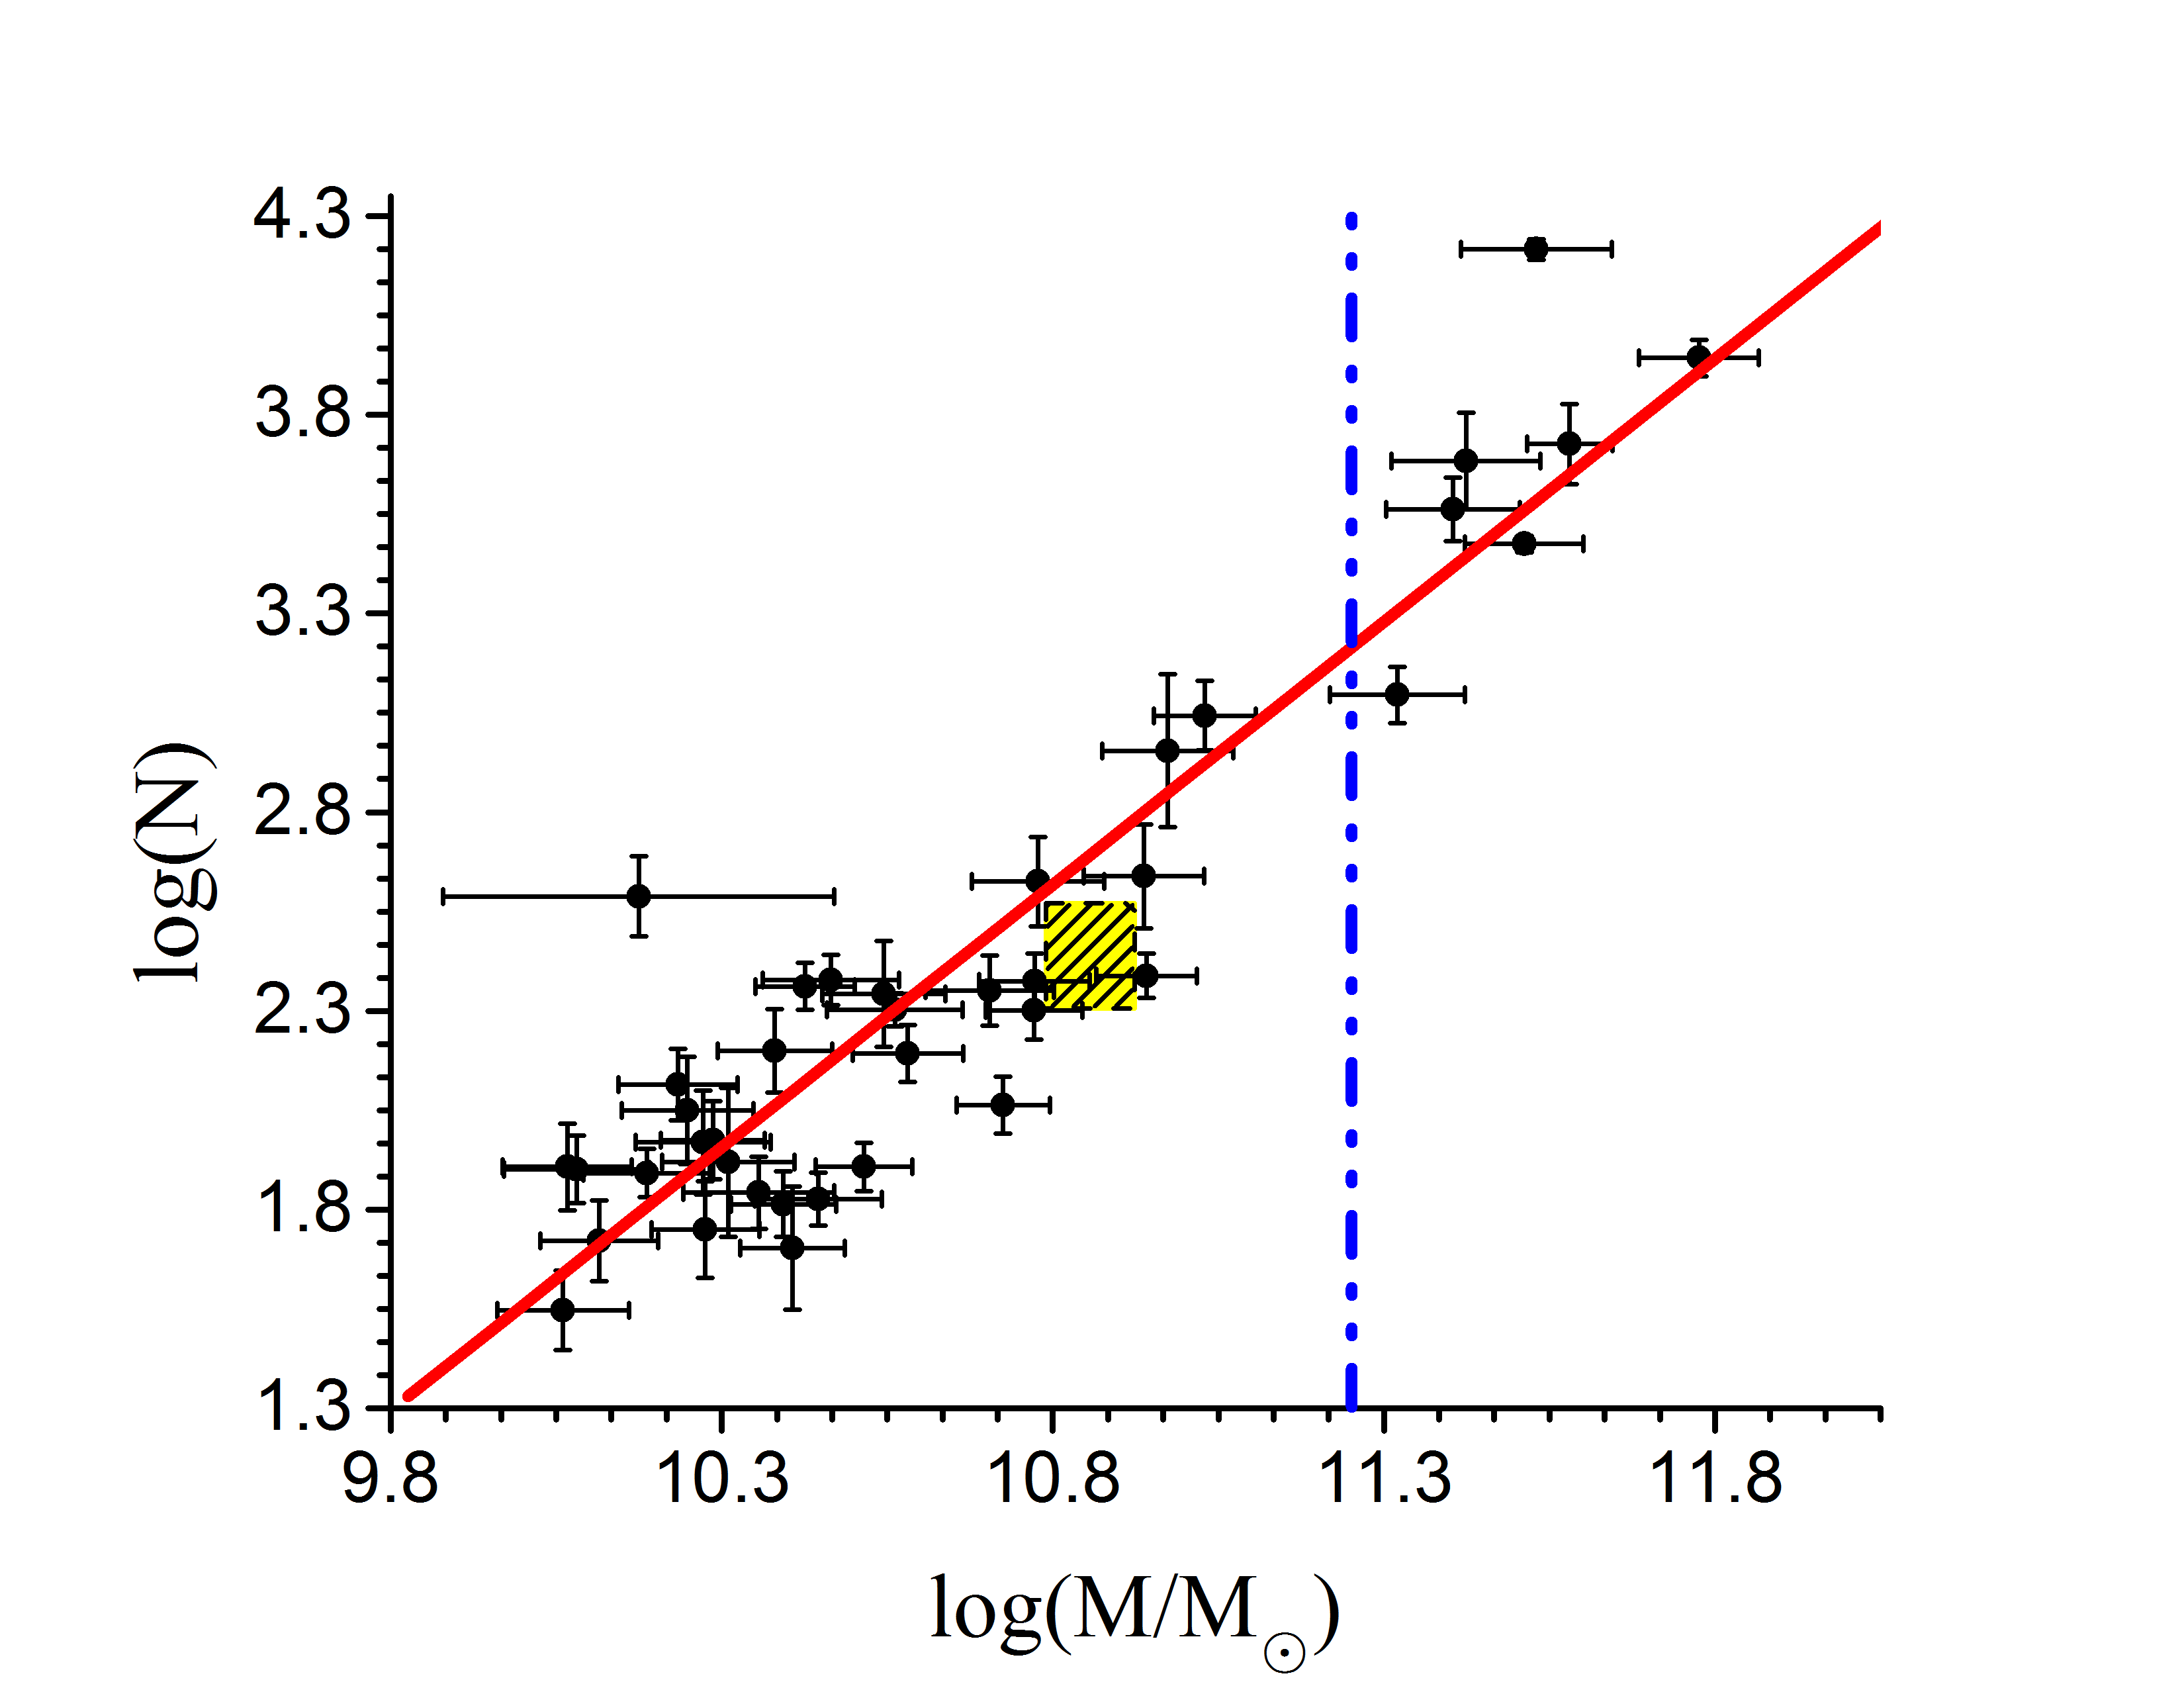
Fig.1 shows that the total number of globular clusters in this catalogue increases as a function of galaxy stellar mass. A typical lens galaxy in the SLACS sample (Bolton et al., 2008) has a stellar mass of a few M⊙. According to Fig. 1, these galaxies possess more than 5000 globular clusters each. The total number of globular clusters increases as , where is the stellar mass of the globular cluster. The number of globular clusters is known to be proportional to stellar mass, and may in fact be linear with total galaxy halo mass (Blakeslee et al., 1997; Peng et al., 2008; Hudson et al., 2014).
3 The number density of globular clusters
3.1 Projected number density profile
The projected number density of globular clusters as a function of projected radius, , is well described by a Sérsic (Sérsic, 1968) profile:
| (1) |
where
with three model parameters, and . In this paper,we use the best-fit model parameters for globular clusters in individual Virgo galaxies derived by Lim et al. (2017 in prep.)
3.2 Mass function
In the Einstein ring model only structures whose mass exceeds a certain threshold, , can be detected. If the globular cluster mass function is independent of distance from the centre of the galaxy, then the surface number density of globular clusters within the projected Einstein radius, , more massive than can be written as:
| (2) |
where is the normalized globular cluster mass function (GCMF), which may be inferred from the globular cluster luminosity function (GCLF) by assuming a (constant) mass-to-light ratio, . We choose widely used Gaussian GCLFs described by Jordán et al. (2007):
| (3) |
where is the absolute magnitude of a globular cluster, is the mean globular cluster magnitude, and the dispersion . The form of the GCMF may be written as,
| (4) |
where the mass and magnitude of a globular cluster are related by
| (5) |
and we have
| (6) |
and
| (7) | ||||
the constant, , is related to through
| (8) |
where is the absolute magnitude of the Sun.
3.3 Estimate for six massive galaxies in the Virgo cluster
Combining the mass function and number density profile we can estimate the number of globular clusters in a given mass range projected onto a specific annulus. We estimate the project number density of globular clusters in six massive galaxies in the globular cluster catalogue of the Virgo cluster. The stellar masses of these galaxies are comparable to those of the lens galaxies in the SLACS sample. We list the mass of these six galaxies in Table 1.
We use the values of and derived by Jordán et al. (2007) to calculate the GCLF of galaxies in the Virgo cluster in the -band. Jordán et al. (2007) showed that is nearly constant with a value of around 1.5 in this band, so we fix throughout this paper.
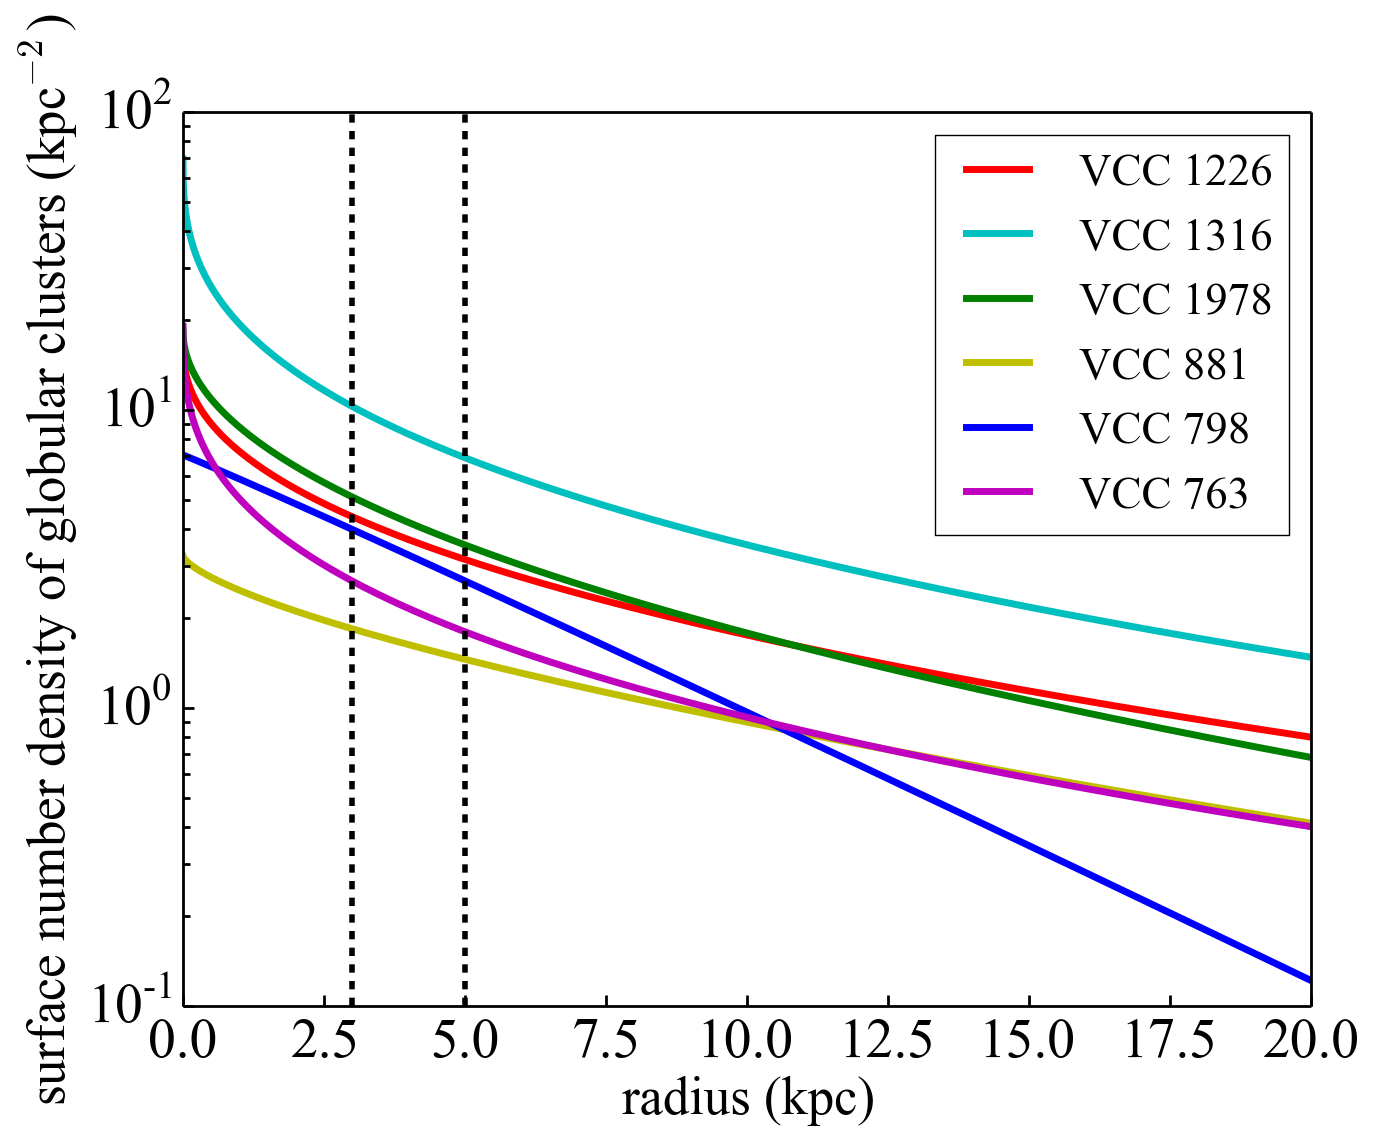
The surface number density profiles of globular clusters in these six galaxies are shown in Fig. 2. With the exception of VCC 798, all other five galaxies have globular cluster surface density profiles of similar form.
We calculate the number density of globular clusters in the annulus between 3 kpc and 5 kpc from the galaxy centre, which is about the Einstein radius of a typical lens in the SLACS survey. The lenses in this survey have a mean velocity dispersion of 275 km s-1 and a mean redshift of . The results are listed in Table 2.
Using CDM N-body simulations Xu et al. (2015) derived the surface number density of subhaloes in a CDM universe and found that it to about 1.5 arcsec-2 in the strong lensing region of a halo of M⊙. As mentioned in the Introduction, in a recent paper, Li et al. (2017) showed that the dominant contribution to perturbations in Einstein ring images comes from haloes along the line-of-sight rather than from subhaloes. The number of perturbing line-of-sight haloes can be 3 times larger than the number of subhaloes. From Table 2, the number density of globular clusters more massive than M⊙ is about to 9 , which is comparable to the total number density of dark matter haloes. The mass function of globular clusters drops sharply above M⊙ so, for perturber masses above M⊙, the contribution of globular clusters is negligible compared with that of dark CDM haloes. Thus, our previous conclusions regarding perturbers of mass M⊙ detectable with HST imaging remain unchanged. However, future observations of radio-selected lenses with VLBI high-resolution imaging will be strongly affected by the presence of globular clusters.
| Name | Stellar mass (M⊙) |
|---|---|
| VCC 1226/NGC 4472 | |
| VCC 1316/NGC 4486 | |
| VCC 1978/NGC 4649 | |
| VCC 881/NGC 4406 | |
| VCC 798/NGC 4382 | |
| VCC 763/NGC 4374 |
| Name | M⊙ | M⊙ | M⊙ |
|---|---|---|---|
| VCC 1226/NGC 4472 | |||
| VCC 1316/NGC 4486 | |||
| VCC 1978/NGC 4649 | |||
| VCC 881/NGC 4406 | |||
| VCC 798/NGC 4382 | |||
| VCC 763/NGC 4374 | |||
| the unit is |
4 The lensing effect of globular clusters
Dark matter haloes and globular clusters have very different density profiles and thus generate different lensing signals. In this section we compare the distortions induced on the strong lensing images by these two types of perturbers.
We assume that the main lens lies at and we model its density profile with a singular isothermal sphere (SIS) of velocity dispersion, s-1. A globular cluster or a dark matter subhalo is then placed at the Einstein radius. A source galaxy whose surface brightness profile is taken to be a Gaussian of dispersion, , is assumed to be located at redshift . Using a ray-tracing code we generate a lensed image on a plane of 80008000 pixels, each of size 0.7 milli-arcsecond.
We assume the dark matter subhalo follows a density profile given by the NFW formula (Navarro et al., 1996, 1997):
| (9) |
where and is the scale parameter. The concentration parameter, , is defined as
| (10) |
where is the radius within which the average interior density equals 200 times the critical density. We adopt the halo mass-concentration relation derived by Neto et al. (2007) from the Millennium simulation (Springel, 2005):
| (11) |
The density profile of the globular cluster is represented with a King model (King, 1966). Its density, , can be obtained by solving the following equations:
| (12a) | |||
| (12b) | |||
| (12c) | |||
| (12d) | |||
where is a scale parameter and and Eq. 12d are the initial conditions for Eq. 12a. The King model has three parameters: , and , the mass of the globular cluster.
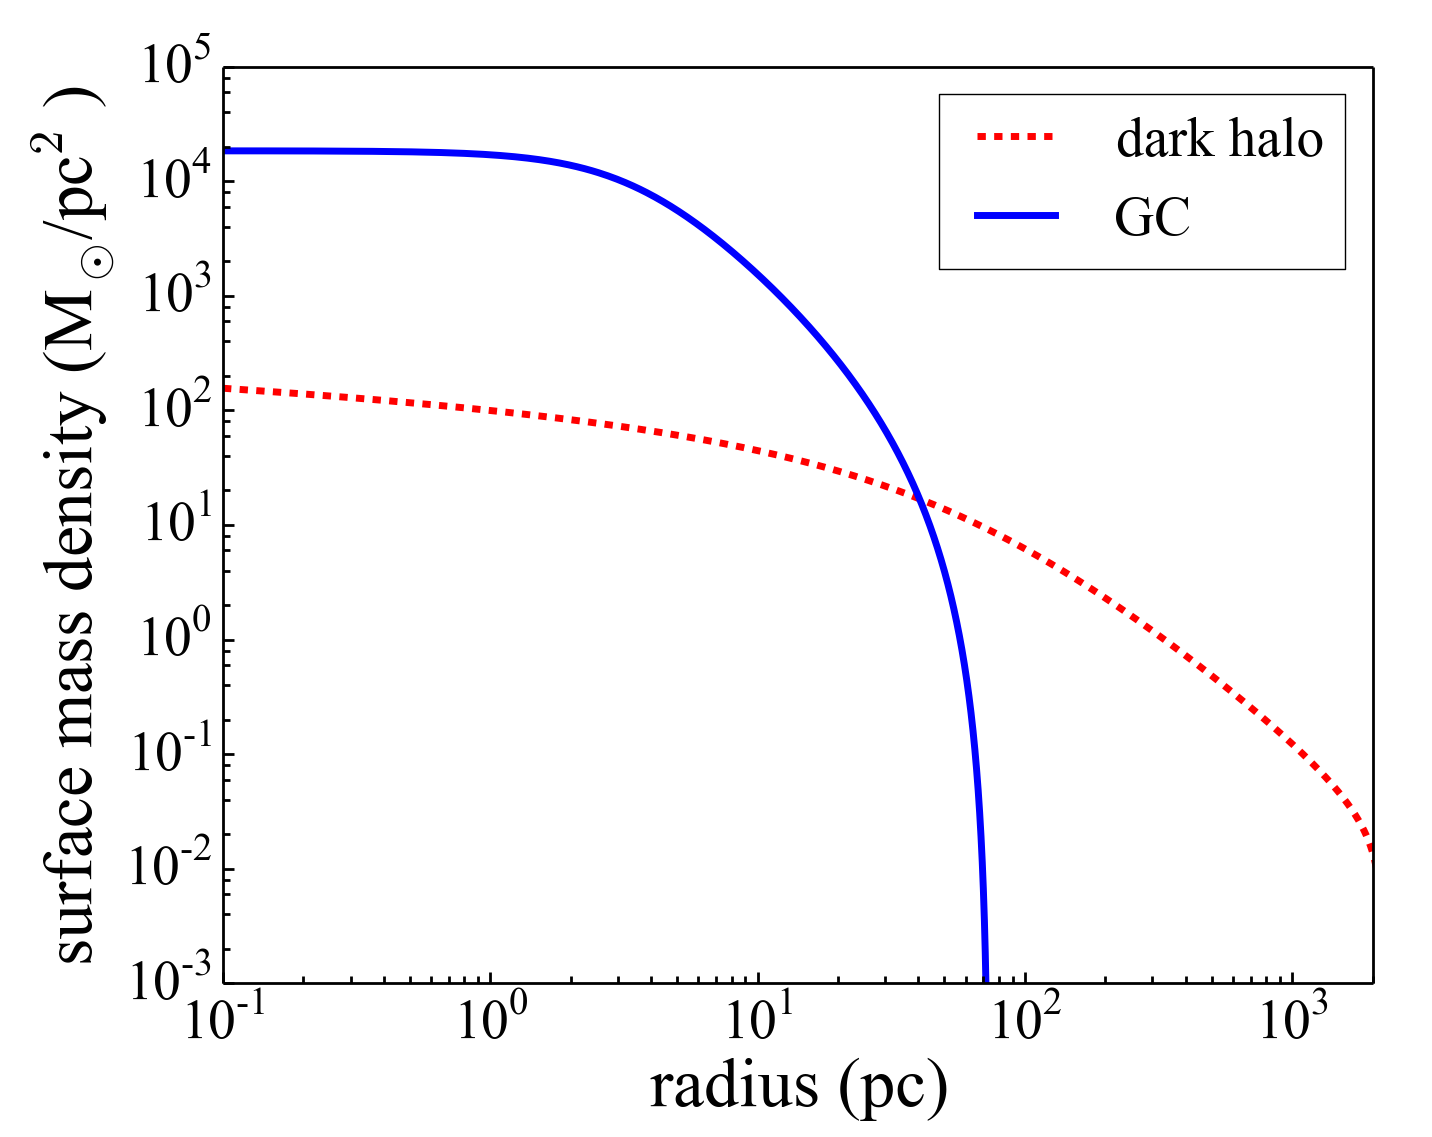
To compare the surface mass density profiles of our two kinds of perturbers, we consider the most massive globular cluster in the compilation of McLaughlin & van der Marel (2005), NGC 5139, whose King model parameters are M⊙, and M. In Fig. 3, we compare the surface density profile of NGC 5139 with the profile of a NFW halo of the same mass. It is clear that the globular cluster is much more concentrated than the NFW subhalo. The radius of the globular cluster is 72 pc, while the radius of the much more extended dark halo is pc.
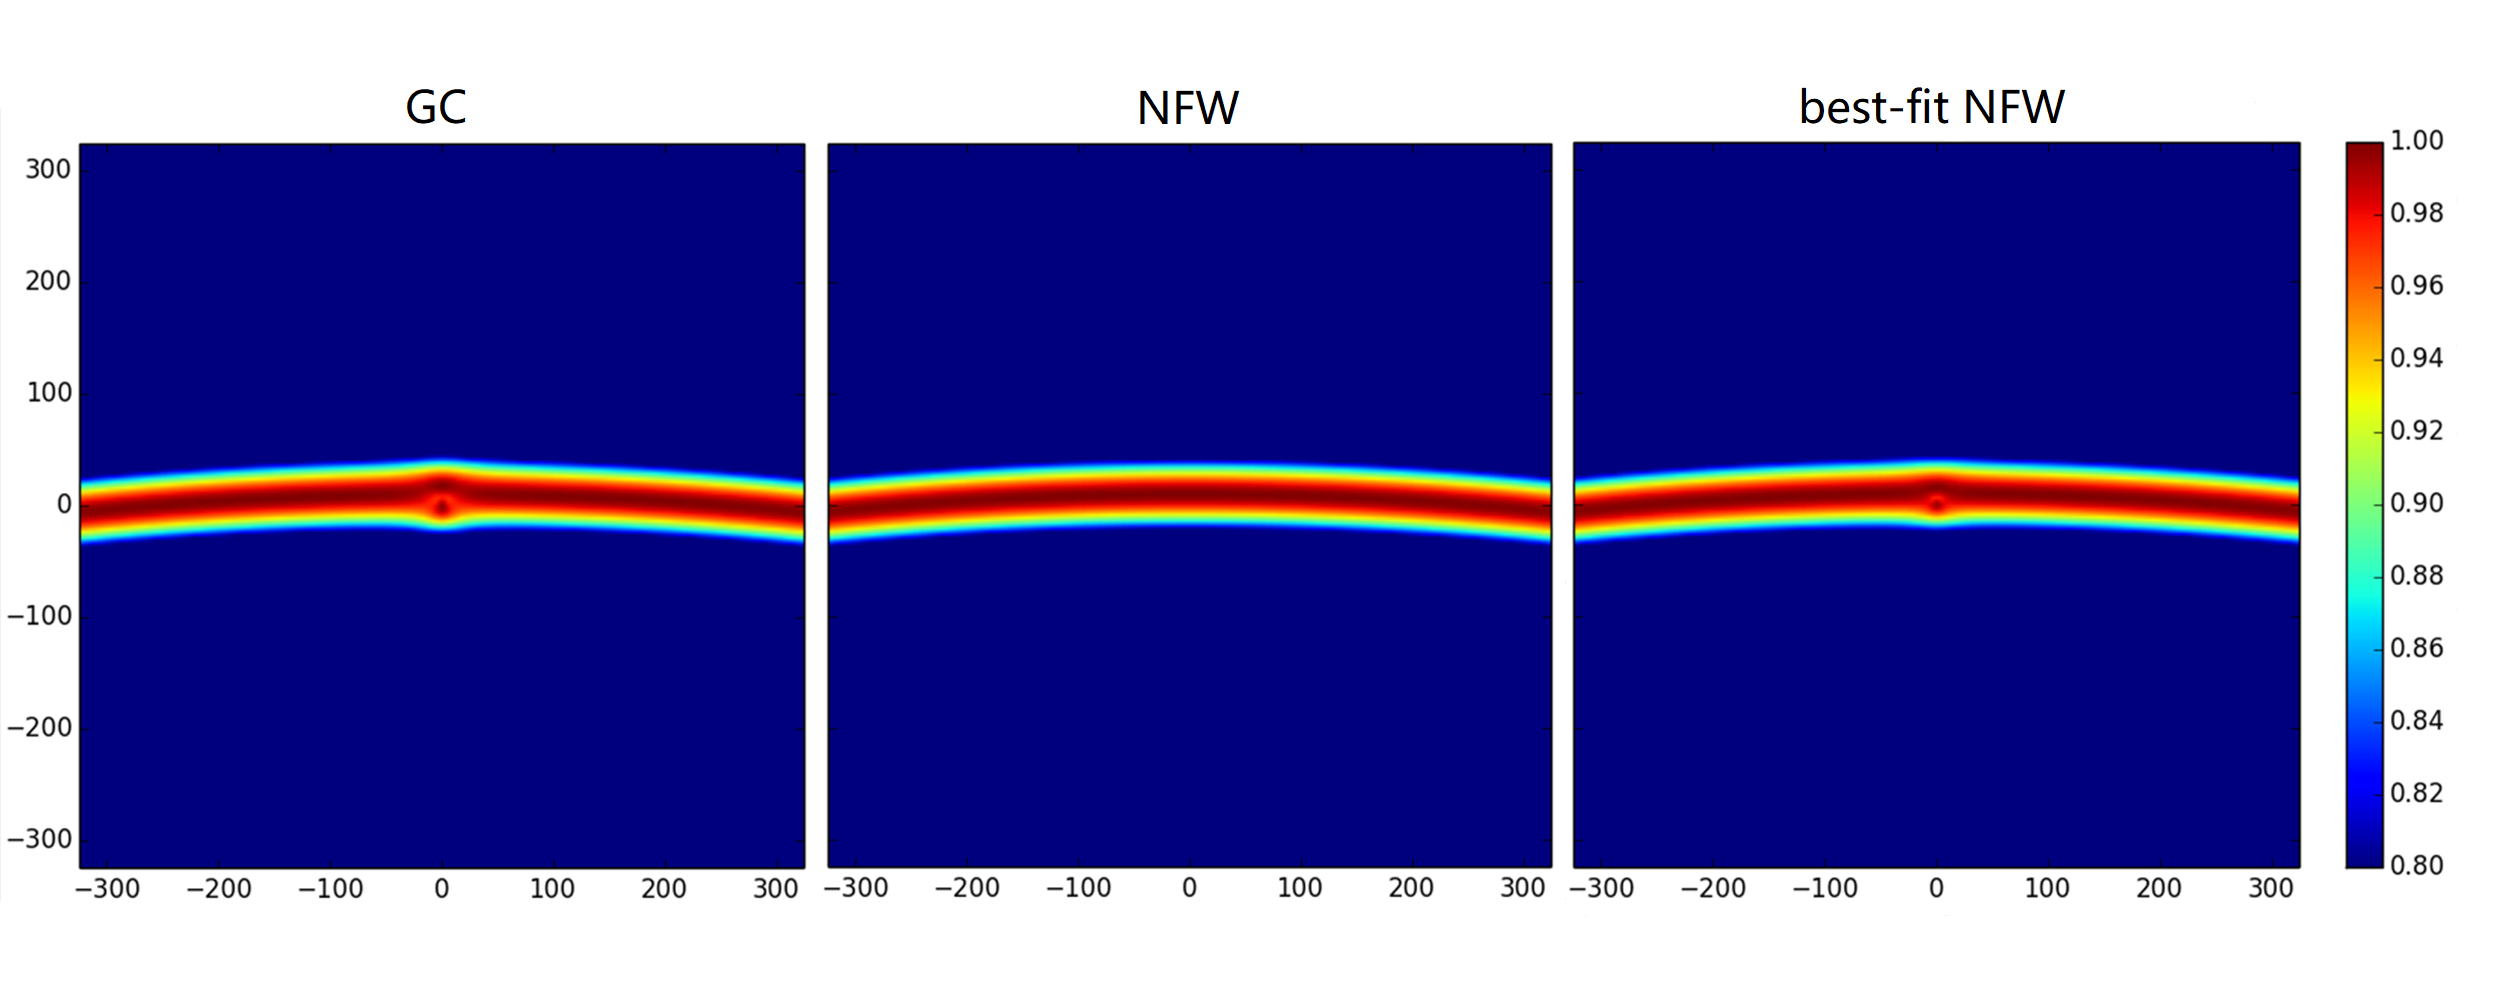
In Fig.4 we illustrate the distortions induced on a lensed image by the different kinds of perturber. Each panel shows a section of an Einstein ring near the projected position of the perturber. The presence of the perturber distorts the image around it. For the globular cluster, the induced distortion changes the surface brightness around its position by about 2%, while for the NFW halo of the same mass, no distortion is visible on the plot.
The right-hand panel of Fig.4 shows the result of force-fitting the perturbation induced by the globular cluster assuming, incorrectly, that it is due to an NFW halo. The best-fit mass of the NFW model is M⊙, which is about 1.5 times the input value for the globular cluster, and the best-fit concentration, , is , which is about 1200 times the value predicted for a cold dark matter halo of that mass (Neto et al., 2007). For six galaxies listed above, the average number density for globular clusters with mass larger than M⊙ is 0.88 arcsec-2, which is larger than that of dark matter halos in the lens plane with mass larger than M⊙ showed in Li et al. (2017), but this will not have great effects on the detection of dark matter halos, since we note that the NFW profile actually cannot fit the image perturbed by the globular cluster. Although the amplitude of the variation in brightness caused by this ultra-dense NFW halo is comparable to that caused by the globular cluster, the differences in the images are still visible by eye. This result demonstrates that although a globular cluster can generate a lensing signal that is strong enough to be detected with VLBI imaging, proper modelling can clearly distinguish between the distortions produced by globular clusters and by dark matter haloes.
5 Discussion and Summary
Small distortions of images of Einstein rings or giant arcs offer the exciting prospect of detecting dark matter haloes or subhaloes too small to have made a visible galaxy. Since a fundamental property of the cold dark matter model of cosmogony, which distinguishes it from other possibilities such as warm dark matter, is the existence of a very large number of such small haloes, detecting them could discriminate between different kinds of dark matter particles, and even rule out the cold dark matter model altogether.
A possible source of contamination of the signal are globular clusters which can also distort a strong lensed image. These distortions are detectable with milli-arcsecond resolution imaging. In this paper we have calculated the lensing effect of globular clusters and compared it to the lensing effect of intervening dark matter haloes.
We selected six early type galaxies in the Virgo cluster of stellar mass M⊙, similar to the mass of strong lens galaxies in the SLAC survey. The number density of globular clusters of mass M⊙ is between 1.5 to 9 arcsec-2, which is comparable to the number of dark matter perturbers, when both subhaloes and line-of-sight haloes in the same mass range are counted. These globular clusters are not massive enough to be detected through their lensing effects with images taken by Hubble Space Telescope at the typical lens redshift, but can be detected with VLBI imaging of milli-arsecond resolution.
We used a ray-tracing method to compare the distortions of the image of an Einstein ring or giant arc induced by a globular cluster and by an NFW halo. We find that the globular cluster produces a much stronger lensing signal than an NFW halo of the same mass, because the density profile of a globular cluster is much more centrally concentrated than that of a dark matter halo.
Imaging at milli-arsecond resolution can therefore distinguish a globular cluster from a dark matter halo. If the NFW density profile is used to model the distortion caused by a globular cluster a poor fit is obtained and the inferred concentration parameter is orders of magnitute higher than the concentration of a real NFW halo of the same mass. We conclude that globular clusters will not compromise efforts to measure the abundance of low mass dark matter haloes and subhaloes, but their detection would be a byproduct of efforts to constrain the identity of the dark matter from the strong lensing test.
ACKNOWLEDGEMENTS
RL acknowledges NSFC grant (Nos.11303033, 11511130054,11333001), support from the Youth Innovation Promotion Association of CAS and Nebula Talent Program of NAOC and Newton Mobility award. Qiuhan is supported by undergraduate research program of CAS. EWP and SL acknowledge support from the National Natural Science Foudation of China under grant No. 11573002. This work was supported in part by STFC Consolidated Grant ST/L00075X/1 to Durham and by ERC Advanced Investigator grant, COSMIWAY. This work used the DiRAC Data Centric system at Durham University, operated by the Institute for Computational Cosmology on behalf of the STFC DiRAC HPC Facility (www.dirac.ac.uk). This equipment was funded by BIS National E-infrastructure capital grant ST/K00042X/1, STFC capital grants ST/H008519/1 and ST/K00087X/1, STFC DiRAC Operations grant ST/K003267/1 and Durham University. DiRAC is part of the National E-Infrastructure.
References
- Benson et al. (2002) Benson A. J., Lacey C. G., Baugh C. M., Cole S., Frenk C. S., 2002, MNRAS, 333, 156
- Blakeslee et al. (1997) Blakeslee J. P., Tonry J. L., Metzger M. R., 1997, AJ, 114, 482
- Bolton et al. (2008) Bolton A. S., Burles S., Koopmans L. V. E., Treu T., Gavazzi R., Moustakas L. A., Wayth R., Schlegel D. J., 2008, ApJ, 682, 964
- Bose et al. (2016) Bose S., Hellwing W. A., Frenk C. S., Jenkins A., Lovell M. R., Helly J. C., Li B., 2016, MNRAS, 455, 318
- Boyarsky et al. (2009) Boyarsky A., Ruchayskiy O., Shaposhnikov M., 2009, Annual Review of Nuclear and Particle Science, 59, 191
- Boyarsky et al. (2014) Boyarsky A., Ruchayskiy O., Iakubovskyi D., Franse J., 2014, Physical Review Letters, 113, 251301
- Bulbul et al. (2014) Bulbul E., Markevitch M., Foster A., Smith R. K., Loewenstein M., Randall S. W., 2014, ApJ, 789, 13
- Bullock et al. (2000) Bullock J. S., Kravtsov A. V., Weinberg D. H., 2000, ApJ, 539, 517
- D’Souza & Rix (2013) D’Souza R., Rix H.-W., 2013, MNRAS, 429, 1887
- Diemand et al. (2007) Diemand J., Kuhlen M., Madau P., 2007, ApJ, 667, 859
- Frenk & White (2012) Frenk C. S., White S. D. M., 2012, Annalen der Physik, 524, 507
- Garrison-Kimmel et al. (2017) Garrison-Kimmel S., et al., 2017, preprint, (arXiv:1701.03792)
- Green et al. (2005) Green A. M., Hofmann S., Schwarz D. J., 2005, J. Cosmology Astropart. Phys., 8, 003
- Hezaveh et al. (2016) Hezaveh Y. D., et al., 2016, ApJ, 823, 37
- Hudson et al. (2014) Hudson M. J., Harris G. L., Harris W. E., 2014, ApJ, 787, L5
- Jordán et al. (2007) Jordán A., et al., 2007, ApJS, 171, 101
- Jordán et al. (2009) Jordán A., et al., 2009, ApJS, 180, 54
- Kennedy et al. (2014) Kennedy R., Frenk C., Cole S., Benson A., 2014, MNRAS, 442, 2487
- King (1966) King I. R., 1966, AJ, 71, 64
- Koopmans (2005) Koopmans L. V. E., 2005, MNRAS, 363, 1136
- Li et al. (2016) Li R., Frenk C. S., Cole S., Gao L., Bose S., Hellwing W. A., 2016, MNRAS
- Li et al. (2017) Li R., Frenk C. S., Cole S., Wang Q., Gao L., 2017, MNRAS, 468, 1426
- Lovell et al. (2016) Lovell M. R., et al., 2016, MNRAS, 461, 60
- Macciò et al. (2006) Macciò A. V., Moore B., Stadel J., Diemand J., 2006, MNRAS, 366, 1529
- McKean et al. (2015) McKean J., et al., 2015, Advancing Astrophysics with the Square Kilometre Array (AASKA14), p. 84
- McLaughlin & van der Marel (2005) McLaughlin D. E., van der Marel R. P., 2005, ApJS, 161, 304
- Navarro et al. (1996) Navarro J. F., Frenk C. S., White S. D. M., 1996, ApJ, 462, 563
- Navarro et al. (1997) Navarro J. F., Frenk C. S., White S. D. M., 1997, ApJ, 490, 493
- Neto et al. (2007) Neto A. F., et al., 2007, MNRAS, 381, 1450
- Okamoto & Frenk (2009) Okamoto T., Frenk C. S., 2009, MNRAS, 399, L174
- Peng et al. (2008) Peng E. W., et al., 2008, ApJ, 681, 197
- Sawala et al. (2016) Sawala T., et al., 2016, MNRAS, 456, 85
- Sawala et al. (2017) Sawala T., Pihajoki P., Johansson P. H., Frenk C. S., Navarro J. F., Oman K. A., White S. D. M., 2017, MNRAS, 467, 4383
- Sérsic (1968) Sérsic J. L., 1968, Atlas de galaxias australes
- Somerville (2002) Somerville R. S., 2002, ApJ, 572, L23
- Springel (2005) Springel V., 2005, MNRAS, 364, 1105
- Springel et al. (2008) Springel V., et al., 2008, MNRAS, 391, 1685
- Vegetti & Koopmans (2009a) Vegetti S., Koopmans L. V. E., 2009a, MNRAS
- Vegetti & Koopmans (2009b) Vegetti S., Koopmans L. V. E., 2009b, MNRAS, 400, 1583
- Vegetti et al. (2010) Vegetti S., Koopmans L. V. E., Bolton A., Treu T., Gavazzi R., 2010, MNRAS, 408, 1969
- Vegetti et al. (2012) Vegetti S., Lagattuta D. J., McKean J. P., Auger M. W., Fassnacht C. D., Koopmans L. V. E., 2012, Nature, 481, 341
- Wetzel et al. (2016) Wetzel A. R., Hopkins P. F., Kim J.-h., Faucher-Giguère C.-A., Kereš D., Quataert E., 2016, ApJ, 827, L23
- Xu et al. (2015) Xu D., Sluse D., Gao L., Wang J., Frenk C., Mao S., Schneider P., Springel V., 2015, MNRAS, 447, 3189