[OAB]
[OCA]
OAB]INAF-Osservatorio Astronomico di Brera,
Via E. Bianchi 46, 23807 Merate (LC), Italy
OCA]
Université Côte d’Azur, OCA, CNRS, Lagrange, Nice, France
Interferometric and spectroscopic observations of the BRITE target Cep
Abstract
We used new HARPS-N spectra to revisitate the projection factor of Cep and to directly measure the specific contribution of the velocity gradient within the atmosphere.
1 Introduction
The classical Baade-Wesselink method allows us to measure the diameters of pulsating stars by using the radial velocity and colour curves over the pulsation period. Instead of the colour curve, the interferometric version of the Baade-Wesselink approach uses the angular variations of the stellar diameter, thus becoming a direct method to determine the distance of the pulsating star. A few years ago we started a collaboration between the Observatoire Côte d’Azur (Nice, France) and the INAF-Osservatorio Astronomico di Brera (Milano, Italy) aimed at improving the use of classical pulsators as stellar candles. To pursue this goal we put together our expertises in stellar interferometry and high-resolution spectroscopy (Guiglion et al., 2013; Nardetto et al., 2014, 2016).
2 The physics behind the projection factor
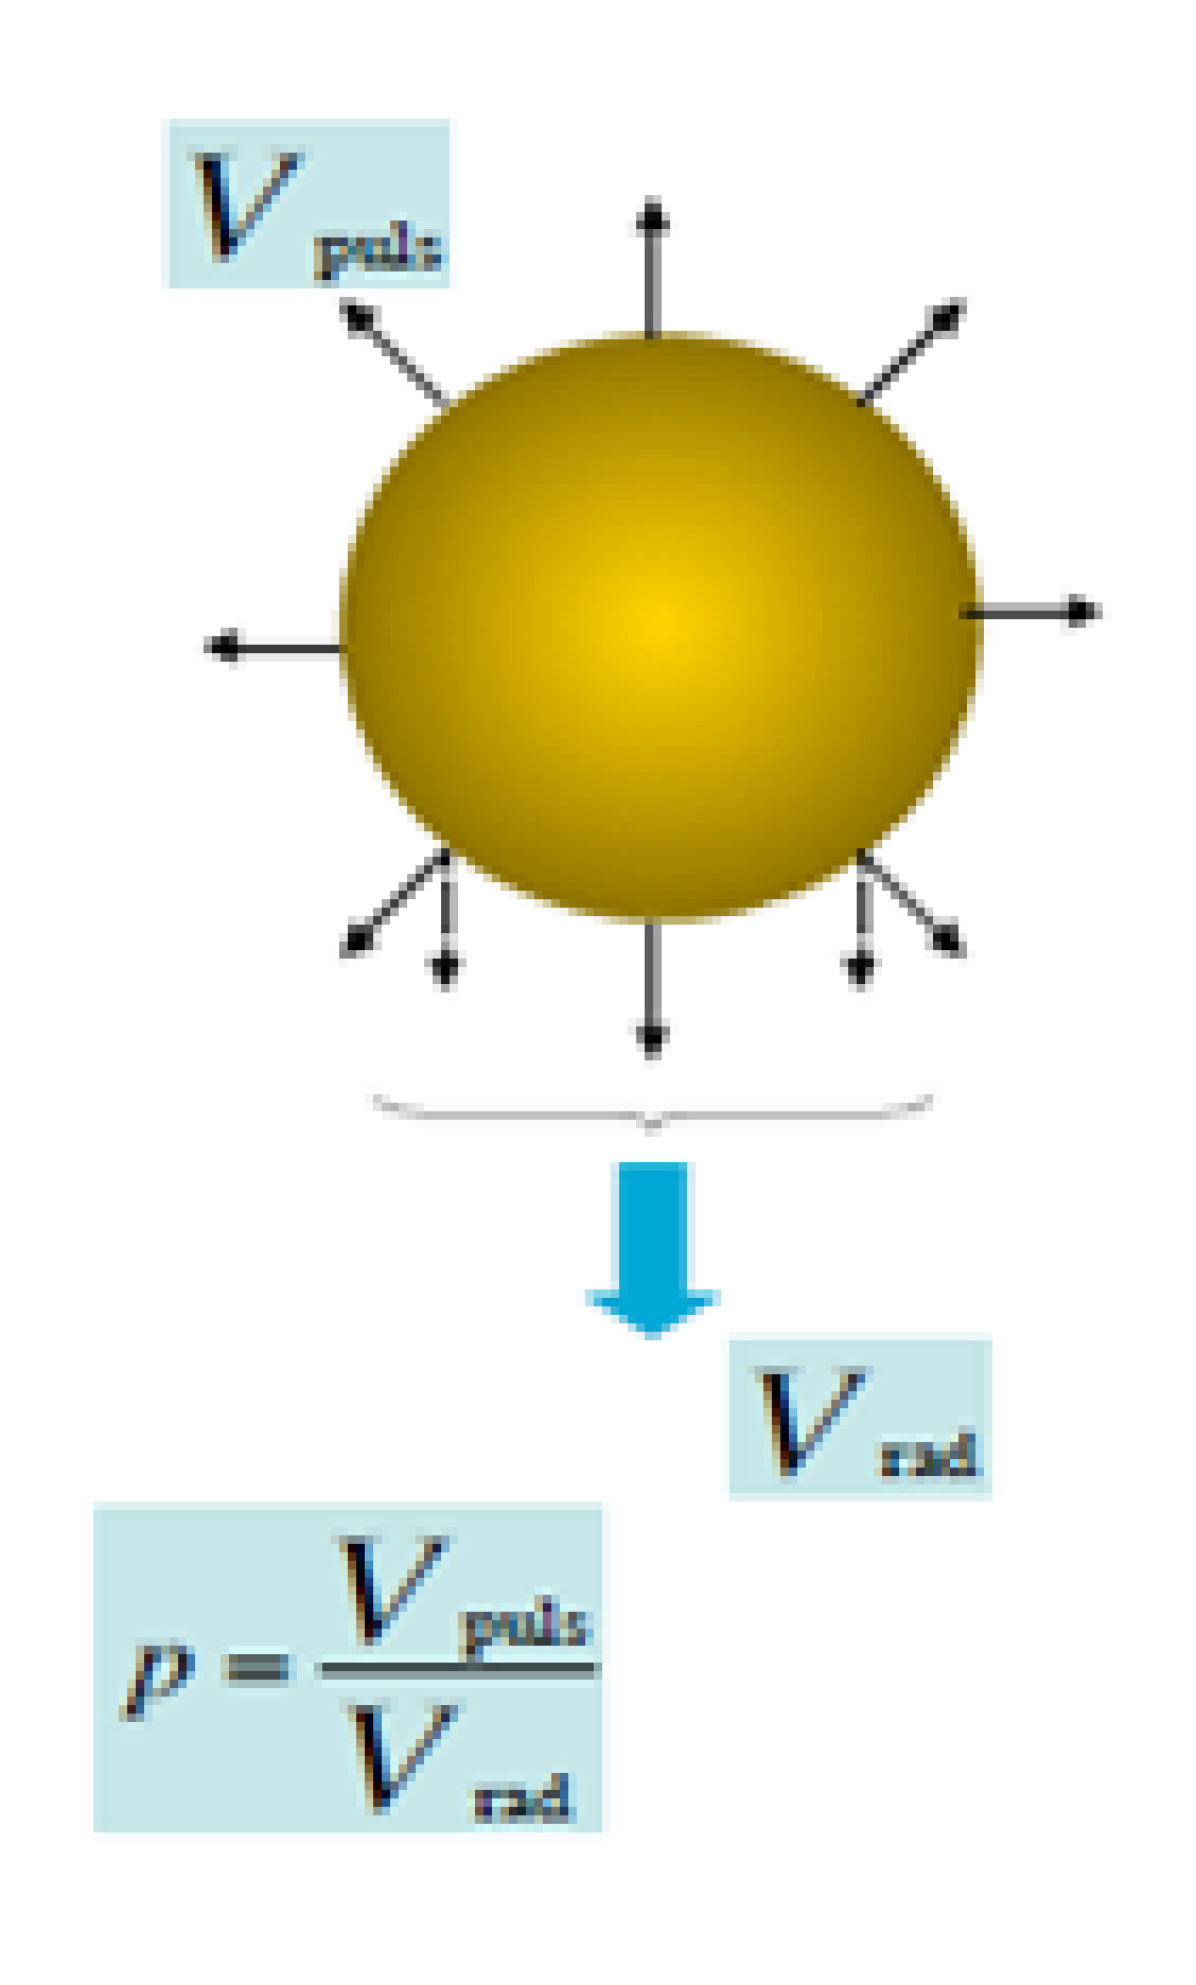
When we measure the Doppler effect in the atmosphere of a pulsating star like a Cepheid we actually measure the radial component of the pulsation velocity field, i.e., the projection of the radial velocity along the line of sight (Fig. 2). The recipe to go back to the true velocity pulsation from the observed contains three ingredients, reflecting three different physical effects. They can be summarized in the decomposition of the projection factor into the geometrical factor , the gradient , and the correction factor (Nardetto et al., 2007):
| (1) |
The physical effects behind each factor are:
-
1.
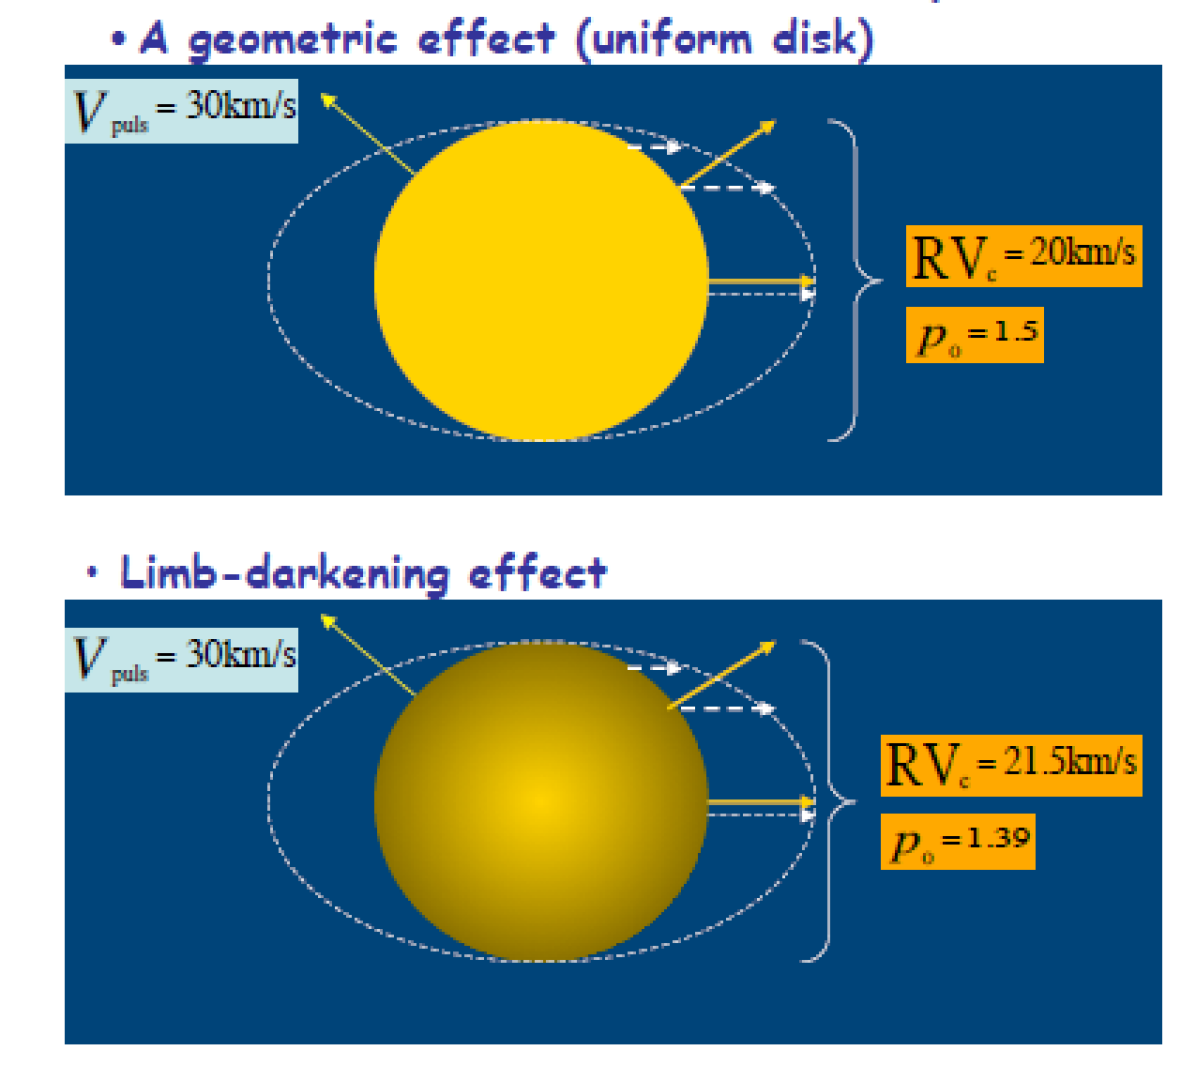
we must consider that the flux coming out from the borders is reduced by the limb darkening law, describing the changes in the surface brigthness (Fig. 2, lower panel). Such a quantity acts a weight of the radial component in function of the distance from the photocenter. The so-called geometrical factor has to be introduced (Fig. 3, shift indicated with “2") to compensate this effect;
-
2.
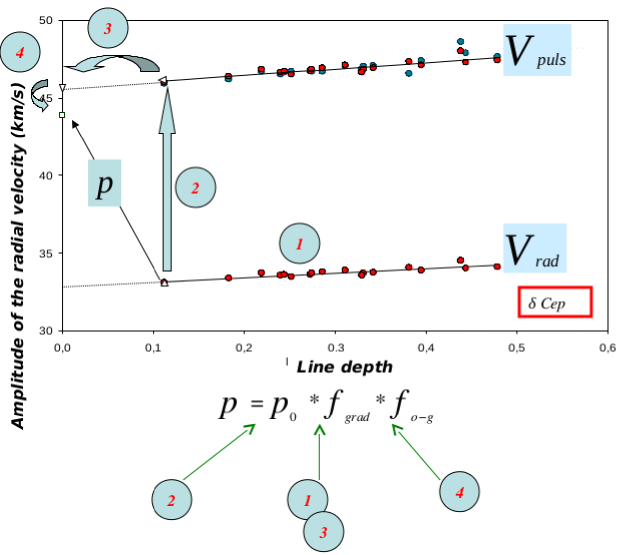
we measure the radial velocities of the lines in the spectra by means of their shifts in wavelength. We have to take into account that the absorption lines are forming in different regions of the stellar atmosphere. In the extended atmospheres of Cepheids, different regions have different radial velocity amplitudes and mean values. Therefore, such values are line-dependent and then prone to show a gradient (Fig. 3, straight line indicated with “1");
-
3.
the interferometric and photometric radii correspond to the photosphere of the star, hence we have to extrapolate the spectroscopic one to it (hypothetical line of null depth; Fig. 3, indicated with “3"). Moreover, spectroscopy is sensitive to gas (g) movement while interferometry and photometry are sensitive to the optical (o) continuum. A last correction is necessary to combine the different techniques (Fig. 3, shift indicated with “4").
It is quite evident that without knowing the projection factor we cannot use the Baade-Wesselink method to determine the distances of the sources and of the environments in which they are embedded.
3 The HARPS-N contribution
The high-precision radial-velocity spectrograph HARPS-N (Cosentino et al., 2012) is installed at the 3.58-m Telescopio Nazionale Galileo (TNG), located at the Roque de los Muchachos Observatory (La Palma, Canary Islands, Spain). One-hundred-three spectra of Cep were secured between March 27th and September 6th, 2015 in the framework of the OPTICON proposal 2015B/015. Interferometric data of Cep were previously obtained (Mérand et al., 2005) with the Fiber Linked Unit for Optical Recombination (FLUOR; Coudé du Foresto et al., 1997) operating at the Center for High Angular Resolution Astronomy array (CHARA, Mount Wilson Observatory, USA; ten Brummelaar et al., 2005). By using the known trigonometric distance of Cep (=272 pc; Majaess et al., 2012) we could apply the inverse interferometric Baade-Wesselink method to the CHARA and HARPS-N data to derive an observed value of the projection factor . We obtained =1.2390.031.

In the context of the quantitative evaluation of the three physical effects concurring to form the projection factor, we used the HARPS-N spectra to derive the atmospheric gradient directly. To do this we need a proxy for the height of the line-forming region in the stellar atmosphere. Such proxy is provided by the line depth taken at the minimum radius phase (Nardetto et al., 2007). The photosphere sets the zero line depth. Figure 4 shows the plot obtained from 15 unblended spectral lines from 4683 to 6336 Å (twelve of Fe i, one each of Ni i, Si i and Ti ii; two more lines of Fe i are not discussed here for sake of semplicity; see Nardetto et al., 2017, for further details). We computed the amplitude of the radial velocity curve (the suffix stands for the centroid method, different from the cross correlation one used by the HARPS-N pipeline) for each line by means of a Fourier decomposition. After this, we computed the least-squares fitting line
| (2) |
The correcting factor due to the velocity gradient can be computed as the ratio between the amplitude extrapolated at the photosphere (=0) and that of the given line (Nardetto et al., 2007)
| (3) |
where and are the slope and zero-point of the linear fit. Therefore, for the first time we could determine from the observations: the values are ranging from 0.964 (Fe i at 5367 Å) to 0.991 (Fe i at 4896 Å), with a typical error bar of 0.010.
4 Conclusions
The first measurement of was not the only result obtained from HARPS-N spectra. By introducing an hydrodynamical model we could also determine the semi-theoretical values =0.975002 and =1.0060.002 by assuming radiative transfer in plane-parallel or sherically symmetric geometries, respectively. The whole procedure is described in Nardetto et al. (2017).
We are planning to observe other bright Cepheids both in interferometry and high-resolution spectroscopy. An improving of the current performances of the BRITE two-colours photometry could allow us to link the classical and interferometric Baade-Wesselink method, thus getting a closer look to the physics related to the projection factor and a very important feedback on the distance scale (Mérand et al., 2015). This exercise would be very useful to validate a new task merging interferometry, spectroscopy and photometry to be included in the PLATO complementary science, exploting at best the two onboard telescopes equipped with filters.
Acknowledgements.
The observations leading to these results have received funding from the European Commission’s Seventh Framework Programme (FP7/2013-2016) under grant agreement No. 312430 (OPTICON). EP and NN acknowledge financial support from the PRIN-INAF 2014 and the ANR-15-CE31-0012- 01, respectively. Based in part on data collected by the BRITE-Constellation satellite mission, built, launched and operated thanks to support from the Austrian Aeronautics and Space Agency (FFG-ALR) and the University of Vienna, the Canadian Space Agency (CSA), and the Foundation for Polish Science & Technology (FNiTP MNiSW) and National Science Centre (NCN).References
- Cosentino et al. (2012) Cosentino, R., et al., HARPS-N: the new planet hunter at TNG, Society of Photo-Optical Instrumentation Engineers (SPIE) Conference Series 8446, 1 (2012)
- Coudé du Foresto et al. (1997) Coudé du Foresto, V., Ridgway, S., Mariotti, J.-M., Deriving object visibilities from interferograms obtained with a fiber stellar interferometer, A&AS 121, 379 (1997)
- Guiglion et al. (2013) Guiglion, G., et al., Understanding the dynamical structure of pulsating stars: The Baade-Wesselink projection factor of the Scuti stars AI Velorum and Cassiopeiae, A&A 550, L10 (2013)
- Majaess et al. (2012) Majaess, D., Turner, D., Gieren, W., New Evidence Supporting Cluster Membership for the Keystone Calibrator Delta Cephei, ApJ 747, 145 (2012)
- Mérand et al. (2005) Mérand, A., et al., The projection factor of Cephei. A calibration of the Baade-Wesselink method using the CHARA Array, A&A 438, L9 (2005)
- Mérand et al. (2015) Mérand, A., et al., Cepheid distances from the SpectroPhoto-Interferometry of Pulsating Stars (SPIPS). Application to the prototypes Cephei and Aquilae, A&A 584, A80 (2015)
- Nardetto et al. (2007) Nardetto, N., et al., High-resolution spectroscopy for Cepheids distance determination II. A period-projection factor relation, A&A 471, 661 (2007)
- Nardetto et al. (2014) Nardetto, N., et al., Understanding the dynamical structure of pulsating stars: HARPS spectroscopy of the Scuti stars Puppis and DX Ceti, A&A 561, A151 (2014)
- Nardetto et al. (2016) Nardetto, N., et al., VEGA/CHARA interferometric observations of Cepheids. I. A resolved structure around the prototype classical Cepheid Cep in the visible spectral range, A&A 593, A45 (2016)
- Nardetto et al. (2017) Nardetto, N., et al., HARPS-N high spectral resolution observations of Cepheids I. The Baade-Wesselink projection factor of Cep revisited, A&A 597, A73 (2017)
- ten Brummelaar et al. (2005) ten Brummelaar, T. A., et al., First Results from the CHARA Array. II. A Description of the Instrument, ApJ 628, 453 (2005)