Theories for influencer identification in complex networks
Abstract
In social and biological systems, the structural heterogeneity of interaction networks gives rise to the emergence of a small set of influential nodes, or influencers, in a series of dynamical processes. Although much smaller than the entire network, these influencers were observed to be able to shape the collective dynamics of large populations in different contexts. As such, the successful identification of influencers should have profound implications in various real-world spreading dynamics such as viral marketing, epidemic outbreaks and cascading failure. In this chapter, we first summarize the centrality-based approach in finding single influencers in complex networks, and then discuss the more complicated problem of locating multiple influencers from a collective point of view. Progress rooted in collective influence theory, belief-propagation and computer science will be presented. Finally, we present some applications of influencer identification in diverse real-world systems, including online social platforms, scientific publication, brain networks and socioeconomic systems.
1 Introduction
In spreading processes of information, it is well known that certain individuals are more influential than others. In the field of information diffusion, it has been accepted that the ability of influencers to initiate a large-scale spreading is attributed to their privileged locations in the underlying social networks watts2007influentials ; kitsak2010identification ; pei2013spreading ; min2016searching . Due to the direct relevance of influencer identification in such phenomena as viral marketing leskovec2007dynamics , innovation diffusion rogers2010diffusion , behavior adoption centola2010spread and epidemic spreading pastor2001epidemic , the research on searching for influential spreaders in different settings is becoming increasingly important in recent years pei2013spreading .
In the relative simple case of locating individual influencers, given the rich structural information encoded in nodes’ location in the network, it is straightforward to measure the influence of a single node using centrality-based heuristics. Over the years, a growing number of predictors have been developed and routinely employed to rank single node’s influence in spreading processes, among which the most widely used ones include number of connection albert2000error , k-core seidman1983network , betweenness centrality freeman1978centrality and PageRank brin1998anatomy , just to name a few. Beyond this non-interacting problem, a more challenging task is to identify a set of influencers to achieve maximal collective influence. Originally formulated in the context of viral marketing richardson2002mining , collective influence maximization is in fact a core optimization problem in an array of important applications in various domains, ranging from cost-effective marketing in commercial promotion, optimal immunization in epidemic control, to strategic protection against targeted attacks on infrastructures. In addition to the topological complexity of network structure, collective influence maximization is further complicated by the entwined interactions between multiple spreaders, which renders the aforementioned centrality-based approaches invalid. As a result, it is required to treat the problem from a collective point of view to develop effective solutions morone2015influence .
2 Finding individual influencers
In reality, many spreading phenomena are typically initiated by a single spreader. For instance, an epidemic outbreak in a local area is usually caused by the first infected person. For such processes, ranking the spreading capability of individual spreaders is of great significance in both accelerating and confining the diffusion.
2.1 Topological measures
Intuitively, the nodes with large numbers of connections should have more influence on their direct neighbors. The disproportionate effect of highly-connected nodes, or hubs, on dynamical processes has been revealed in the early works on the vulnerability of scale-free networks albert2000error ; cohen2001breakdown . The targeted attack on a very small number of high-degree nodes will rapidly collapse the giant component of networks with heavy-tailed degree distribution. Compared with other more complex centrality measures, the computational burden of degree is almost negligible. Due to this, the simple degree centrality has been playing an important role in influencer identification. In implementation, the performance of high-degree ranking can be further enhanced by a simple adaptive calculation procedure, that is, recalculating the degree of remaining nodes after the removal of previously selected nodes.
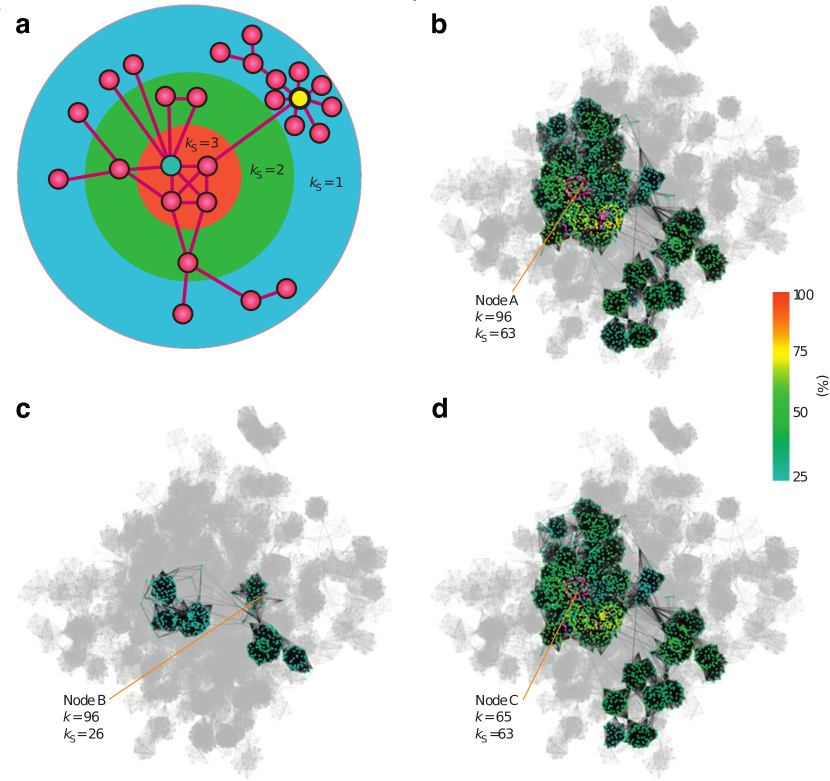
An obvious drawback of degree centrality is that it only considers the number of direct neighbors. However, as indicated by empirical studies, most spreading phenomena are proceeded in a cascading fashion. Therefore, the ultimate influence of a single spreader is also affected by the global network structure. In realistic complex networks, high-degree nodes can appear at either the core area or the periphery region. This implies, the number of connections may not be a reliable indicator of influencers in real-world systems. Recently, Kitsak et al. confirmed this speculation through extensive simulations of susceptible-infected-recovered (SIR) and susceptible-infected-susceptible (SIS) dynamics on diverse real-world social networks kitsak2010identification . In SIR model, a susceptible individual will become infected with a probability upon contact with his/her infected neighbors, and infected population will recover with a probability and become immune to the disease. In SIS model, the infection follows the same dynamics but infected persons will become susceptible again with a probability . As shown in Fig. 1b-d, SIR spreading processes initiated by two hubs with the same degree could result in quite different infected population, depending on their global position in the network. In contrast, the k-core index, which distinguishes the network core and periphery, is a more reliable predictor of influence.
The k-core index is obtained by the k-shell decomposition in which nodes are iteratively pruned according to their remaining degree in the network (see Fig. 1a) seidman1983network . Specifically, nodes with degree are first removed successively until there is no node left with one link. The removed nodes are assigned with k-core index . Then we remove nodes with degree similarly and continue to prune higher k-shells until no node left in the network. In terms of computational complexity, the above decomposition process can be finished within operations, where is the number of links batagelj2003m . Thus k-core ranking is feasible for large-scale complex networks encountered in big-data analysis.
As illustrated in Fig. 1a, the classification of k-core can be very different from that of degree. A hub with low k-core index is usually surrounded by many low-degree neighbors that limit the influence of the hub. On the contrary, nodes located in the core region, although may have moderate degree, are capable of generating large-scale spreading facilitated by their well-connected neighbors. In the case where recovered individuals do not develop immunity, infections would persist in the high k-core area. These findings challenge the previous predominate focus on the number of connections. The simple yet effective measure k-core has inspired several generalizations in consideration of the detailed local environment in the vicinity of high k-core nodes zeng2013ranking ; liu2014core ; liu2015improving ; lu2016h .
Although k-core was found effective in SIR and SIS spreading dynamics, some studies indicate that it may not be a good predictor of influence for other spreading models. For instance, in rumor spreading model, Borge-Holthoefer and Moreno borge2012absence showed that the spreading capabilities of the nodes did not depend on their k-core values. These contradictory results relying on the choice of specific spreading model necessitate more extensive empirical validation with real information flow pei2014searching .
Apart from the k-core index, another measure that takes into account the global network structure is eigenvector centrality bonacich1972factoring ; restrepo2006characterizing . The reasoning behind the eigenvector centrality is that the influence of an individual is determined by the spreading capability of his/her neighbors. Starting from a uniform score assigned to each node, the scores propagate along the links until a steady state is reached. In calculation, each step of score propagation corresponds to a left multiplication of the adjacency matrix to the current score vector. This procedure is actually the power method to compute the principal eigenvalue of the adjacency matrix. As a result, the steady score vector is in fact proportional to the right eigenvector corresponding to the largest eigenvalue. Notice that, supposing the initial score of each node is one, the first step of iteration will recover the degree centrality.
Despite the wide application of eigenvector centrality, it was recently found that the scores could be localized at a few high degree nodes due to the repeated reflection of scores from their neighbors during the iteration. Martin et al. solved this problem by using the leading eigenvector of the Hashimoto Non-Backtracking (NB) matrix martin2014localization . In NB matrix, the immediate backtracking paths and are not permissible hashimoto1989zeta , thus avoiding the heavy score accumulation caused by the recurrent one-step reflection. Recently, by mapping the SIR spreading process to bond percolation, Radicchi and Castellano proved that the NB centrality was an optimized predictor for single influencers in SIR model at criticality radicchi2016leveraging . In next section, we will see the important role of NB matrix in collective influence maximization and optimal percolation morone2015influence .
2.2 Dynamics-based measures
Beyond the above pure topological measures, a number of centralities are developed on the basis of specific assumptions on the spreading dynamics. In some classical centralities proposed in the field of social networks, much emphasis is put on the shortest path. Along this way, several renowned centralities were developed and widely accepted in social network ranking. For instance, the closeness centrality quantifies the shortest distance from a given node to all other reachable nodes in the network sabidussi1966centrality , while betweenness centrality measures the fraction of shortest paths cross through a certain individual between all node pairs freeman1978centrality . A useful generalization of closeness centrality is the Katz centrality katz1953new , which considers all possible paths in the network, but assigns a larger weight to shorter paths using a tunable parameter. In application, the applicability of these shortest-path-based centralities is limited by the high computational complexity of calculating the shortest paths between all pairs of nodes. As a result, they are more suitable for small or medium scale networks.
Another group of metrics are designed based on random walks. A famous random walk based centrality is PageRank brin1998anatomy . As a revolutionary webpage ranking algorithm, PageRank mimics a random walk process along the directed hyperlinks. To avoid the random walker trapped in the dangled nodes, a jumping probability is introduced to allow the walker jump to a randomly chosen node. The PageRank score is the stationary probability of each node to be visited by the random walker, which can be calculated through iteration. In applications, the PageRank of a node in a network can be calculated from , where is the number of outgoing links from node and is the jumping probability. In a generalization called LeaderRank lu2011leaders , a ground node is connected to all other nodes by additional bidirectional links. This procedure ensures the network to be strongly connected so that the convergence becomes faster.
In addition to the aforementioned centralities designed for general spreading processes, several measures are proposed aimed at specific dynamics, depending explicitly on model parameters. In these approaches, the development of measures is based on the equations depicting the dynamical process. Usually, the analysis of equations will naturally lead to the procedure of path counting in which the number of possible spreading paths is assessed. For instance, Klemm et al. developed a general framework to evaluate the dynamical importance (DI) of nodes in a series of dynamical processes klemm2012measure . The iterative calculation of DI centrality essentially counts the total number of arbitrarily long walks departing from each node. Another metric relying on possible spreading paths is the expected force (ExF) proposed by Lawyer lawyer2015understanding . To compute the expected force, all possible clusters of infected nodes after transmission events starting from a given node are enumerated. Then the entropy of their cluster degree (i.e., number of outgoing links of the cluster, or infected-susceptible edges) is calculated as the expected force for each node.
The approaches introduced here are far from complete. A growing number of metrics and methods are continuously proposed in the active area of finding single influencers lu2016vital . In designing effective methods for more complex spreading models, the basic principles behind these measures should be universal.
3 Finding multiple influencers
In spite of the great value of estimating individual nodes’ influence with centralities, in a realistic situation, it is more relevant to understand spreading processes initiated by several spreaders. In applications such as viral marketing, it is expected that the spreaders can be coordinated in an optimal manner so that the final collective influence will be maximized. Although it sounds similar to the problem of locating single influencers, the collective influence maximization is in fact a fundamentally different and more difficult problem. In the seminal work of Kempe et al. kempe2003maximizing , the influence maximization problems in both Independent Cascade Model (ICM) and Linear Threshold Model (LTM) were mapped to the NP-complete Vertex Cover problem. This implies, the influence maximization problem cannot be solved exactly within a polynomial time, leaving us the only choice of heuristic approach.
A straightforward idea to find multiple influencers is to select the top-ranked spreaders as individual seeds using centrality measures. However, this approach neglects the interactions and collective effect among spreaders. As demonstrated in SIR simulations, the selected spreaders have significant overlap in their influenced population kitsak2010identification . Therefore, the set of influencers identified with centrality metrics are usually far from optimal. To solve this conundrum, it needs to be treated from a collective point of view morone2015influence .
3.1 Optimal percolation
We start our discussion from the percolation model point of view. As a well-studied dynamical process, percolation was shown to be closely related to spreading and immunization newman2002spread ; pastor2002immunization ; callaway2000network . Percolation is a classical physical process in which nodes or links are randomly removed from a graph stauffer1994introduction . The critical quantity that is of particular interest is the fraction of nodes or links whose removal will collapse the giant component. It is well known that the size of giant component decreases continuously to zero as the number of removed nodes or links increases. In the pioneering works of Newman newman2002spread ; newman2001random , the class of SIR models were mapped to the percolation process for which the critical point of the continuous transition could be solved exactly.
In contrast to the studies focused on random removal, the problem of optimal percolation aims to find the minimal set of nodes that could guarantee the global connectivity of the network, or equivalently, dismantle the network if removed. Morone and Makse showed that, mathematically, the optimization of spreading process following exactly the Linear Threshold Model with threshold ( is the degree of each node) can be mapped to the optimal percolation problem morone2015influence . For this specific spreading model, finding the minimum number of seeds so that the information percolates the entire network is essentially equivalent to locating the optimal set of nodes in the optimal percolation problem. Similarly, the optimal immunization problem, dual of optimal spreading, can also be mapped to optimal percolation morone2015influence . The relation between the cohesion of a network and influence spreading indicates that the most influential spreaders are the nodes that maintain the integrity of the network.
The collective influence theory for optimal percolation is developed based on the message passing equations of the percolation process. For a network with nodes and edges, suppose indicates whether node is removed () or left () in the network. The total fraction of removed nodes is therefore . For a directed link from to (), let denote the probability of node belonging to the giant component in the absence of node . The evolution of satisfies the following self-consistent equation:
| (1) |
where denotes the nearest neighbors of excluding . The final probability of node belonging to the giant component is then determined by () through
| (2) |
The fraction of nodes in the giant component is then given by .
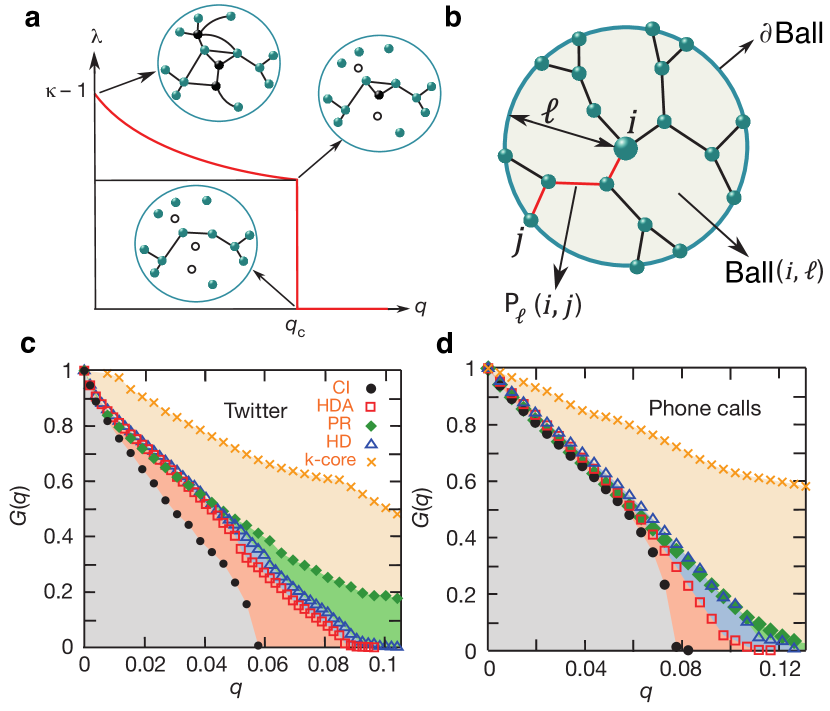
For the continuous phase transition in percolation process, the stability of the zero solution is determined by the largest eigenvalue of the coupling matrix for the linearized Eq. (1) evaluated at (see Fig. 2a). Concretely, is defined on the directed links as . A simple calculation reveals that for locally-tree like random networks, is given in terms of the Non-Backtracking (NB) matrix hashimoto1989zeta via in which if , and otherwise.
To guarantee the stability of the solution , it is required . The optimal influence problem for a given can be rephrased as finding the optimal configuration that minimizes the largest eigenvalue . As approaches the optimal threshold , there exist a decreasing number of configurations that satisfy . At , only one configuration exists such that , and all other configurations will give . The optimal configuration of influencers is therefore obtained when the minimum of the largest eigenvalue satisfies . In practice, the largest eigenvalue can be calculated by the power method (we leave out in ):
| (3) |
Here is the iterations of on initial vector : . To find the best configuration of , we need to minimize the cost function for a finite . Through a proper simplification, we have an approximation of of order as
| (4) |
in which is the frontier of the ball of radius in terms of shortest path centered around node , is the shortest path of length connecting and , and is the degree of node . See an example in Fig. 2b.
Based on the form of Eq. (4), an energy function for each configuration can be defined as follows:
| (5) |
where for odd and for even. For , is exactly the energy function of an Ising model which can be optimized using the cavity method mezard2003cavity . For , it becomes a hard optimization problem involving many-body interactions. To develop a scalable algorithm for big-data analysis, an adaptive method is proposed, which is essentially a greedy algorithm for minimizing the largest eigenvalue of the stability matrix for a given in the form of Eq. (4). In fact, Eq. (5) can be rewritten as the sum of collective influence from single nodes:
| (6) |
in which the collective influence (CI) of node at length is defined as:
| (7) |
The main idea behind the CI algorithm is to remove the nodes that can cause largest decrease of energy function in Eq. (4). In each iteration of CI algorithm, the node with largest CI value is deleted, after which the CI values for remaining nodes are recalculated. The adaptive removal continues until the giant component is fragmented, i.e. . Notice that the procedure minimizes but does not guarantee the minimization of in the percolation phase . If we want to optimize the configuration for , a reinsertion procedure is applied from the configuration at . In practice, if we use a heap structure to find the node with the largest CI and only update the nodes inside the -radius ball around the removed node, the computational complexity of CI algorithm can achieve morone2016collective . As a result, the CI algorithm is scalable for massively large-scale networks in modern social network analysis. For a Twitter network with users (Fig. 2c) and a social network of mobile phone users in Mexico (Fig. 2d), CI algorithm finds a smaller set of influencers than simple scalable heuristics including high degree adaptive (HDA), PageRank (PR), high degree (HD), and k-core morone2015influence . To apply CI algorithm to real-time influencer ranking, a Twitter search engine was developed at http://www.kcore-analytics.com. Notice that, for , CI algorithm degenerates to high-degree ranking. So degree can be interpreted as the zero-oder approximation of CI in Eq. (7).
To guarantee the scalability of the algorithm, CI essentially takes an adaptive greedy approach. The performance of CI algorithm can be further improved by a simple extension of CI using the message passing framework for - the CI propagation algorithm () morone2016collective . Remarkably, the CI propagation algorithm can reproduce the exact analytical threshold of optimal percolation for cubic random regular graphs bau2002decycling . Another belief-propagation variant of CI algorithm based on optimal immunization () also has similar performance of morone2016collective . However, the improvement over CI algorithm is at the price of higher computational complexity , which makes both and unscalable.
Recent studies have shown that the optimal percolation problem is closely related to the optimal decycling problem, or minimum feedback vertex set (FVS) problem karp1972reducibility . Using belief-propagation (BP) algorithms, the optimal percolation problem was solved in recent works mugisha2016identifying ; braunstein2016network . The result of BP algorithms was found better than CI algorithm. Another approach to the optimal destruction of networks makes use of the explosive percolation theory clusella2016immunization .
3.2 Independent Cascade Model
The percolation process is deterministic on a given network with a given seed set. An important class of spreading model with stochasticity is the independent cascade model (ICM) kleinberg2007cascading . In these models, a node is infected or activated by its neighbors with a predefined probability independently. Frequently used independent cascade models include susceptible-infected (SI) model, susceptible-infected-susceptible (SIS) model and susceptible-infected-removed (SIR) model. These models are widely adopted in modeling infectious disease outbreaks and information spreading in social networks hethcote2000mathematics ; kitsak2010identification ; tang2015identification ; pei2015detecting ; yan2014dynamical ; yan2015global . Therefore, it is of particular interest in relevant applications.
In the pioneering work of Kempe et al. kempe2003maximizing , influence maximization was first formalized as a discrete optimization problem: For a given spreading process on a network and an integer , how to find the optimal set of seeds that could generate the largest influence. For a large class of ICM and LTM, the influence maximization problem can be well approximated by a simple greedy strategy, with a provable approximation guarantee kempe2003maximizing . In the basic greedy algorithm, the seed set is obtained by repeatedly selecting the node that provides the largest marginal increase of influence at each time step. The performance guarantee is built on the submodular property of the influence function nemhauser1978analysis , which is defined as the expected number of active nodes if the initial seed set is . The influence function is submodular if the incremental influence of selecting a node into a seed set is no smaller than the incremental influence of selecting the same node into a larger set containing . That is, for all nodes and any sets . Leveraging on the result of submodular function nemhauser1978analysis , the greedy algorithm is guaranteed to approximate the true optimal influence within a factor of , i.e., , where is the seed set obtained by the greedy algorithm and is the true optimal seed set. Although the basic greedy algorithm is simple to implement and performance-guaranteed, it requires massive Monte Carlo simulations to estimate the marginal gain of each candidate node. Several works were proposed to improve the efficiency of greedy algorithm leskovec2007cost ; goyal2011celf++ ; chen2009efficient ; chen2010scalable .
While performance guaranteed, from an optimization point of view, the greedy algorithm may be stuck into local optimum. This drawback can be solved by a more sophisticated message passing approach. Altarelli et al. developed the message passing algorithms (both belief-propagation (BP) and max-sum (MS)) for the problem of optimal immunization for SIR and SIS model altarelli2014containing , which can be applied to general ICMs. From another point of view, the independent cascade model can be naturally mapped to a bond percolation. Hu et al. found that in a series of real-world networks, most SIR spreading would be restrained to a local area while global-scale spreading rarely occurs hu2015optimizing . Using the bond percolation theory, a characteristic local length termed influence radius was revealed. They argue that the global spreading optimization problem in fact can be solved locally, with the knowledge of the local environment within the influence radius.
3.3 Linear Threshold Model
Compared with independent cascade model, linear threshold model is more complex in the sense that a node’s state is collectively determined by its neighbors’ state. In a typical instance of LTM, each node is assigned with a threshold value and each link is assigned with a weight . During the cascade, a node is activated only if the sum of weights of its activated neighbors reaches the threshold value, i.e. . In the case where the weights and thresholds are drawn uniformly from the interval , LTM was proven to be submodular kempe2003maximizing . Therefore, the influence maximization in this class of LTM can be well approximated by the greedy strategy, as we introduced in above section. However, even with the lazy forward update leskovec2007cost , the algorithm is still unscalable for large networks. Chen et al. found a way to approximate the influence of a node in a local subgraph chen2010scalable , and developed a scalable greedy algorithm. Goyal et al. goyal2011simpath further improved this algorithm by considering more choices of paths.
The above greedy approach and its variants are applicable to LTM with submodular property. However, for the general class of LTM with fixed weight and threshold, it is not guaranteed to be submodular kempe2003maximizing . An important class of LTM that may not be submodular is defined as follows: A node is activated only after a certain number of its neighbors are activated. The choice of different threshold can generate two qualitatively different cascade regimes with continuous and discontinuous phase transitions. For instance, in the special case of ( is the degree of node ), a continuous phase transition of influence occurs as the seed set grows morone2015influence . However, there also exist a wide class of LTM exhibiting a first-order, or discontinuous phase transition. In the case that seeds are selected randomly, the transition between these two regimes is explored in detail in the context of bootstrap percolation baxter2010bootstrap ; goltsev2006k and a simple cascade model watts2002simple . But these results are based on the typical dynamical properties starting from random initial conditions. For influence maximization with a special initial condition, the dynamical behavior should be deviated from the average ones. Altarelli et al. proposed a BP algorithm that could estimate statistical properties of nontypical trajectories and found the initial conditions that lead to cascading with desired properties altarelli2013large . To obtain the exact set of seeds, MS equations were derived by setting the inverse temperature in the energy function altarelli2013optimizing . Extending the work under the assumption of replica symmetry, the theoretical limit of the minimal contagious set (the minimal seed set that can activate the entire graph) in random regular graphs is obtained using the cavity method with the effect of replica symmetry breaking guggiola2015minimal .
In big-data analysis, an efficient and scalable algorithm designed for general LTM is needed. Starting from the message passing equations of LTM, generalized from Eq. (1) of percolation, a scalable algorithm named collective influence for threshold model (CI-TM) can be developed pei2016efficient . By iteratively solving the linearized message passing equations, the cascading process can be decomposed to separate components, each of which corresponds to the contribution made by a single seed. Interestingly, it is found the contribution of a seed is determined by the subcritical paths along which cascade propagates. In order to design a scalable algorithm, the node with the largest number of subcritical paths is recursively selected into the seed set. After each selection, the selected node and the subcritical paths attached to it are removed, and the status of the remaining nodes is recalculated. Making use of the heap structure, CI-TM algorithm can achieve the complexity of . On one hand, computing value for a given length is equivalent to iteratively visiting subcritical neighbors of each node layer by layer within radius. Because of the finite search radius, computing for each node takes time. Initially, we have to calculate for all nodes. However, during later adaptive calculation, there is no need to update for all nodes. We only have to recalculate for nodes within steps from the removed vertices, which scales as compared to the network size as as shown in morone2016collective . On the other hand, selecting the node with maximal CI-TM can be realized by making use of the data structure of heap that takes time morone2016collective . Therefore, the overall complexity of ranking nodes is even when we remove the top CI-TM nodes one by one. In both homogeneous and scale-free random networks, CI-TM achieves larger collective influence given the same number of seeds compared with other scalable approaches. This provides a practical method that can be applied to massively large-scale networks.
4 Applications of influencer identification
The problem of influencer identification is ubiquitous in a wide class of applications. So far, the theory of influencer identification has been applied to a number of important problems. In this section, we will introduce the application of influencer identification in three different areas: information diffusion, brain networks, and socioeconomic systems.
4.1 Information diffusion in social networks
The most direct application of influencer identification is to maximize the information diffusion in social networks. In recent years, a huge number of research works have been performed aiming to relate users’ spreading power to their locations, or personal features pei2014searching ; teng2016collective ; min2015finding . These works, mainly focusing on various types of online social networks including email communication liben2008tracing , Facebook viswanath2009evolution ; mislove2007measurement , Twitter cha2010measuring ; bakshy2011everyone ; kwak2010twitter , and blogs sharing communities backstrom2006group ; ramos2014does , enrich our understanding of information diffusion in social networks.
A great challenge of developing effective predictors of influencers comes from the validation. In most of the previous works, the validation of proposed measures depends on modeling of information spreading in a given network. This approach, however, has led to several contradictory results on the best predictor of influence depending on the particular models kitsak2010identification ; borge2012absence . These models are built on simplified assumptions on human behavior hu2014conditions that neglect some of the most important features in real information diffusion gallos2008scaling , such as activity frequency rybski2012communication ; muchnik2013origins , behavior pattern pei2015exploring ; li2014rumor ; teng2014individual , etc. Therefore, it is required to validate the various proposed predictors using empirical diffusion records in real-world social media.
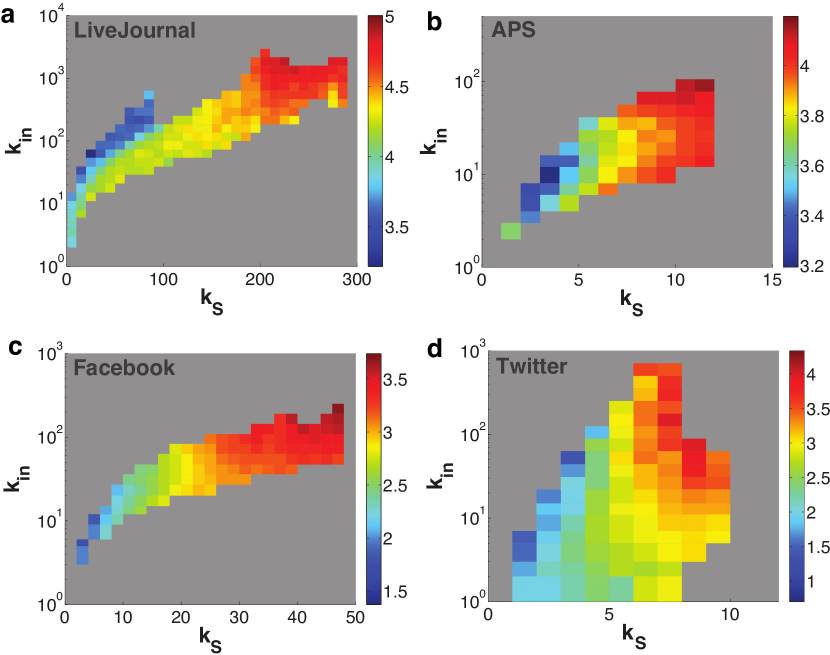
We first compare the performance of different predictors for single influencers pei2014searching . Realistic information diffusion instances as well as the underlying social networks are collected in four dissimilar social platforms: a blog-sharing community LiveJournal, scientific journals of American Physical Society, an online social network Facebook, and microblog service Twitter. To determine the real influence of each node, a directed diffusion graph is first constructed for each system by combining all directed diffusion links together. Then starting from a source node , the total influence of node is computed by tracking the diffusion links layer by layer in a breadth-first-search (BFS) fashion. Once we get the realistic influence, it is convenient to compare the performance of different predictors, including degree, k-core, and PageRank. Specifically, we can calculate the average influence for nodes with a given combination of k-core value and in-degree : , where is the collection of users in the bin, and is the size of this collection. In all the systems, it is consistently observed that nodes with fixed degree can have either large or small influence, while nodes located in the same k-core have similar influence (see Fig. 3). Thus the influence of nodes is more related to their global location in the network, indicated by their k-core values. The same conclusion is also obtained in the comparison with PageRank. K-core does not only predict the average influence better, but also recognize influencers more accurately. Although k-core is effective, it is too coarse to distinguish different nodes within same shells. In some cases, there may be millions of nodes in one shell.
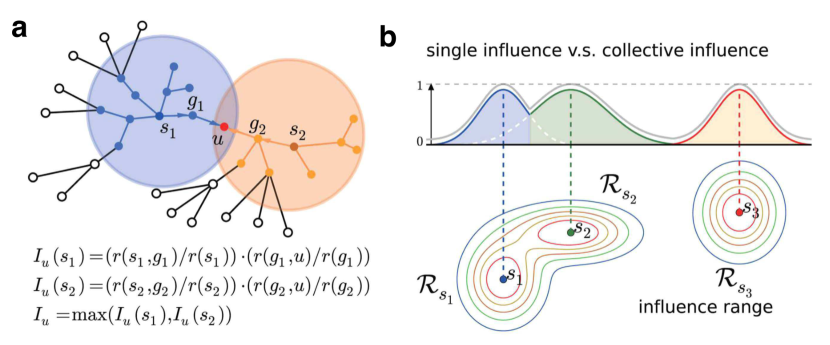
We further investigate the identification of multiple influencers teng2016collective . Again, we use the realistic diffusion instances in the above four platforms. However, the empirical data cannot be directly mapped to ideal multi-source spreading. Such ideal multi-source spreading instances in which spreaders send out the same piece of message at the same time rarely exist in reality. Even though we can find such instances, the initial spreaders are hardly the same as the set of nodes selected by CI or other heuristic strategies. To circumvent this difficulty, we can construct virtual multi-source spreading processes by leveraging the behavior patterns of users extracted from the data. Suppose spreaders are activated at the beginning of the virtual process. The influence strength from seed to its neighbor depends on the tendency of to receive information from . Assume during the observation time, has sent out pieces of messages and has accepted of them. Then the influence strength can be approximated by . In subsequent spreading, may affect its neighbor in the same manner. Following the spreading paths, we can acquire the influence strength enforcing on its -step neighbor : , where . The collective influence for node imposed by the seed set is therefore . See Fig. 4 for an example. Finally, summing up all the nodes in the network, the collective influence of the spreaders imposed on the entire system is . Based on this virtual spreading process, we can evaluate the collective influence of the spreaders selected by different methods. In particular, we compare the influencers selected by collective influence algorithm (CI), adaptive high degree (HDA), high degree (HD), PageRank (PR), and k-core. In all the systems, CI consistently outperforms other ranking methods.
4.2 Collective influence in brain networks
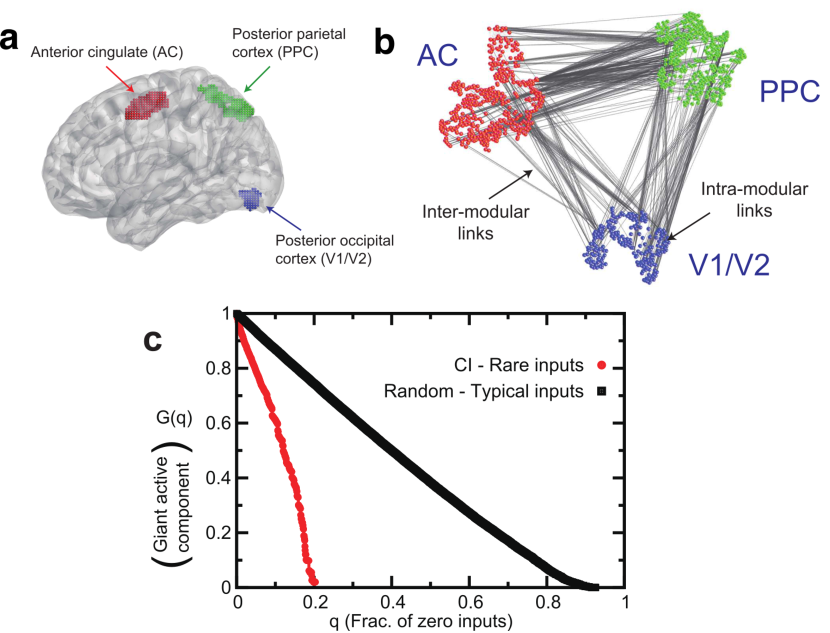
The human brain is a robust modular system interconnected as a Network of Networks (NoN) bullmore2009complex ; reis2014avoiding ; gallos2012small . How this robustness emerges in a modular structure is an important question in many disciplines. Previous interdependent NoN models inspired by power grid are extremely fragile buldyrev2010catastrophic , thus cannot explain the observed robustness in brain networks. To reveal the mechanism beneath this robustness, a NoN model is proposed which can afford inter-link functionality and remain robust at the same time morone2017model ; roth2017emergence .
In NoN system, the links are classified into two types: inter-modular links that represent the mutual dependencies between modules and intra-modular links that do not involve in the inter-modular dependencies. Denote and as the set of nodes connected to node via intra-modular and inter-modular links, respectively. Suppose the variable state of node is (inactive or active), and the external input to node is (no input or input). In the general activation model, the variable state is related to the input through . That is, the node is activated only if receives the input () and at least one of its neighbors connected with inter-modular links receives the input. In a robust brain network, for typical input configuration , the giant (largest) component of the active nodes with should be globally connected. Therefore, the robustness of the brain network can be characterized by the critical value of zero inputs such that . Here the input configuration is sampled from a flat distribution. Ideally, the robust NoN should have no disconnected phase, with a large value of close to 1.
To explain both robustness and inter-link functionality of brain networks, a robust NoN (R-NoN) model is proposed morone2017model . Define as the message running along an intra-modular link , as the message running along an inter-modular link . The information flow follows the self-consistent equations
| (8) | |||
| (9) |
The physical meaning of the above equations is easy to be interpreted. For instance, in Eq. (8), a positive message is transmitted from to in the same module if node is active and if it receives at least one positive message from either a node in the same module or a node in the other module . Notice that, the logical OR is important since it is the basis of the robustness of R-NoN. The final probability of node belonging to the largest active component is
| (10) |
The size of is therefore . In the R-NoN model, the system is robust since a node can be active even it does not belong to . This prevents catastrophic cascading effects in the catastrophic C-NoN model inspired by power grid failure buldyrev2010catastrophic . In the C-NoN model, a node remains functional only if it belongs to the giant component in both networks. This implies the status of a node in one network is interdependent on its status in the other network. The fundamental difference between C-NoN and R-NoN is that, in C-NoN model, the size of is computed through
| (11) |
So the logical OR in Eq. (10) is replaced by the logical AND in C-NoN. This stricter condition makes the system extremely sensitive to small perturbations. In synthetic NoN made of ER and SF random graphs, it is found the percolation threshold of R-NoN model is close to 1. On the contrary, the C-NoN model has threshold close to 0. This indicates that the two models indeed capture two different phenomena.
After exploring the behavior of R-NoN model under typical inputs, it is required to study the response to rare events targeting the influencers in the brain networks. Rare inputs targeting influencers may interrupt the global communication in the brain, which have been conjectured be responsible for certain neurological disorders. Or conversely, activating the influencers would optimally broadcast information to the entire network. Therefore, it is important to predict the location of the most influential nodes involved in information processing in the brain. To find the minimal fraction of nodes in the brain network whose removal would optimally fragment the giant component, the R-NoN model is mapped to the optimal percolation. The collective influence of nodes is calculated by minimizing the largest eigenvalue of the modified NB matrix. Particularly, the collective influence of node is given by
| (12) |
where . The first term is the node-centric contribution, which presents in the single network case of optimal percolation, while the second term is the node-eccentric contribution, which is a new feature of the brain NoN.
Applying the R-NoN model and collective influence theory to real brain networks, it is possible to obtain the collective influence map of brain NoN. The brain network is constructed from the functional magnetic resonance imaging (fMRI) data of the experiment of stimulus driven attention morone2017model ; gallos2012small ; gallos2007conundrum ; min2016finding . In the experiment, each subject performs a dual visual-auditory task when receiving a visual stimulus and an auditory pitch simultaneously. This experiment requires the deployment of high level control modules in the brain, thus captures the role of dependency inter-modular connections. In the obtained brain network (see Fig. 5a-b), it is observed that the system is robust with large threshold . While the minimal set of influencers only requires fraction of nodes (see Fig. 5c). Using the CI-map of the brain network, it is confirmed that control is deployed from the higher level module (Anterior cingulate) towards certain strategic locations in the lower ones (posterior parietal cortex, posterior occipital cortex). Moreover, the coarse-grain of the NoN to top CI nodes can predict the strategic areas in the brain.
4.3 Financial status in socioeconomic systems
It has long been recognized that the pattern of individuals’ social connection in society can affect people’s financial status granovetter1973strength . However, how to quantify the relationship between the location of an individual in social network and his/her economic wellness remains an open question. Despite that the effect of network diversity on economic development has been tested in the community level eagle2010network , inference of people’s financial status from social network centralities or metrics in individual level is still needed. The difficulty of such investigation comes from the lack of empirical data containing both individual’s financial information and pattern of social ties.
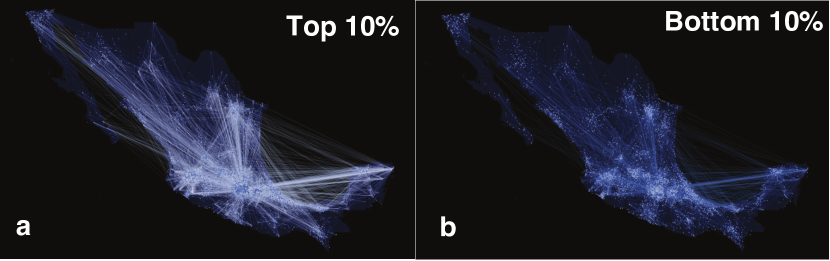
To find a reliable social network predictor of people’s financial status, a massively large social network of the mobile and residential communication in Mexico containing users together with financial banking data are analyzed luo2016inferring . With this dataset, it is possible to precisely cross-correlate the financial information of a person with his/her location in the communication network at the country level. Particularly, the financial status of individuals is reflected by their credit limit. In the analysis of the bank clients identified in the phone call network, the top and bottom individuals present completely different communication pattern (see Fig. 6). Richer people maintain more active and diverse links, some connecting to remote locations and forming tightly linked “rich clubs”.
To characterize the affluent people with network metrics, several centralities that are feasible for large-scale networks are compared, including degree, PageRank, k-core, and collective influence (CI). In the communication network, these four metrics are correlated. Therefore, they all show correlations with financial status when age is controlled. Among them, both k-core and CI capture the strong correlation with credit line with a value of 0.96 and 0.93, respectively. However, CI is more preferable since it satisfies both, a strong correlation and a high resolution. According to the definition of CI, top CI nodes are surrounded by hubs hierarchically. This is exactly the structure of ego-centric network of the top wealthy people.
The performance of predictions can be further enhanced by considering the factor of age. An age-network combined metric with can achieve a correlation with . Moreover, it is able to identify high credit individuals at the highest earner level. To validate the effectiveness, a real social marketing campaign was performed. Specifically, text messages inviting new credit card clients were sent to 656,944 people selected by their high CI values in the social network. Meanwhile, the same message was sent to a control group of 48,000 individuals selected randomly. The response rate, measured by the fraction of recipients who requested the product, is augmented by threefold in the top influencers identified by CI compared with the random control group.
The same analysis was also applied to individuals’ diversity of links eagle2010network . The diversity of an individual can be measured by the diversity ratio , i.e., the ratio of total communication events with people in other communities and within the same community . The correlation between DR and CI is weak so they should reflect different aspects of network structure. In comparison with financial data, the age-diversity composite () well correlates with people’s financial status. These evidences indicate that both CI and DR are effective predictors of people’s financial situation in an individual level. This finding has a great practical value in relevant applications, for instance, social marketing campaigns.
5 Acknowledgement
We acknowledge funding from NIH-NIBIB 1R01EB022720, NIH-NCI U54CA137788 / U54CA132378 and NSF-IIS 1515022.
References
- (1) Albert, R., Jeong, H., Barabási, A.L.: Error and attack tolerance of complex networks. Nature 406(6794), 378–382 (2000)
- (2) Altarelli, F., Braunstein, A., Dall’Asta, L., Wakeling, J.R., Zecchina, R.: Containing epidemic outbreaks by message-passing techniques. Phys. Rev. X 4(2), 021024 (2014)
- (3) Altarelli, F., Braunstein, A., Dall’Asta, L., Zecchina, R.: Large deviations of cascade processes on graphs. Phys. Rev. E 87(6), 062115 (2013)
- (4) Altarelli, F., Braunstein, A., Dall’Asta, L., Zecchina, R.: Optimizing spread dynamics on graphs by message passing. J. Stat. Mech: Theory and Exp. 2013(09), P09011 (2013)
- (5) Backstrom, L., Huttenlocher, D., Kleinberg, J., Lan, X.: Group formation in large social networks: membership, growth, and evolution. In: Proc.12th ACM SIGKDD Intl. Conf. on Knowledge Discovery and Data Mining, pp. 44–54. ACM (2006)
- (6) Bakshy, E., Hofman, J.M., Mason, W.A., Watts, D.J.: Everyone’s an influencer: quantifying influence on twitter. In: Proc. 4th ACM Intl. Conf. on Web Search and Data Mining, pp. 65–74. ACM (2011)
- (7) Batagelj, V., Zaversnik, M.: An o (m) algorithm for cores decomposition of networks. arXiv preprint cs/0310049 (2003)
- (8) Bau, S., Wormald, N.C., Zhou, S.: Decycling numbers of random regular graphs. Random Struct. Alg. 21(3-4), 397–413 (2002)
- (9) Baxter, G.J., Dorogovtsev, S.N., Goltsev, A.V., Mendes, J.F.: Bootstrap percolation on complex networks. Phys. Rev. E 82(1), 011103 (2010)
- (10) Bonacich, P.: Factoring and weighting approaches to status scores and clique identification. J. Math. Socio. 2(1), 113–120 (1972)
- (11) Borge-Holthoefer, J., Moreno, Y.: Absence of influential spreaders in rumor dynamics. Phys. Rev. E 85(2), 026116 (2012)
- (12) Braunstein, A., Dall’Asta, L., Semerjian, G., Zdeborová, L.: Network dismantling. Proc. Natl. Acad. Sci. U.S.A. 113(44), 12,368–12,373 (2016)
- (13) Brin, S., Page, L.: The anatomy of a large-scale hypertextual web search engine. Computer Networks and ISDN System 30(1), 107–117 (1998)
- (14) Buldyrev, S.V., Parshani, R., Paul, G., Stanley, H.E., Havlin, S.: Catastrophic cascade of failures in interdependent networks. Nature 464(7291), 1025–1028 (2010)
- (15) Bullmore, E., Sporns, O.: Complex brain networks: graph theoretical analysis of structural and functional systems. Nat. Rev. Neurosci. 10(3), 186–198 (2009)
- (16) Callaway, D.S., Newman, M.E., Strogatz, S.H., Watts, D.J.: Network robustness and fragility: Percolation on random graphs. Phys. Rev. Lett. 85(25), 5468 (2000)
- (17) Centola, D.: The spread of behavior in an online social network experiment. Science 329(5996), 1194–1197 (2010)
- (18) Cha, M., Haddadi, H., Benevenuto, F., Gummadi, P.K.: Measuring user influence in twitter: The million follower fallacy. Proc. 4th Intl. AAAI Conf. on Weblogs and Social Media 10(10-17), 30 (2010)
- (19) Chen, W., Wang, C., Wang, Y.: Scalable influence maximization for prevalent viral marketing in large-scale social networks. In: Proc. 16th ACM SIGKDD Intl. Conf. on Knowledge Discovery and Data Mining, pp. 1029–1038. ACM (2010)
- (20) Chen, W., Wang, Y., Yang, S.: Efficient influence maximization in social networks. In: Proc. 15th ACM SIGKDD Intl. Conf. on Knowledge Discovery and Data Mining, pp. 199–208. ACM (2009)
- (21) Clusella, P., Grassberger, P., Pérez-Reche, F.J., Politi, A.: Immunization and targeted destruction of networks using explosive percolation. Phys. Rev. Lett. 117(20), 208301 (2016)
- (22) Cohen, R., Erez, K., Ben-Avraham, D., Havlin, S.: Breakdown of the internet under intentional attack. Phys. Rev. Lett. 86(16), 3682 (2001)
- (23) Eagle, N., Macy, M., Claxton, R.: Network diversity and economic development. Science 328(5981), 1029–1031 (2010)
- (24) del Ferraro, G., Moreno, A., Min, B., Morone, F., Perez-Ramirez, U., Perez-Cervera, L., Parra, L., A, H., Canals, S., Makse, H.A.: Finding essential nodes for integration in the brain using network optimization theory (2017)
- (25) Freeman, L.C.: Centrality in social networks conceptual clarification. Soc. Netw. 1(3), 215–239 (1978)
- (26) Gallos, L.K., Makse, H.A., Sigman, M.: A small world of weak ties provides optimal global integration of self-similar modules in functional brain networks. Proc. Natl. Acad. Sci. U.S.A. 109(8), 2825–2830 (2012)
- (27) Gallos, L.K., Sigman, M., Makse, H.A.: The conundrum of functional brain networks: small-world efficiency or fractal modularity. Front. Psychol. 3, 123 (2007)
- (28) Gallos, L.K., Song, C., Makse, H.A.: Scaling of degree correlations and its influence on diffusion in scale-free networks. Phys. Rev. Lett. 100(24), 248,701 (2008)
- (29) Goltsev, A.V., Dorogovtsev, S.N., Mendes, J.F.F.: k-core (bootstrap) percolation on complex networks: Critical phenomena and nonlocal effects. Phys. Rev. E 73(5), 056101 (2006)
- (30) Goyal, A., Lu, W., Lakshmanan, L.V.: Celf++: optimizing the greedy algorithm for influence maximization in social networks. In: Proc. 20th Intl. Conf. World Wide Web, pp. 47–48. ACM (2011)
- (31) Goyal, A., Lu, W., Lakshmanan, L.V.: Simpath: An efficient algorithm for influence maximization under the linear threshold model. In: Data Mining (ICDM), 2011 IEEE 11th Intl. Conf. on, pp. 211–220. IEEE (2011)
- (32) Granovetter, M.S.: The strength of weak ties. Am. J. Sociol. 78(6), 1360–1380 (1973)
- (33) Guggiola, A., Semerjian, G.: Minimal contagious sets in random regular graphs. J. Stat. Phys. 158(2), 300–358 (2015)
- (34) Hashimoto, K.i.: Zeta functions of finite graphs and representations of p-adic groups. Adv. Stud. Pure Math. 15, 211–280 (1989)
- (35) Hethcote, H.W.: The mathematics of infectious diseases. SIAM Rev. 42(4), 599–653 (2000)
- (36) Hu, Y., Havlin, S., Makse, H.A.: Conditions for viral influence spreading through multiplex correlated social networks. Phys. Rev. X 4(2), 021,031 (2014)
- (37) Hu, Y., Ji, S., Feng, L., Havlin, S., Jin, Y.: Optimizing locally the spread of influence in large scale online social networks. arXiv preprint arXiv:1509.03484 (2015)
- (38) Karp, R.M.: Reducibility among combinatorial problems. In: Complexity of computer computations, pp. 85–103. Springer (1972)
- (39) Katz, L.: A new status index derived from sociometric analysis. Psychometrika 18(1), 39–43 (1953)
- (40) Kempe, D., Kleinberg, J., Tardos, É.: Maximizing the spread of influence through a social network. In: Proc. 9th ACM SIGKDD Intl. Conf. on Knowledge Discovery and Data Mining, pp. 137–146. ACM (2003)
- (41) Kitsak, M., Gallos, L.K., Havlin, S., Liljeros, F., Muchnik, L., Stanley, H.E., Makse, H.A.: Identification of influential spreaders in complex networks. Nat. Phys. 6(11), 888–893 (2010)
- (42) Kleinberg, J.: Cascading behavior in networks: Algorithmic and economic issues. Algorithmic game theory 24, 613–632 (2007)
- (43) Klemm, K., Serrano, M., Eguiluz, V.M., Miguel, M.S.: A measure of individual role in collective dynamics. Sci. Rep. 2, 292 (2012)
- (44) Kwak, H., Lee, C., Park, H., Moon, S.: What is twitter, a social network or a news media? In: Proc.19th ACM Intl. Conf. on World Wide Web, pp. 591–600. ACM (2010)
- (45) Lawyer, G.: Understanding the influence of all nodes in a network. Sci. Rep. 5, 8665 (2015)
- (46) Leskovec, J., Adamic, L.A., Huberman, B.A.: The dynamics of viral marketing. ACM Trans. Web 1(1), 5 (2007)
- (47) Leskovec, J., Krause, A., Guestrin, C., Faloutsos, C., VanBriesen, J., Glance, N.: Cost-effective outbreak detection in networks. In: Proc. 13th ACM SIGKDD Intl. Conf. on Knowledge Discovery and Data Mining, pp. 420–429. ACM (2007)
- (48) Li, W., Tang, S., Pei, S., Yan, S., Jiang, S., Teng, X., Zheng, Z.: The rumor diffusion process with emerging independent spreaders in complex networks. Physica A 397, 121–128 (2014)
- (49) Liben-Nowell, D., Kleinberg, J.: Tracing information flow on a global scale using internet chain-letter data. Proc. Natl. Acad. Sci. U.S.A. 105(12), 4633–4638 (2008)
- (50) Liu, Y., Tang, M., Zhou, T., Do, Y.: Core-like groups result in invalidation of identifying super-spreader by k-shell decomposition. Sci. Rep. 5, 9602 (2015)
- (51) Liu, Y., Tang, M., Zhou, T., Do, Y.: Improving the accuracy of the k-shell method by removing redundant links-from a perspective of spreading dynamics. Sci. Rep. 5, 13172 (2015)
- (52) Lü, L., Chen, D., Ren, X.L., Zhang, Q.M., Zhang, Y.C., Zhou, T.: Vital nodes identification in complex networks. Phys. Rep. 650, 1–63 (2016)
- (53) Lü, L., Zhang, Y.C., Yeung, C.H., Zhou, T.: Leaders in social networks, the delicious case. PLoS ONE 6(6), e21202 (2011)
- (54) Lü, L., Zhou, T., Zhang, Q.M., Stanley, H.E.: The h-index of a network node and its relation to degree and coreness. Nat. Comm. 7, 10168 (2016)
- (55) Luo, S., Morone, F., Sarraute, C., Makse, H.A.: Inferring personal financial status from social network location. Nat. Comm. 8, 15227 (2017)
- (56) Martin, T., Zhang, X., Newman, M.: Localization and centrality in networks. Phys. Rev. E 90(5), 052808 (2014)
- (57) Mézard, M., Parisi, G.: The cavity method at zero temperature. J. Stat. Phys. 111(1), 1–34 (2003)
- (58) Min, B., Liljeros, F., Makse, H.A.: Finding influential spreaders from human activity beyond network location. PLoS ONE 10(8), e0136831 (2015)
- (59) Min, B., Morone, F., Makse, H.A.: Searching for influencers in big-data complex networks. In: Diffusive Spreading in Nature, Technology and Society (Springer Verlag, Edited by A. Bunde, J. Caro, J. Karger, G. Vogl) (2016)
- (60) Mislove, A., Marcon, M., Gummadi, K.P., Druschel, P., Bhattacharjee, B.: Measurement and analysis of online social networks. In: Proc. 7th ACM SIGCOMM Conf. on Internet Measurement, pp. 29–42. ACM (2007)
- (61) Morone, F., Makse, H.A.: Influence maximization in complex networks through optimal percolation. Nature 524, 65–68 (2015)
- (62) Morone, F., Min, B., Bo, L., Mari, R., Makse, H.A.: Collective influence algorithm to find influencers via optimal percolation in massively large social media. Sci. Rep. 6, 30062 (2016)
- (63) Morone, F., Roth, K., Min, B., Stanley, H.E., Makse, H.A.: A model of brain activation predicts the neural collective influence map of the human brain. Proc. Natl. Acad. Sci. U.S.A. 114(15), 3849–3854 (2017)
- (64) Muchnik, L., Pei, S., Parra, L.C., Reis, S.D., Andrade Jr, J.S., Havlin, S., Makse, H.A.: Origins of power-law degree distribution in the heterogeneity of human activity in social networks. Sci. Rep. 3, 1783 (2013)
- (65) Mugisha, S., Zhou, H.J.: Identifying optimal targets of network attack by belief propagation. Phys. Rev. E 94(1), 012305 (2016)
- (66) Nemhauser, G.L., Wolsey, L.A., Fisher, M.L.: An analysis of approximations for maximizing submodular set functions—i. Math. Program. 14(1), 265–294 (1978)
- (67) Newman, M.E.: Spread of epidemic disease on networks. Phys. Rev. E 66(1), 016128 (2002)
- (68) Newman, M.E., Strogatz, S.H., Watts, D.J.: Random graphs with arbitrary degree distributions and their applications. Phys. Rev. E 64(2), 026118 (2001)
- (69) Pastor-Satorras, R., Vespignani, A.: Epidemic spreading in scale-free networks. Phys. Rev. Lett. 86(14), 3200 (2001)
- (70) Pastor-Satorras, R., Vespignani, A.: Immunization of complex networks. Phys. Rev. E 65(3), 036104 (2002)
- (71) Pei, S., Makse, H.A.: Spreading dynamics in complex networks. J. Stat. Mech: Theory Exp. 2013(12), P12002 (2013)
- (72) Pei, S., Muchnik, L., Andrade Jr, J.S., Zheng, Z., Makse, H.A.: Searching for superspreaders of information in real-world social media. Sci. Rep. 4, 5547 (2014)
- (73) Pei, S., Muchnik, L., Tang, S., Zheng, Z., Makse, H.A.: Exploring the complex pattern of information spreading in online blog communities. PLoS ONE 10(5), e0126894 (2015)
- (74) Pei, S., Tang, S., Zheng, Z.: Detecting the influence of spreading in social networks with excitable sensor networks. PLoS ONE 10(5), e0124,848 (2015)
- (75) Pei, S., Teng, X., Shaman, J., Morone, F., Makse, H.A.: Efficient collective influence maximization in threshold models of behavior cascading with first-order transitions. Sci. Rep. 7, 45240 (2017)
- (76) Radicchi, F., Castellano, C.: Leveraging percolation theory to single out influential spreaders in networks. Phys. Rev. E 93(6), 062314 (2016)
- (77) Ramos, M., Shao, J., Reis, S.D., Anteneodo, C., Andrade Jr, J.S., Havlin, S., Makse, H.A.: How does public opinion become extreme? Sci. Rep. 5, 10032 (2015)
- (78) Reis, S.D., Hu, Y., Babino, A., Andrade Jr, J.S., Canals, S., Sigman, M., Makse, H.A.: Avoiding catastrophic failure in correlated networks of networks. Nat. Phys. 10(10), 762–767 (2014)
- (79) Restrepo, J.G., Ott, E., Hunt, B.R.: Characterizing the dynamical importance of network nodes and links. Phys. Rev. Lett. 97(9), 094102 (2006)
- (80) Richardson, M., Domingos, P.: Mining knowledge-sharing sites for viral marketing. In: Proc. 8th ACM SIGKDD Intl. Conf. on Knowledge Discovery and Data Mining, pp. 61–70. ACM (2002)
- (81) Rogers, E.M.: Diffusion of innovations. Simon and Schuster (2010)
- (82) Roth, K., Morone, F., Min, B., Makse, H.A.: Emergence of robustness in networks of networks. Phys. Rev. E 95(6), 062,308 (2017)
- (83) Rybski, D., Buldyrev, S.V., Havlin, S., Liljeros, F., Makse, H.A.: Communication activity in a social network: relation between long-term correlations and inter-event clustering. Sci. Rep. 2, 560 (2012)
- (84) Sabidussi, G.: The centrality index of a graph. Psychometrika 31(4), 581–603 (1966)
- (85) Seidman, S.B.: Network structure and minimum degree. Soc. Netw. 5(3), 269–287 (1983)
- (86) Stauffer, D., Aharony, A.: Introduction to percolation theory. CRC press (1994)
- (87) Tang, S., Teng, X., Pei, S., Yan, S., Zheng, Z.: Identification of highly susceptible individuals in complex networks. Physica A 432, 363–372 (2015)
- (88) Teng, X., Pei, S., Morone, F., Makse, H.A.: Collective influence of multiple spreaders evaluated by tracing real information flow in large-scale social networks. Sci. Rep. 6, 36043 (2016)
- (89) Teng, X., Yan, S., Tang, S., Pei, S., Li, W., Zheng, Z.: Individual behavior and social wealth in the spatial public goods game. Physica A 402, 141–149 (2014)
- (90) Viswanath, B., Mislove, A., Cha, M., Gummadi, K.P.: On the evolution of user interaction in facebook. In: Proc. 2nd ACM Workshop on Online Social Networks, pp. 37–42. ACM (2009)
- (91) Watts, D.J.: A simple model of global cascades on random networks. Proc. Natl. Acad. Sci. U.S.A. 99(9), 5766–5771 (2002)
- (92) Watts, D.J., Dodds, P.S.: Influentials, networks, and public opinion formation. J. Cons. Res. 34(4), 441–458 (2007)
- (93) Yan, S., Tang, S., Fang, W., Pei, S., Zheng, Z.: Global and local targeted immunization in networks with community structure. J. Stat. Mech: Theory Exp. 2015(8), P08010 (2015)
- (94) Yan, S., Tang, S., Pei, S., Jiang, S., Zheng, Z.: Dynamical immunization strategy for seasonal epidemics. Phys. Rev. E 90(2), 022808 (2014)
- (95) Zeng, A., Zhang, C.J.: Ranking spreaders by decomposing complex networks. Phys. Lett. A 377(14), 1031–1035 (2013)