Polarisation of THz synchrotron radiation: from its measurement to control
Abstract
Polarisation analysis of synchrotron THz radiation was carried out with a standard stretched polyethylene polariser and revealed that the linearly polarised (horizontal) component contributes up to to the circular polarised synchrotron emission extracted by a gold-coated mirror with a horizontal slit inserted near a bending magnet edge. Comparison with theoretical predictions shows a qualitative match with dominance of the edge radiation. Grid polarisers 3D-printed out of commercial acrilic resin were tested for the polariser function and showed spectral regions where the dichroic ratio and implying importance of molecular and/or stress induced anisotropy. Metal-coated 3D-printed THz optical elements can find a range of applications in intensity and polarisation control of THz beams.
pacs:
polarisation, FT-IR, synchrotron, anisotropy of absorbance, 3D printingI Introduction
Methods of terahertz generation are evolving fast using ultra-short laser pulses, electrically driven 2D electron gas in semiconductor junctions, and photo-mixing, laser-driven electron plasmas to facilitate number of applications which require smaller and portable devices HuangO ; Carr ; Hafez ; Tian ; Shur ; Nanni ; 17apl202101 . The highest intensity THz sources are available at free electron laser and synchrotron facilities Tan ; Knyazev . With a high-brilliance synchrotron THz radiation it is possible to use imaging arrays and monitor in situ temporal evolution, e.g., of a phase transition in real time. Polarisation of synchrotron THz radiation becomes important in absorbance spectroscopy and for investigation of orientational anisotropy 17m356 ; 17sr-silk . Even for non-absorbing transparent materials at THz spectral range, a birefringence would cause polarisation changes due to a purely refractive phase delay which is important for interpretation of spectroscopical data. Synchrotron THz wavelengths are spanning wavenumber range 7-700 cm-1 (or 0.2 - 21 THz), which in terms of wavelengths are 1.43 mm - 14.3 m. With a widely accessible 3D printing technology reaching tens-of-micrometers resolution of plastic components, there is a potential to make optical elements for THz applications. Rough surfaces on m scale on 3D printed surfaces can be smoothed by controlled reflow using strongly absorbed UV post-illumination of the plastic workpieces Chidambaram and are reaching required sub-wavelength min-max roughness even for the visible-IR spectral range applications. Plastics have refractive index of at far-IR - to - THz spectral range with a variable absorbance, which has to be small for highly efficient optical elements Cunningham . Molecular ordering in polymers cause birefringence and an anisotropy of absorbance, which can be determined by the four polarisation method Hikima used in this study.
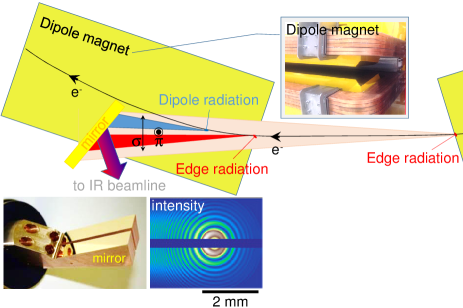
Polarisation of synchrotron THz radiation has a complex structure which has to be well understood when beam is focused (or imaged) onto the sample with spot sizes down to sub-1 mm from the first mirror where the beam has cross sections of cm. The synchrotron THz radiation is created by relativistic electrons traveling through a dipole magnet.
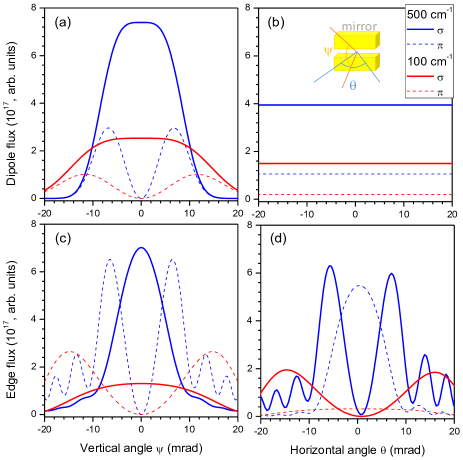
The observed radiation from a dipole magnet in the orbital plane of the electron is referred to as -polarisation mode radiation and is typically horizontally polarised. In the perpendicular plane with a non-zero vertical observation angle, , we have the -polarisation mode radiation and is typically vertically polarised. The combination of the and modes results in elliptically polarised radiation above and below the deflection plane of the electron beam (Fig. 1). The proportion of the integrated power of the mode to mode radiation is, and for typical dipole radiation Balerna .
The THz spectrum of the synchrotron radiation used by the far-IR branch of the IR beamline at the Australian Synchrotron (AS) has a horizontal acceptance of -14 mrad to +14 mrad and focuses on using the radiation created by the electron beam just as it exits and enters the magnetic field of the dipole magnet chubar1993generation ; chubar1993vuv . This is referred to as edge radiation. The spatial and wavelength dependent distribution of the linearly and elliptically polarised radiation is more complex at the edge than in the body of the dipole magnet Balerna ; chubar1995precise and is discussed in Sec. III.2.
In THz spectral range, it is possible to use linear polarisers to set polarisation at the sample with metallic grid or metallic gratings with high extinction ratio defined by transmission for the transverse magnetic and electric modes dB at 1 THz Yamada . This is achieved at the cost of a reduced intensity. By phase and polarisation control with 3D-printed optical elements with small absorption losses, it would be possible to create more efficient optical elements for polarisation control.
Here, we report results of a polarisation study of THz synchrotron radiation and characterisation of 3D-printed acrilic grid waveplate polarisers. Simulation of polarisation at the bending magnet edge is compared with experimental measurements at the sample location.
II Methods
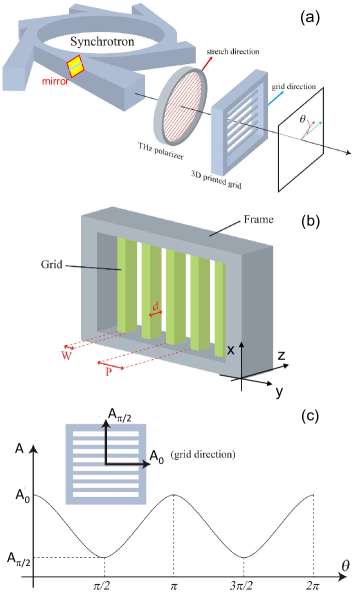
Polarisation analysis of synchrotron radiation was carried out at the IR Beamline on Australian Synchrotron, Melbourne Tan1 ; Einfeld with a standard linear stretched polyethylene (PE) polariser (Bruker No. F251; 45m-thick PE). Figure 2 shows schematics of experiments for polarisation analysis and absorbance anisotropy measurements of the 3D-printed micro-gratings.
II.1 3D-printed THz optical elements
Plastic gratings of varying aspect ratio (the depth-to-width) , duty cycle and period (see geometry in Fig. 2(b)) were fabricated using the Ember 3D printer (AutoDesk). The Ember printer possesses a 405 nm wavelength light emitting diode (LED) source and a Texas Instruments digital micro-mirror (DMD) projection system which facilitates the UV-curing of an entire m layer over a single exposure. The Ember 3D printer is capable of an xy-resolution of 50 m, and a z-resolution of 10-100 m. Gratings were set in a frame to allow them to be fixed to a polarisation filter mount. Grating width ranged between 100-200 m, period varied between 100-400 m, aspect ratio ranged from 1 to 4 and duty cycle was adjusted between 25%, 33% and 50%.
Commercially available MakerJuice G+ (red) and SF (green) resins were obtained from MakerJuice Labs, US. They are UV-curable acrylate-based resins with low viscosity and fast-curing capabilities. Also, a proprietary Ember resin (black) was used as supplied or was mixed from constituent ingredients, however, grids were less well developed due to a non-resolved parts of the unexposed segments.
Design files and stereo-lithography STL model files were generated using OpenSCAD (www.openscard.org), a parametric CAD program. A custom C# application was used to automatically generate a range of design files and STL model files within the design space. To print gratings with a large phase retardance or absorbance along propagation of the THz beam (z-axis; Fig. 2(b)), the printing sequence followed stacked exposures as samples are moved along the x-axis. Using Autodesk software, Print Studio, sample files were oriented perpendicular to the build-head to allow sequential stacking of model layers, “growing” the grating in a layer by layer mode as the build-head is rotated across the resin tray, and lifted step-wise after the exposure of each model layer. Gratings were printed in 25 m layers, with a 5 s exposure time for 4 burn-in layers, 8 s exposure for the first layer and 1.4 s exposure per each subsequent 25 m layer. The print speed of 25 m layers was 18 mm/h. The build head was optionally covered in Kapton tape to assist removal of the samples. 3D printed gratings were detached from the build head, then rinsed in a sequence of acetone, isopropanol and water to remove uncured resin.
For comparison of polariser performance, 3D-printed grids were coated with a 100 nm sputtered gold film. Such gratings can be considered having no transmission in the beam region for the light polarised along azimuth (a strong extinction due to reflection and absorption) and simulates performance of the gratings with .
II.2 Optical characterisation
The dichroic ratio is defined by the maximum-to-minimum absorbance ratio , where are absorbance values at two perpendicular orientation angles . The was determined for differently prepared 3D-printed grid polarisers; see, the plot is for the absorbance, , in Fig. 2(c). When material (pattern) has isotropic absorbance while the metallic grid polariser has as the E-field of light polarised along the metallic lines of the grid is absorbed while the absorbance is smaller. The case of would correspond to an anisotropy induced by a particular molecular alignment or internal stress in a grating-like pattern. The anisotropy of absorbance can be determined from the angular dependence of and only four angles with angular separation of are required to retrieve the fit as shown in Fig. 2(c) Hikima :
| (1) |
This method was recently used to determine anisotrophy of absorbance of silk at mid-IR spectral range 17sr-silk .
III Results and Discussion
III.1 Polarisation of synchrotron THz radiation
Synchrotron THz radiation is extracted from the edge of a dipole magnet using a mirror with a 3-mm-wide slit (Fig. 1(b)) to allow higher energy photons to pass through. The resulting elliptically polarised radiation can be separated into a circularly polarised (isotropic) component of the light field and a linear component aligned with the horizontal slit ( azimuth). Figure 1(b) shows intensity distribution of the synchrotron radiation beam taken to the IR beamline. A standard linear stretched polyethylene polariser was set into the beam at normal incidence and its orientation, , was changed by a motorized stage while measuring transmission (Fig. 1(b)).
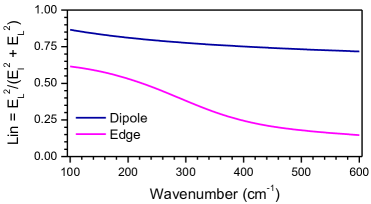
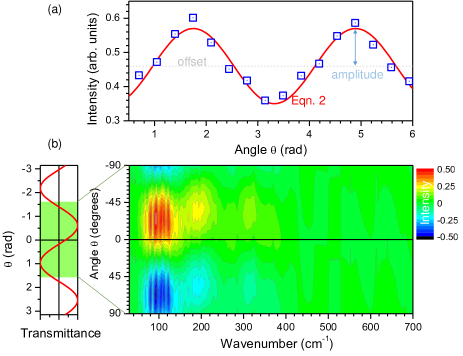
Figure 3(a) shows the angular dependence of transmission, measured with orientation steps and the best fit to the Malus law for the analysed case as shown below. For this case of horizontally polarised linear component () mixture with the isotropically (circularly) polarised field, , lets establish an orthogonal base with E-fields at two azimuths and , , respectively, for the output (transmitted) intensity :
| (2) |
where is the offset intensity and is the amplitude of the transmitted light (through the analyser). The best fit to dependence according to Eqn. 2 provides and values. By measuring angular dependence of the transmission spectrum, it is possible to present a map which shows spectrum in abscise and and orientation in the ordinate directions (Fig. 3(b)). It is revealed that the used polariser has a spectrally broadband action over the entire THz window (Fig. 3(b)).
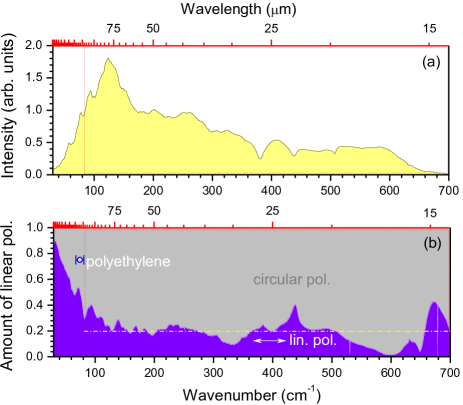
Exact portion of the linearly polarised light in the entire spectrum (Fig. 4(a)) is estimated by the factor:
| (3) |
which is plotted in Fig. 4(b) and obtained as the best fit to experimental data at fixed wavelength using and parameters. At the most intense THz spectral range it was close to 22%. The highest linearly polarised intensity is obtained at , horizontally with the first mirror slit.
III.2 Edge radiation
A diagram of the source of synchrotron radiation for the IR beamline is shown in Fig. 1. The spatial and spectral distribution of the synchrotron radiation from a dipole magnet is well understood and using the equations from ref. chao2013handbook the integrated flux of the and polarisations of radiation were simulated.
The dipole radiation is extracted with a rectangular mirror (30 54 460 mm; Fig. 1(b)) located 1.3 m downstream from the edge of the dipole magnet designed with an acceptance of 58 mrad in the horizontal plane (-14 mrad to +44 mrad) and 17 mrad vertically creagh2006design ; creagh2007infrared . Matching of numerical apertures of the radiation gathering optics along the entire beamline also plays an important role. The étendue, , is a measure of the flux gathering capability of the optical system, i.e., the collected power is the product of [m2sr] and the radiance of the source [W/m2/sr].
In Fig. 5 the comparison clearly highlights the complex nature of the edge radiation and is sensitive to the exact profile of the magnetic field at the edge of the dipole magnet. These simulations only account for the distribution of radiation from a single electron, while for exact simulation it would need to factor in the cross section of the electron beam () chubar1995precise . Using this single electron model and describing the elliptical radiation as a combination of linear and circular polarisations (as presented in Eqn. 3) Fig. 6 compares how the ratio of linear to circular polarisation changes as a function of wavenumbers for the dipole and edge radiation. A larger contribution of the horizontal linear polarisation at small wavenumbers is characteristic for both the dipole and edge radiation. The measured polarisation ratio at the sample location (Fig. 4(b)) shows a smaller portion of the linear polarisation due to the étendue, , and potentially reflects the unmatched numerical apertures for radiation collection. However, the same trend of larger contribution of linear (horizontal) polarisation at low wavenumbers ( cm-1) as theoretically predicted was experimentally observed.
III.3 3D printed polariser grids
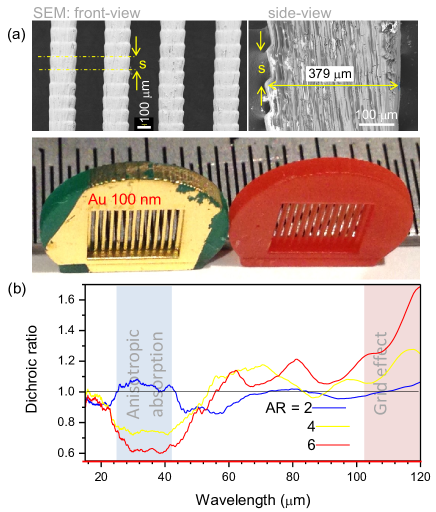
With the fully determined polarisation of the THz radiation, 3D-printed optical elements (Fig. 7(a)) were characterised using the same setup shown schematically in Fig. 2 for different duty cycle and aspect ratio acrylic elements. Figure 7(b) shows dependence of the dichroic ratio vs. wavelength. The was increasing for longer wavelengths as would be expected for a grid-type polariser where E-field component along the grid beams is absorbed stronger. This effect was not very strong since , however, the tendency is clearly recognisable and is more expressed for the higher aspect ratio grids (more absorbance). As the was increasing a tendency of emerged at specific 30-40 m wavelength region (Fig. 7(b)). Anisotropy in molecular alignment is an expected cause (can be linked to the stress in the printed grid). Similarly, the speed of silk formation is defining molecular alignment and mechanical strength of silk brins Shao ; Du ; Yoshioka . The optical birefringence and activity due to an orientational anisotropy is also linked to anisotropy of absorbance and is one of the consequences of the molecular alignment Chirgadze .
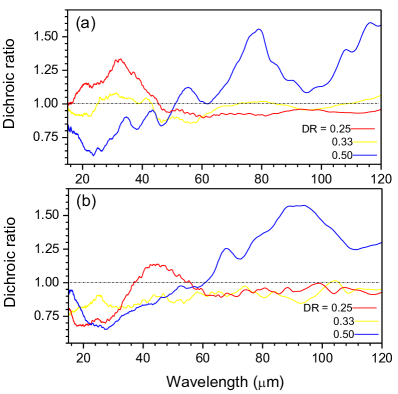
Usually, the optimum duty cycle for polarisation optics and phase retardance is at when sub-wavelength gratings are fabricated; here is birefringence. This directly follows from the effective medium theory (EMT) which shows that the smallest height structures required to effectively phase delay the beam have the minimal height. This usually corresponds to a desired fabrication condition. Since the EMT can not be used for the case discussed here with , the efficient phase control cannot be achieved. The dichroic ratio shown in Fig. 8 is close to corresponding to optically isotropic material for absorption. Only for the largest duty cycle an anisotropy begin to be apparent , again as wavelength is increased closer to the EMT range (Fig. 8(a)). By sputtering 100 nm of gold, the 3D-printed grating has to become more anisotropic since THz E-field component parallel to the grid beams should be absorbed in metal; this can be considered equivalent to an increase of the aspect ratio . However, the effect of was not strongly pronounced. This can be understood as being caused by .
Dichroic losses measured of a grating for two linearly polarised beam orientations provides an indirect measure whether material is suitable for fabrication of phase elements, optical retarders to control phase, polarisation, focusing, and orbital momentum. The achievable efficiency of an optical element, from the material point of view, is related to the smallest losses defined by the imaginary part of refractive index , which is linked to the retardance and dichroism by with ; the retardance and dichroism of the height optical element (e.g., grating) at wavevector for the wavelength governs the efficiency of the optical element. The amplitude of the E-field decreases exponentially with the hight, i.e., the intensity is given by the Lambert-Beer’s law , where is the absorption coefficient. Then, the amplitude, , of the -wave-form measured by the 4-polarisation method (Eqn. 1) is related to the dichroism as:
| (4) |
For efficient absorbance and retardance control, 3D printing technology has to deliver precision of structuring which begin to be accessible at THz spectral band. Here we showed that open grid structures with high aspect ratio can be fabricated at the desired , however, further decrease in the width of grating beam is required to obtain larger dichroic ratio . The printing method demonstrated here allows 3D printing of gratings with arbitrary depth, , of the structure.
IV Conclusions and outlook
Contributions of the linear and circular polarisation components in THz beamline spectrum have been determined using polarisation analysis of transmission.
3D-printed acrylic gratings with rod width of m period, duty cycle 0.5, and aspect ratio up to 8 were made out of standard acrylic resin. Low absorbance of 3D-printed structures is promising for fabrication of phase control elements (optical retarders) which would open new set of polarisation control of THz beams. The ability to rapidly produce a wide range of complex optical elements using 3D printing from various materials (including biocompatible materials) is a key benefit of 3D printers such as Ember that further enhance this possibility. Polariser-analyser setup will be required to further investigate optical retardance due to phase delay in addition to the absorbance investigated in this study.
Phase control using different approaches tested for visible and near-IR spectral ranges are transferrable to longer IR and THz frequencies. Usual phase control relies of defined thickness of material (the propagation phase) 10apl211108 , geometrical phase made by azimuthal patterning of orientation of the optical axis 17apl181101 , as well as using metamaterials with phase control by spectrally overlapping electric and magnetic dipoles in non-absorbing high-refractive index materials () Chong which allow to engineer polarisation, intensity, and orbital angular momentum of the light. The latter two concepts can be considered as flat optics and can be combined with intensity control by axicon or Fresnel lens demonstrated recently for THz wavelengths with performance matching theoretical efficiency Irmantas . 3D structuring of Si surface by fs-laser direct oxidation with subsequent plasma etching opens new possibilities in THz optics where Si is transparent Liu ; Sun .
Acknowledgements
Experiments were carried out via beamtime project No. 11615 at the Melbourne synchrotron on 8-11 March 2017. This work was performed in part at the Melbourne Centre for Nanofabrication (MCN) in the Victorian Node of the Australian National Fabrication Facility (ANFF). W.H. is supported by an Australian Government Research Training Program Scholarship. Partial support via NATO grant SPS-985048 “Nanostructures for Highly Efficient Infrared Detection” is acknowledged. E.S. and M.M. acknowledge financial support by the OPTIBIOFORM (S-LAT-17-2) project from the Research Council of Lithuania. J.M. acknowledges the support of JSPS KAKENHI Grant Number 16K06768. This work was supported in part by the Global University Project at Tokyo Institute of Technology.
References
- (1) W. R. Huang, A. Fallahi, X. Wu, H. Cankaya, A.-L. Calendron, K. Ravi, D. Zhang, E. A. Nanni, K.-H. Hong, and F. X. Kärtner, “Terahertz-driven, all-optical electron gun,” Optica 3(11), pp. 1209 – 1212, 2016.
- (2) G. L. Carr, M. C. Martin, W. R. McKinney, K. Jordan, G. R. Neil, and G. P. Williams, “High-power terahertz radiation from relativistic electrons,” Nature 420, pp. 153 – 156, 2002.
- (3) H. A. Hafez, X. Chai, A. Ibrahim, S. Mondal, D. Férachou, X. Ropagnol, and T. Ozaki, “Intense terahertz radiation and their applications,” J. Opt. 18, p. 093004, 2016.
- (4) Y. Tian, J. S. Liu, Y. F. Bai, S. Zhou, H. Y. Sun, W. W. Liu, J. Zhao, R. Li, and Z. Xu, “Femtosecond-laser-driven wire-guided helical undulator for intense terahertz radiation,” Nature Photonics 11, pp. 242 – 246, 2017.
- (5) M. Dyakonov and M. Shur, “Detection, mixing, and frequency multiplication of terahertz radiation by two-dimensional electronic fluid,” IEEE Transac. Electron Devices 43(3), pp. 380 – 387, 1996.
- (6) E. A. Nanni, W. R. Huang, K.-H. Hong, K. Ravi, A. Fallahi, G. Moriena, R. J. D. Miller, and F. X. Kärtner, “Terahertz-driven linear electron acceleration,” Nature Comm. 6, p. 8486, 2015.
- (7) V. Jakštas, I. Grigelionis, V. Janonis, G. Valušis, I. Kašalynas, G. Seniutinas, S. Juodkazis, P. Prystawko, and M. Leszczynski, “Electrically driven terahertz radiation of 2DEG plasmons in AlGaN/GaN structures at 110 K temperature,” Appl. Phys. Lett. 110(20), p. 202101, 2017.
- (8) P. Tan, J. Huang, K. F. Liu, Y. Q. Xiong, and M. W. Fan, “Terahertz radiation sources based on free electron lasers and their applications,” Sci. China Inform. Sci. 55(1), pp. 1 – 15, 2012.
- (9) B. A. Knyazev, G. N. Kulipanov, and N. A. Vinokurov, “Novosibirsk terahertz free electron laser: instrumentation development and experimental achievements,” Meas. Sci. Technol. 21, p. 054017, 2010.
- (10) A. Balčytis, M. Ryu, X. Wang, F. Novelli, G. Seniutinas, S. Du, X. Wang, J. Li, J. Davis, D. Appadoo, J. Morikawa, and S. Juodkazis, “Silk: Optical properties over 12.6 octaves THz-IR-Visible-UV range,” Materials 10(4), p. 356, 2017.
- (11) M. Ryu, A. Balčytis, X. Wang, J. Vongsvivut, Y. Hikima, J. Li, M. J. Tobin, S. Juodkazis, and J. Morikawa, “Orientational mapping augmented sub-wavelength hyper-spectral imaging of silk,” arXiv preprint , p. arXiv:1706.01302, 2017.
- (12) N. Chidambaram, R. Kirchner, R. Fallica, L. Yu, M. Altana, and H. Schift, “Selective surface smoothening of polymer microlenses by depth confined softening,” Adv. Mater. Technol. , p. 1700018, 2017.
- (13) P. D. Cunningham, N. N. Valdes, F. A. Vallejo, L. M. Hayden, B. Polishak, X.-H. Zhou, J. Luo, A. K.-Y. Jen, J. C. Williams, and R. J. Twieg, “Broadband terahertz characterization of the refractive index and absorption of some important polymeric and organic electro-optic materials,” J.Appl. Phys. 109, p. 043505, 2011.
- (14) Y. Hikima, J. Morikawa, and T. Hashimoto, “FT-IR image processing algorithms for in-plane orientation function and azimuth angle of uniaxially drawn polyethylene composite film,” Macromolecules 44(10), pp. 3950 – 3957, 2011.
- (15) A. Balerna and S. Mobilio, Introduction to Synchrotron Radiation, ch. 1, pp. 3 – 28. Springer, 2015.
- (16) O. Chubar and N. Smolyakov, “Generation of intensive long-wavelength edge radiation in high-energy electron storage rings,” in Particle Accelerator Conference, 1993., Proceedings of the 1993, pp. 1626–1628, IEEE, 1993.
- (17) O. Chubar and N. Smolyakov, “Vuv range edge radiation in electron storage rings,” J. Optics 24(3), p. 117, 1993.
- (18) O. Chubar, “Precise computation of electron-beam radiation in nonuniform magnetic fields as a tool for beam diagnostics,” Rev. Sci. Instr. 66(2), pp. 1872–1874, 1995.
- (19) I. Yamada, K. Takano, M. Hangyo, M. Saito, and W. Watanabe, “Terahertz wire-grid polarizers with micrometer-pitch Al gratings,” Opt. Lett. 34(3), pp. 274 – 276, 2009.
- (20) S. Sommer, T. Raidt, B. M. Fischer, F. Katzenberg, J. C. Tiller, and M. Koch, “THz-spectroscopy on high density polyethylene with different crystallinity,” J Infrared Milli Terahz Waves 37, pp. 189 – 197, 2016.
- (21) G. SLeBlanc, M. J. Boland, and Y. Tan, “The Australian synchrotron project storage ring and injection system overview,” in Proc. EPAC, pp. 2263 – 2265, 2004.
- (22) J. Boldeman and D. Einfeld, “The physics design of the Australian synchrotron storage ring,” Nuclear Instr. Methods Physics Res. Sec. A 521(2), pp. 306–317, 2004.
- (23) A. W. Chao, K. H. Mess, M. Tigner, and F. Zimmermann, Handbook of accelerator physics and engineering, 2013.
- (24) D. Creagh, J. McKinlay, and P. Dumas, “The design of the infrared beamline at the Australian synchrotron,” Vibr. Spectr. 41(2), pp. 213–220, 2006.
- (25) D. Creagh, M. Tobin, A. Broadbent, J. McKinlay, J.-Y. Choi, and S. Rah, “An infrared beamline at the australian synchrotron,” in AIP Conf. Proc., 879(1), pp. 615–618, AIP, 2007.
- (26) Z. Shao and F. Vollrath, “Surprising strength of silkworm silk,” Nature 418, p. 741, 2002.
- (27) N. Du, X. Y. Liu, J. Narayanan, L. Li, M. L. M. Lim, and D. Li, “Design of superior spider silk: From nanostructure to mechanical properties,” Biophysical J. 91, pp. 4528 – 4535, 2006.
- (28) T. Yoshioka, K. Tashiro, and N. Ohta, “Molecular orientation enhancement of silk by the hot-stretching-induced transition from a-helix-HFIP complex to -sheet,” Biomacromolecules 17(4), pp. 1437 – 1448, 2016.
- (29) Y. N. Chirgadze, S. Y. Venyaminov, and V. M. Lobachev, “Optical rotatory dispersion of polypeptides in the near-infrared region,” Biopolymers 10(5), pp. 809 – 820, 1971.
- (30) E. Brasselet, M. Malinauskas, A. Žukauskas, and S. Juodkazis, “Photo-polymerized microscopic vortex beam generators : precise delivery of optical orbital angular momentum,” Appl. Phys. Lett. 97, p. 211108, 2010.
- (31) X. Wang, A. A. Kuchmizhak, E. Brasselet, and S. Juodkazis, “Dielectric geometric phase optical elements fabricated by femtosecond direct laser writing in photoresists,” Appl. Phys. Lett. 110(18), p. 181101, 2017.
- (32) K. E. Chong, I. Staude, A. James, J. Dominguez, S. Liu, S. Campione, G. S. Subramania, T. S. Luk, M. Decker, D. N. Neshev, I. Brener, and Y. S. Kivshar, “Polarization- independent silicon metadevices for efficient optical wavefront control,” Nano Lett. 15(8), pp. 5369 – 5374, 2015.
- (33) L. Minkevičius, S. Indrišiunas, R. Šniaukas, B. Voisiat, V. Janonis, V. Tamošiunas, I. Kašalynas, G. Račiukaitis, and G. Valušis, “Terahertz multilevel phase Fresnel lenses fabricated by laser patterning of silicon,” Opt. Lett. 42(10), pp. 1875 – 1878, 2017.
- (34) X.-Q. Liu, L. Yu, Z.-C. Ma, and Q.-D. Chen, “Silicon three-dimensional structures fabricated by femtosecond laser modification with dry etching,” Appl. Opt. 56(8), p. 282887, 2017.
- (35) X.-Q. Liu, L. Yu, Q.-D. Chen, and H.-B. Sun, “Mask-free construction of three-dimensional silicon structures by dry etching assisted gray-scale femtosecond laser direct writing,” Appl. Phys. Lett. 110, p. 091602, 2017.