Exploring the nature and synchronicity of early cluster formation in the Large Magellanic Cloud: II. Relative ages and distances for six ancient globular clusters
Abstract
We analyze Hubble Space Telescope observations of six globular clusters in the Large Magellanic Cloud from program GO-14164 in Cycle 23. These are the deepest available observations of the LMC globular cluster population; their uniformity facilitates a precise comparison with globular clusters in the Milky Way. Measuring the magnitude of the main sequence turnoff point relative to template Galactic globular clusters allows the relative ages of the clusters to be determined with a mean precision of 8.4%, and down to 6% for individual objects. We find that the mean age of our LMC cluster ensemble is identical to the mean age of the oldest metal-poor clusters in the Milky Way halo to 0.2 0.4 Gyr. This provides the most sensitive test to date of the synchronicity of the earliest epoch of globular cluster formation in two independent galaxies. Horizontal branch magnitudes and subdwarf fitting to the main sequence allow us to determine distance estimates for each cluster, and examine their geometric distribution in the LMC. Using two different methods, we find an average distance to the LMC of 18.52 0.05.
keywords:
globular clusters: individual: NGC 1466 NGC 1841 NGC 2210 NGC 2257 Reticulum Hodge 11, Magellanic Clouds.1 Introduction
Globular clusters (GCs) have long been a crucial tool to understand star formation processes in the early Universe as well as the buildup of galactic halo populations. In recent years, high-precision photometry from the Hubble Space Telescope (HST) has facilitated accurate and consistent analyses of such clusters. In particular, the ACS Galactic Globular Cluster Treasury Program has provided a deep and uniform photometric database for a large sample of Galactic GCs. Its enduring contribution to the literature includes a wide range of studies of GC properties, such as mass functions, binary fractions, and horizontal branch morphology, among others (Dotter et al. 2010; Marín-Franch et al. 2009; Milone et al. 2012; Paust et al. 2010; Sarajedini et al. 2007; Wagner-Kaiser et al. 2017).
However, to fully untangle the nature and role of GCs in the formation and evolution of galaxies, it is necessary to look beyond the thoroughly-studied Galactic globular cluster (GGC) system. The population of old globular clusters in the Large Magellanic Cloud (LMC) provides the logical next step in expanding the sample of targets for which extremely high quality photometry can be obtained. We have recently obtained very deep, uniform HST observations of six ancient LMC clusters – NGC 1466, NGC 1841, NGC 2210, NGC 2257, Hodge 11, and Reticulum – resulting in photometry extending well down their main sequences for the first time (Mackey et al. 2017). We can now begin to explore with unprecedented precision how the timing of the earliest epoch of star cluster formation in the LMC compares to that in the Milky Way, and search for evidence of an age spread and/or a well-defined age-metallicity relationship (AMR) in the ancient LMC cluster system.
These goals are of particular significance because recent proper motion measurements have demonstrated that the Magellanic system is likely on its first passage about the Milky Way (e.g., Kallivayalil, van der Marel & Alcock 2006; Kallivayalil et al. 2013; Besla et al. 2007). The implication is that at the time of globular cluster formation the two galaxies were widely separated. Moreover, the large difference in halo mass and observed star-formation histories between the LMC and the Milky Way suggests that their internal environments are likely to have been substantially different from each other. Thus, examining the relative ages of the oldest GCs in the LMC and the Milky Way allows us to begin to quantitatively probe how the earliest epochs of star formation might vary as a function of location and environment.
The past several decades have seen a strong push to better understand the chronology of globular cluster formation in the LMC. Brocato et al. (1996) studied NGC 1786, NGC 1841 and NGC 2210 and determined ages to precision, concluding that metal-poor clusters in the LMC were coeval with those in the Milky Way to within Gyr. Six additional LMC clusters were studied by Olsen et al. (1998), who observed a similar consistency with GGC halo clusters in terms of age, metallicity, and HB morphology. Further work by Johnson et al. (1999) and Mackey & Gilmore (2004a); Mackey, Payne & Gilmore (2006) demonstrated that metal-poor clusters in the LMC and Milky Way are coeval within Gyr. In comparison, Harris et al. (1997) showed that the earliest GCs in the Galactic halo, out to a radius of some 100 kpc (well beyond the current distance of the LMC) were all formed within 1 Gyr.
In this paper we determine the ages of the six clusters in our LMC sample relative to metal-poor GCs in the Milky Way with substantially greater precision than any previous work. While absolute ages in principle allow us to place strong constraints on the age of the Universe, in practice such measurements are significantly less precise than relative age measurements due to persistent systematic uncertainties (e.g.: metallicity measurements, particular aspects of stellar evolution, foreground reddening, etc.) such that relative ages are preferred for this type of analysis. One key advantage that we exploit here is the availability of data from the Galactic Globular Cluster Treasury Program, obtained using the same telescope, camera and filters as our LMC observations, and to a comparable depth. By following closely the methodology developed by Marín-Franch et al. (2009), who explored the relative ages of clusters in the Treasury sample, we measure relative ages for our LMC clusters on the same scale and as free from biases and systematics as possible.
In addition to the above, we also use our new data to obtain a precise cluster-based distance estimate to the LMC. Because our photometry extends several magnitudes down the main sequence for each target, we are able to employ the method of sub-dwarf fitting utilising the high quality parallax measurements for several nearby main sequence stars determined by Chaboyer et al. (2017) (GO-11704 and GO-12320). We compare our distance measurements to those derived from the luminosity of the horizontal branch (HB) – a region of the colour-magnitude diagram observed with very high signal-to-noise () in our program.
Many studies over the past decade have demonstrated that globular clusters are, in general, not comprised of single stellar populations as once supposed. Instead, any given cluster appears to possess multiple stellar generations with a variety of different properties (e.g., Bedin et al. 2004; Milone et al. 2009; Gratton, Carretta & Bragaglia 2012; Milone et al. 2012; Piotto et al. 2015 for the Galactic clusters, Dalessandro et al. 2016; Niederhofer et al. 2017a, b for the Small Magellanic Cloud cluster NGC 121). Future work that incorporates observations from our HST program using WFC3 and the F336W filter will examine the multiple population properties of our six target LMC clusters. However, the existence of multiple populations does not significantly affect cluster color-magnitude diagrams (CMDs) constructed using broadband optical filters such as F606W and F814W (except in extreme cases, such as Centauri, Bedin et al. 2004), as the main effects of multiple populations are concentrated in the blue-uv part of the spectrum (e.g. Sbordone et al. 2011). Thus, approximating both our LMC targets and the reference Galactic GCs as single populations for the present analysis is a valid approach.
This paper is arranged as follows. In Section 2, we discuss the dataset and the relevant photometry. We analyze the clusters to derive their relative ages in Section 3 and determine distances via subdwarf and HB fitting in Section 4. Section 5 lists our conclusions.
2 Data
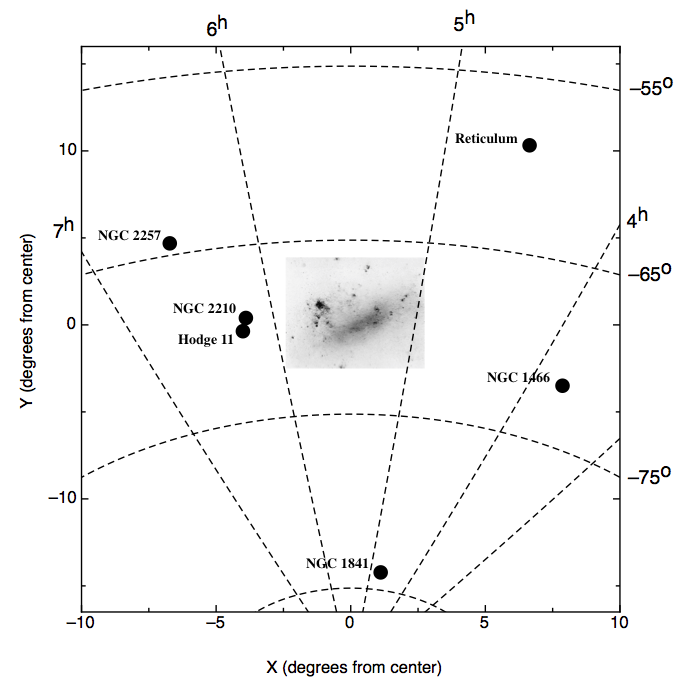
The data for our analysis come from HST Cycle 23 program GO-14164 (PI: Sarajedini). Deep imaging was obtained for six ancient LMC globular clusters – NGC 1466, NGC 1841, NGC 2210, NGC 2257, Hodge 11, and Reticulum – through the F606W and F814W filters with the Advanced Camera for Surveys (ACS) Wide Field Channel (WFC), and through the F336W filter with the Wide Field Camera 3 (WFC3) Ultraviolet and Visual (UVIS) channel. In this paper we will consider only the F606W and F814W data. These six clusters were chosen as they comprise the complete sample of LMC globular clusters outside the confusion-limited crowded stellar fields of the LMC bar region, as well as spanning a range of galactocentric radius, luminosity, and structure. The locations of the clusters relative to the LMC are shown in Figure 1.
Full details of the data acquisition and photometric analysis can be found in Mackey et al. (2017); here we provide a brief description for completeness. Each cluster was observed for two orbits in the F606W filter resulting in either 13 or 14 images (depending on the visibility of the target), and for three orbits in the F814W filter resulting in either 19 or 20 images. Of these image sets, two each per filter per cluster were short exposures (s per frame) while the remainder were much longer (s per frame). We used the dolphot software package (e.g., Dolphin, 2000) to photometer the images, performing one run on the long exposures and one on the short exposures, and then merging the two quality-filtered output catalogues. To ensure that our photometry was minimally affected by imperfect charge transfer efficiency (CTE) in the ACS/WFC chips, we utilised the images from the calacs pipeline corrected using the pixel-based algorithm of Anderson & Bedin (2010). Our final measurements are on the calibrated VEGAmag scale of Sirianni et al. (2005). For each cluster the photometry reaches from the top of the red-giant branch (RGB) to more than magnitudes below the main sequence turn off point (MSTOP). The signal-to-noise ratio around the HB level is , the MSTOP is typically per star, and remains at at least four magnitudes fainter than the MSTOP.
For the LMC clusters analyzed herein, we adopt metallicities as summarized in Table 1. The metallicity measurements are largely from high-resolution spectroscopic observations of these clusters, with the exception of NGC 1466. NGC 1466 has a photometric metallicity derived from RR Lyrae observations, and at present lacks spectroscopic measurements except for a handful of individual stars. Column 2 notes the metallicities from the cited references in column 3, which are provided in the metallicity scale noted in column 4. In order to adopt a consistent metallicity scale throughout this work, these [Fe/H] measurements are converted to the CG97 (Carretta & Gratton 1997) metallicity scale, with the result provided in the final column of Table 1; use of the CG97 metallicity scale provides consistency with the Marín-Franch et al. (2009) study. The errors in the transformed metallicities include an assumed 0.2 dex measurement uncertainty as well as the propagated uncertainties of the transformation equations (Carretta & Gratton 1997; Carretta et al. 2009).
[b] Cluster [Fe/H]ref Reference Original Scale [Fe/H]CG97 NGC 1466 -1.9* Walker (1992b) ZW84 -1.70 0.50 NGC 1841 -2.02 Grocholski et al. (2006) CG97 -2.02 0.20 NGC 2210 -1.65 Mucciarelli, Origlia & Ferraro (2010) C09 -1.45 0.20 NGC 2257 -1.95 Mucciarelli, Origlia & Ferraro (2010) C09 -1.71 0.20 Hodge11 -2.00 Mateluna et al. (2012) C09 -1.76 0.20 Reticulum -1.57 Grocholski et al. (2006) CG97 -1.57 0.20
-
•
∗ Measurement only given to one decimal precision by Walker (1992b). The propagation of error from the conversion of the measurement from the ZW84 scale to the CG97 scale leads to what a generous uncertainty in metallicity.
3 Relative Ages
To determine relative ages for the LMC clusters, we follow closely the procedure developed by Marín-Franch et al. (2009) for their study of Galactic globular cluster relative ages. By measuring differences in the MSTOP apparent magnitude with respect to reference clusters, anchoring the apparent magnitudes to a distance scale, and comparing to expectations from theory, we determine precise relative ages for the LMC clusters. The details of our methodology are are outlined below. Throughout this process, we adopt the CG97 metallicity scale as discussed in Section 2; the CG97 scale is also used in Marín-Franch et al. (2009).
A mean ridge line (MRL) is derived to represent the fiducial line for each cluster. As in Marín-Franch et al. (2009), we determine mean ridge lines for the F606WF814W, F814W CMD because the sub-giant branch is more vertical and the results are improved with respect to using F606W as the magnitude. However, in the rest of the analysis, the F606WF814W, F606W CMD is used to derive the MSTOP in F606W magnitude (Marín-Franch et al. 2009). To determine the MRL, we use a moving bin in magnitude with a size of 0.5 mag and steps of 0.02 magnitude. The MRL location is determined from the average of each bin, rejecting 3- outliers to determine a MRL. We repeat this MRL-derivation process, shifting the bin locations each time, to lessen dependence of the result on the bin centers. Over five iterations, the derived MRLs are combined; a smoothed radial basis function is used to represent the final fiducial line.
The magnitude of the MSTOP is found by taking the bluest point of a spline fit locally to the MRL in the MSTOP region. The MSTOP location is re-determined ten times, each time offsetting the MRL bins by 0.01 mag; the adopted MSTOP magnitude for the cluster is calculated as the mean of these ten determinations of the bluest point of the spline. Through this process, we determine apparent magnitudes in F606W of the MSTOP for the six LMC clusters, provided in the fourth column of Table 2.
Because this is a relative analysis, the MSTOPs of the LMC clusters need to be compared to reference MSTOP locations. Two particular regions along the fiducial lines were designated by Marín-Franch et al. (2009) to be minimally affected by age; specifically, on the main sequence (M+3 m M+1.5) and on the red giant branch (M-2.5 m M-1.5). Because these RGB and MS regions are largely unaffected by age, a comparison of MSTOP magnitude between the reference and MRL gives an indication of the relative age of two clusters. The MRL of these two locations are used to “shift” the entire MRL of a reference cluster in color and magnitude to match the same regions in each LMC cluster. In doing so, any differences in line of sight reddening between the clusters are automatically accounted for, making the age determinations free of assumptions of distance or reddening. By using the GGC clusters as reference clusters, we thus determine the differences in MSTOP magnitudes with respect to the LMC clusters.
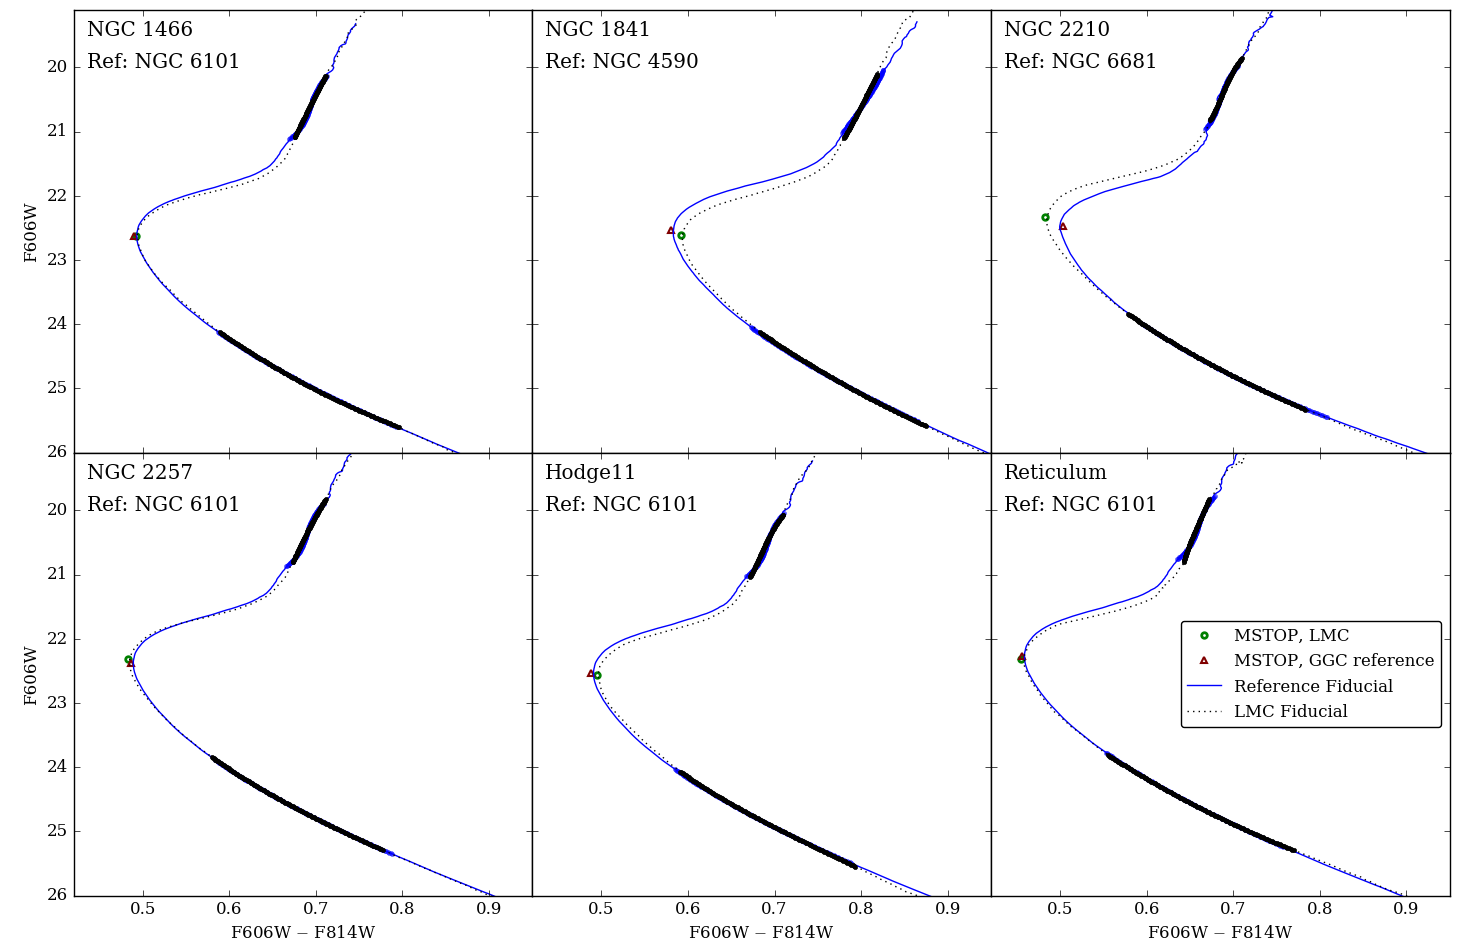
We use the same GGC reference clusters as Marin-Franch et al. (2009) across the following metallicity ranges: NGC 6981 (–1.3 [Fe/H] –1.1), NGC 6681 (–1.5 [Fe/H] –1.3), NGC 6101 (–1.8 [Fe/H] –1.5), and NGC 4590 (–2.3 [Fe/H] –1.8). We use a least squares approach to minimize offsets between the MRL of the reference clusters and the LMC clusters in the intervals defined by Marín-Franch et al. (2009) and described above. The result of this process is demonstrated in Figure 2, where each LMC cluster (black dotted lines) is compared to the relevant GGC reference (blue solid lines). The fiducials of the GGC reference clusters are shifted to match the LMC clusters in the regions of the CMD discussed above; these regions are also highlighted in Figure 2. The MSTOP for the LMC (green) and reference Galactic cluster (maroon) are also indicated in the plot. While the fiducials for the LMC clusters are largely consistent with their GGC reference cluster counterpart, we note that there is a slight mismatch between the NGC 1841 and NGC 4590 fiducials on the upper red giant branch. This does not appear to be driven by our approach but may be due to differing metallicities or [/Fe] abundances between the two clusters.
As in Marín-Franch et al. (2009), shifts among the set of GGC reference clusters are determined by matching MRL for the reference clusters in adjacent metallicity ranges. The absolute MSTOP magnitude in F606W for NGC 6752 of 3.87 0.15 for calibration is adopted, as are comparable uncertainties arising from the methodology, to be consistent with Marín-Franch et al. (2009). This allows us to obtain the absolute magnitude of the MSTOP, given in the fifth column of Table 2. As the uncertainty in the distance of NGC 6752 affects the absolute age scale rather than the relative age scale, we do not include this in our error budget. In re-deriving cluster ages from Marín-Franch et al. (2009) for clusters with [Fe/H] –1.5, we find a minimal mean offset of the MSTOP magnitudes of 0.01 0.03; this is incorporated into our cited errors.
[b] Cluster [Fe/H]CG97a Ref. Clusterb m M Relative Age (Gyr) Absolute Age (Gyr) NGC 1466 -1.70 NGC 6101 22.62 0.02 3.75 0.18 12.18 13.38 NGC 1841 -2.02 NGC 4590 22.61 0.02 3.64 0.17 12.57 13.77 NGC 2210 -1.45 NGC 6681 22.34 0.02 3.70 0.18 10.43 11.63 NGC 2257 -1.71 NGC 6101 22.32 0.01 3.69 0.18 11.54 12.74 Hodge11 -1.76 NGC 6101 22.56 0.01 3.78 0.17 12.72 13.92 Reticulum -1.57 NGC 6101 22.31 0.01 3.79 0.17 11.89 13.09
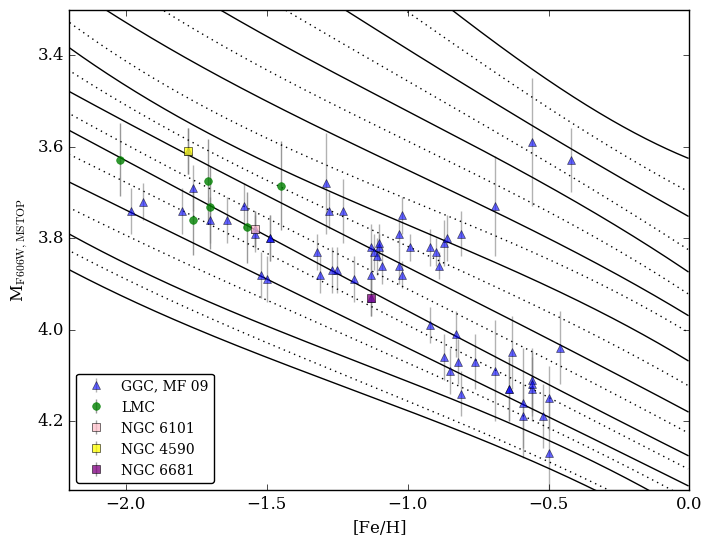
We plot the MSTOP magnitude estimates for the six LMC clusters alongside the GGC MSTOP magnitudes from Marín-Franch et al. (2009) in Figure 3. From a grid of DSED isochrones at 0.1 dex metallicity intervals, the smoothed, diagonal lines in this figure indicate MSTOP locations for isochrones ranging in age from 6 Gyr (upper right) to 15 Gyr (lower left) in steps of 0.5 Gyr. For clarity, we alternate between solid and dashed lines. Additionally, the LMC clusters show enhancement in [/Fe] comparable to the enhancement seen in the Galactic globular clusters (Mucciarelli, Origlia & Ferraro 2010). The grid in Figure 3 is generated assuming an -enhanced model ([/Fe] = 0.2). The grid of Dotter et al. (2008) DSED isochrones are used to derive MSTOP in the same iterative process as described above - fitting a spline locally to the MSTOP and determining the bluest point. This facilitates a comparison between the calibrated MSTOP magnitudes from the observed clusters to the theoretical models to determine ages. We interpolate between the models to determine ages for the six LMC clusters, presented in Table 2.
The relative ages we derive are consistent with the LMC clusters having similar properties to the old, inner halo Milky Way clusters. However, we note that the metallicities of the LMC clusters are not fully agreed upon in the literature; if our adopted metallicities are inaccurate then our conclusions on the relative ages of these clusters may need re-examination. We estimate a change of 0.1 dex in metallicity leads to a change of up to 0.4 Gyr in relative age. Nevertheless, our relative age determinations are a significant improvement on more uncertain age estimates from previous studies of these clusters (Brocato et al. 1996; Olsen et al. 1998; Piatti et al. 2009; Jeon et al. 2014). Through our analysis, relative ages are determined with precision between 6% (Hodge 11) and 10% (NGC 2210), with a mean precision across the sample of 8.4%.
With our substantial improvement in LMC cluster age measurements over previous studies, we can re-examine the coevality of globular cluster formation in the MWG and the LMC - two galaxies that are thought to have been widely separated at the epoch of cluster formation (Kallivayalil, van der Marel & Alcock 2006; Kallivayalil et al. 2013), and which thus present independent and very different formation environments, as the MWG is a more massive and metal-rich galaxy than the LMC. Previous work has indicated that early cluster formation in the Milky Way and LMC was broadly concurrent within 1.5 to 2 Gyr (Johnson et al. 1999; Olsen et al. 1998; Brocato et al. 1996; Mackey & Gilmore 2004b).
We propagate the individual errors of the relative age estimates from Table 2 and find an average age for the LMC clusters of 11.8 0.4 Gyr (0.8 Gyr stddev). For the Galactic clusters in a similar metallicity range ([Fe/H] –1.5), the mean age is 12.0 0.2 Gyr (0.6 Gyr stddev). Consequently, this suggests the two sets of metal-poor old clusters are coeval within 0.2 0.4 Gyr (1.0 Gyr stddev). As the best test of the synchronicity of globular cluster formation in two completely unrelated galaxies so far, we find clear evidence that the first epoch of GC formation occurred essentially simultaneously in these two completely different galactic environments.
The metal-poor Sagittarius clusters have been found to also be very similar to those in our Galaxy (Mackey & Gilmore 2004a; Marín-Franch et al. 2009). Terzan 8 is the one cluster in the Sagittarius dwarf galaxy that is more metal-poor than -1.5 on the CG97 scale. Marín-Franch et al. (2009) find the age of this cluster to be within 0.5 +/- 0.5 Gyr of the mean value we quote above. However, this trend does not necessarily seem to be consistent in the Small Magellanic Cloud (SMC). While NGC 121 is the only “old” cluster in the SMC, the majority of recent work suggests it is younger than the oldest Galactic clusters despite having similar metallicity; estimates put the age in the range of 10.5 to 11.8 Gyr, depending on study and model choice (Glatt et al. 2008; Dolphin et al. 2001; Mighell, Sarajedini & French 1998). However, NGC 121 has not been measured on the same relative age scale we use herein and a direct comparison is incomplete in this respect. Although the MWG, LMC, and Sagittarius appear to have closely synchronous initial metal-poor GC formation, the example of the SMC indicates that this may not be universal.
The ages derived here are relative ages, not absolute ages. To compare ages directly with previous studies, a reference absolute age must be adopted. From the absolute ages of O’Malley, Gilligan & Chaboyer (2017), we use the mean absolute age of the GGC reference clusters to calibrate our LMC relative ages to absolute ages. Specifically, O’Malley, Gilligan & Chaboyer (2017) found ages of 12.41.3 Gyr for NGC 4590, 13.41.5 Gyr for NGC 6101, and 12.51.7 Gyr for NGC 6681 and we adopt a mean age of 12.80.9 Gyr (note that this is the same absolute age adopted by Marín-Franch et al. 2009 as well). This absolute age is compared to the mean relative ages of these same clusters (11.6 Gyr); the LMC clusters’ relative ages are adjusted according to the difference of 1.2 Gyr. These values are listed in the final column of Table 2 and include the uncertainty of 0.15 mag in the absolute magnitude of the MSTOP for NGC 6752, the zeropoint cluster.
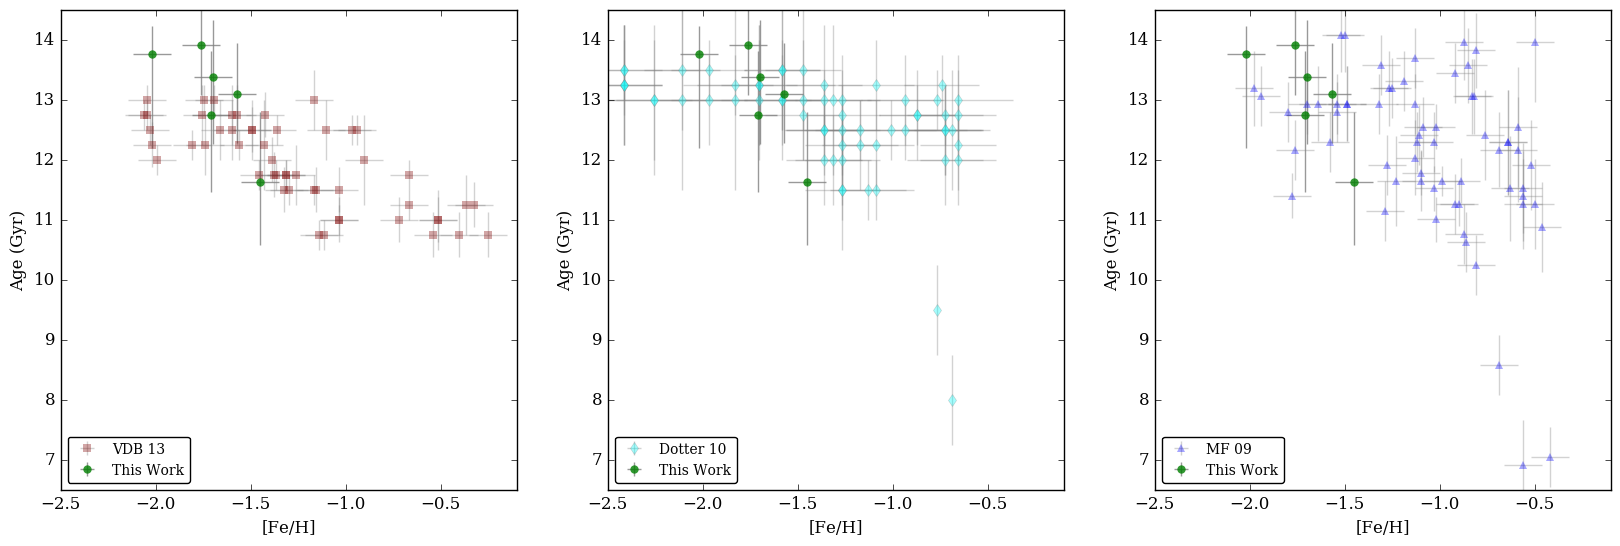
Using these absolute ages, the age-metallicity relation (AMR) is reconstructed in Figure 4 using ages of the Galactic clusters from VandenBerg et al. (2013) (left), Dotter et al. (2010) (middle), and Marín-Franch et al. (2009) (right, assuming reference age of 12.8 Gyr). The LMC clusters are plotted for comparison (green circles). Our results may be compared directly to Marín-Franch et al. (2009). With respect to VandenBerg et al. (2013) and Dotter et al. (2010), the comparisons are qualitative, as different methods and age calibrations may lead to vertical offsets in Figure 4.
As in Figure 3, the LMC clusters appear to more closely mimic the old, metal-poor inner halo Galactic clusters. NGC 2210 could plausibly be younger than the other LMC clusters, although this is not a statistically significant deviation. Nonetheless, from inspection of the AMR, it is possible that NGC 2210 may be more similar to Galactic clusters belonging to the younger branch of the AMR (the outer halo; presumably accreted clusters) than the older branch (the inner halo; likely in-situ clusters). Although there is not sufficient evidence here to make a strong conclusion, it is certainly of interest to pursue in future work in order to better understand the formation history of the LMC and its globular cluster system.
4 Distances
4.1 Horizontal Branch
To obtain distance estimates from observations of the horizontal branch (HB), fiducials of the HBs are created for the LMC clusters and compared to several reference GGC clusters. We initially estimate the cluster HB fiducial by eye and fit a cubic spline to the points. To iterate on this and obtain a better estimate, the HB is binned in intervals of color of 0.04 along the initial spline, overlapping by 0.01. In each color bin, using stars within a 3- range of the initial spline, we determine the average magnitude of the HB in that bin. These results are used to redetermine the HB with a cubic spline, as seen by the solid blue line in Figure 5 for each LMC cluster, where the included HB stars are indicated (cyan points). We note that while blue straggler stars or field stars may contaminate the included HB stars, their low frequency is unlikely to skew the estimated HB fiducials.
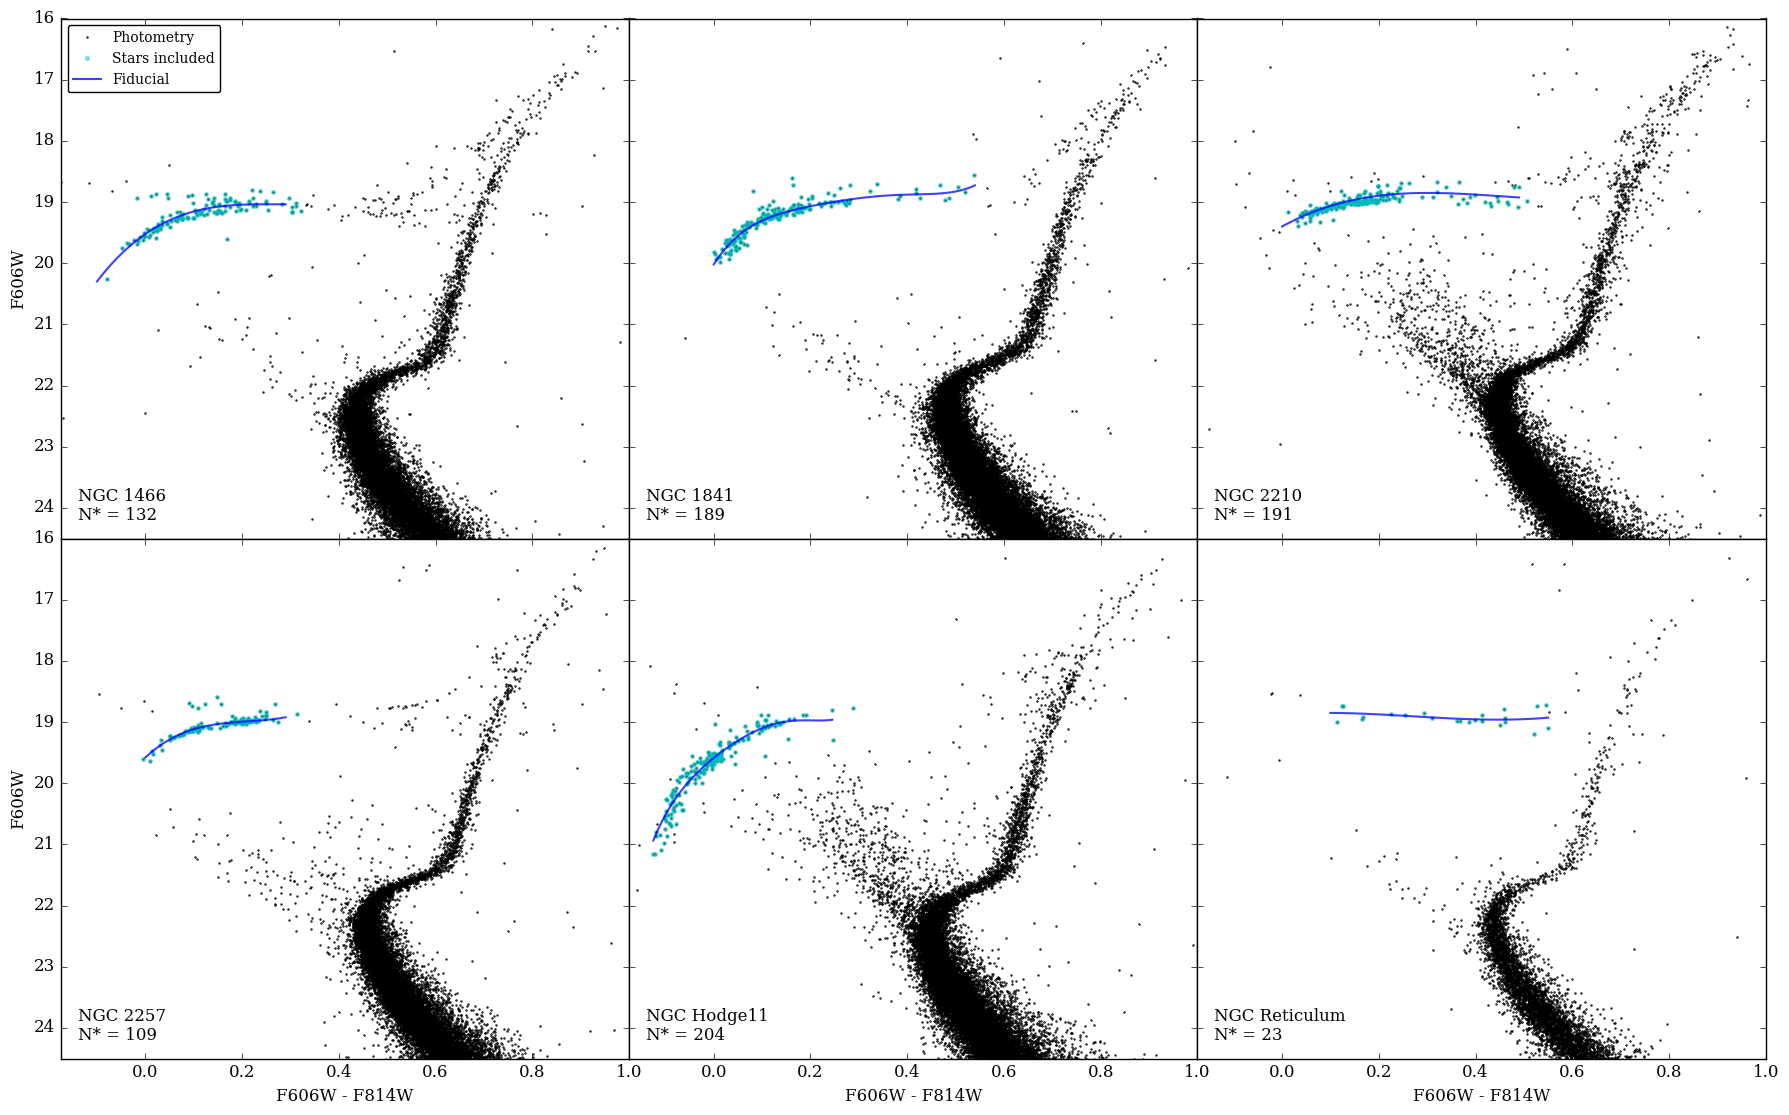
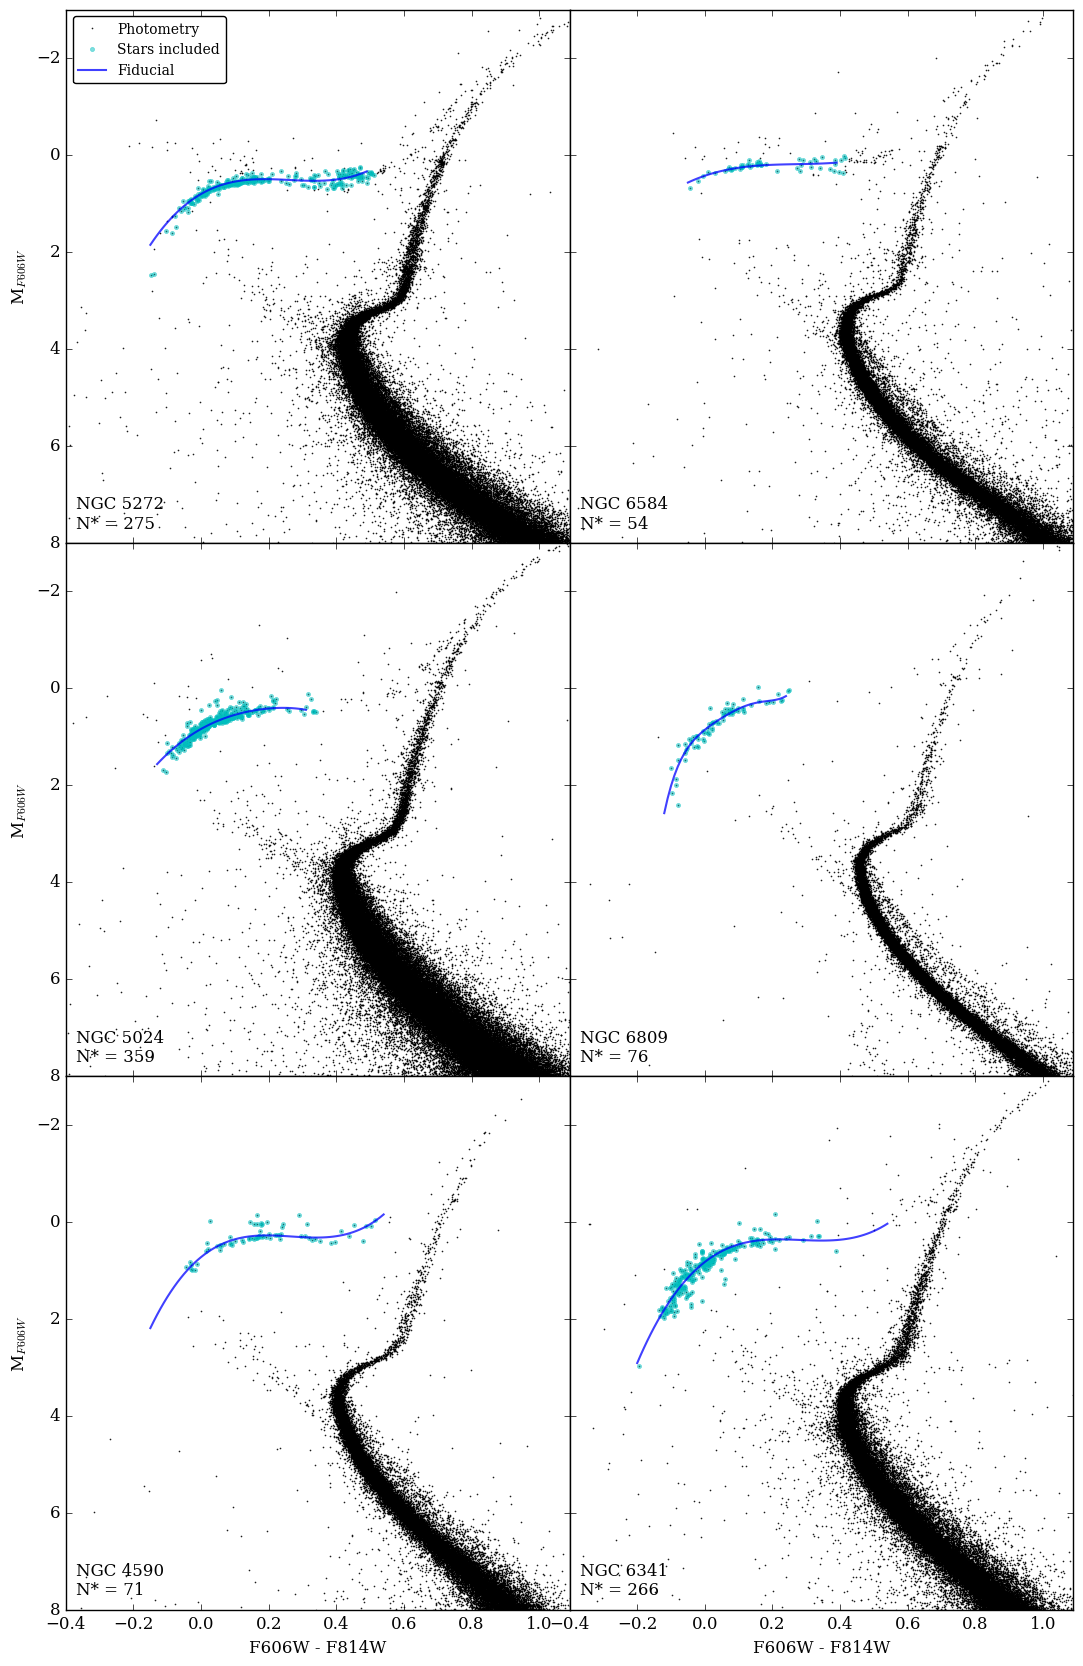
This process is repeated for six GGC reference clusters to serve as comparisons to the HB fiducials of the LMC clusters. These Galactic clusters are chosen to (i) have low reddening, (ii) have a populated HB, (iii) have available photometry in the same HST filters from Sarajedini et al. (2007). Using the same method described above, we derive HB fiducials for two moderately metal-rich Galactic clusters (NGC 5272, NGC 6584), two intermediate metallicity clusters (NGC 5024, NGC 6809), and two metal-poor clusters (NGC 4590, NGC 6341). We adopt the foreground reddenings and distance moduli from the Harris (2010) catalogue***http://physwww.mcmaster.ca/~harris/mwgc.dat for these reference clusters; these values are listed in Table LABEL:tab:GGCref. We note that Harris (2010) derive their distances from the assumption that MV(HB) = 0.16 [Fe/H] + 0.84 and their E(B–V) from an average of several measurements; we assume a reddening law of RV=3.1 (Cardelli, Clayton & Mathis 1989). Additionally, the Harris (2010) catalogue metallicities are on the C09 scale; for consistency (as in Section 2) we convert these to the CG97 scale, and these values are listed in Table LABEL:tab:GGCref.
| Cluster | [Fe/H]CG97 | E(B–V) | Distance Modulus |
|---|---|---|---|
| NGC 5272 | -1.32 0.19 | 0.01 | 15.07 |
| NGC 6584 | -1.32 0.20 | 0.10 | 15.96 |
| NGC 5024 | -1.84 0.20 | 0.02 | 16.32 |
| NGC 6809 | -1.70 0.20 | 0.08 | 13.89 |
| NGC 4590 | -1.96 0.20 | 0.05 | 15.21 |
| NGC 6341 | -2.03 0.21 | 0.02 | 14.65 |
In order to obtain distance measurements, we assume reddenings for the LMC clusters from Walker (1992, 1993), as indicated in Table LABEL:tab:zahb_dists. While an assumption of reddening is necessary to derive distances, the accuracy of the adopted reddening values could plausibly affect our distance estimates. However, the reddening estimates we adopt are found to differ on average from the foreground reddening estimates of Schlegel, Finkbeiner & Davis (1998) and Schlafly & Finkbeiner (2011) by 0.006.
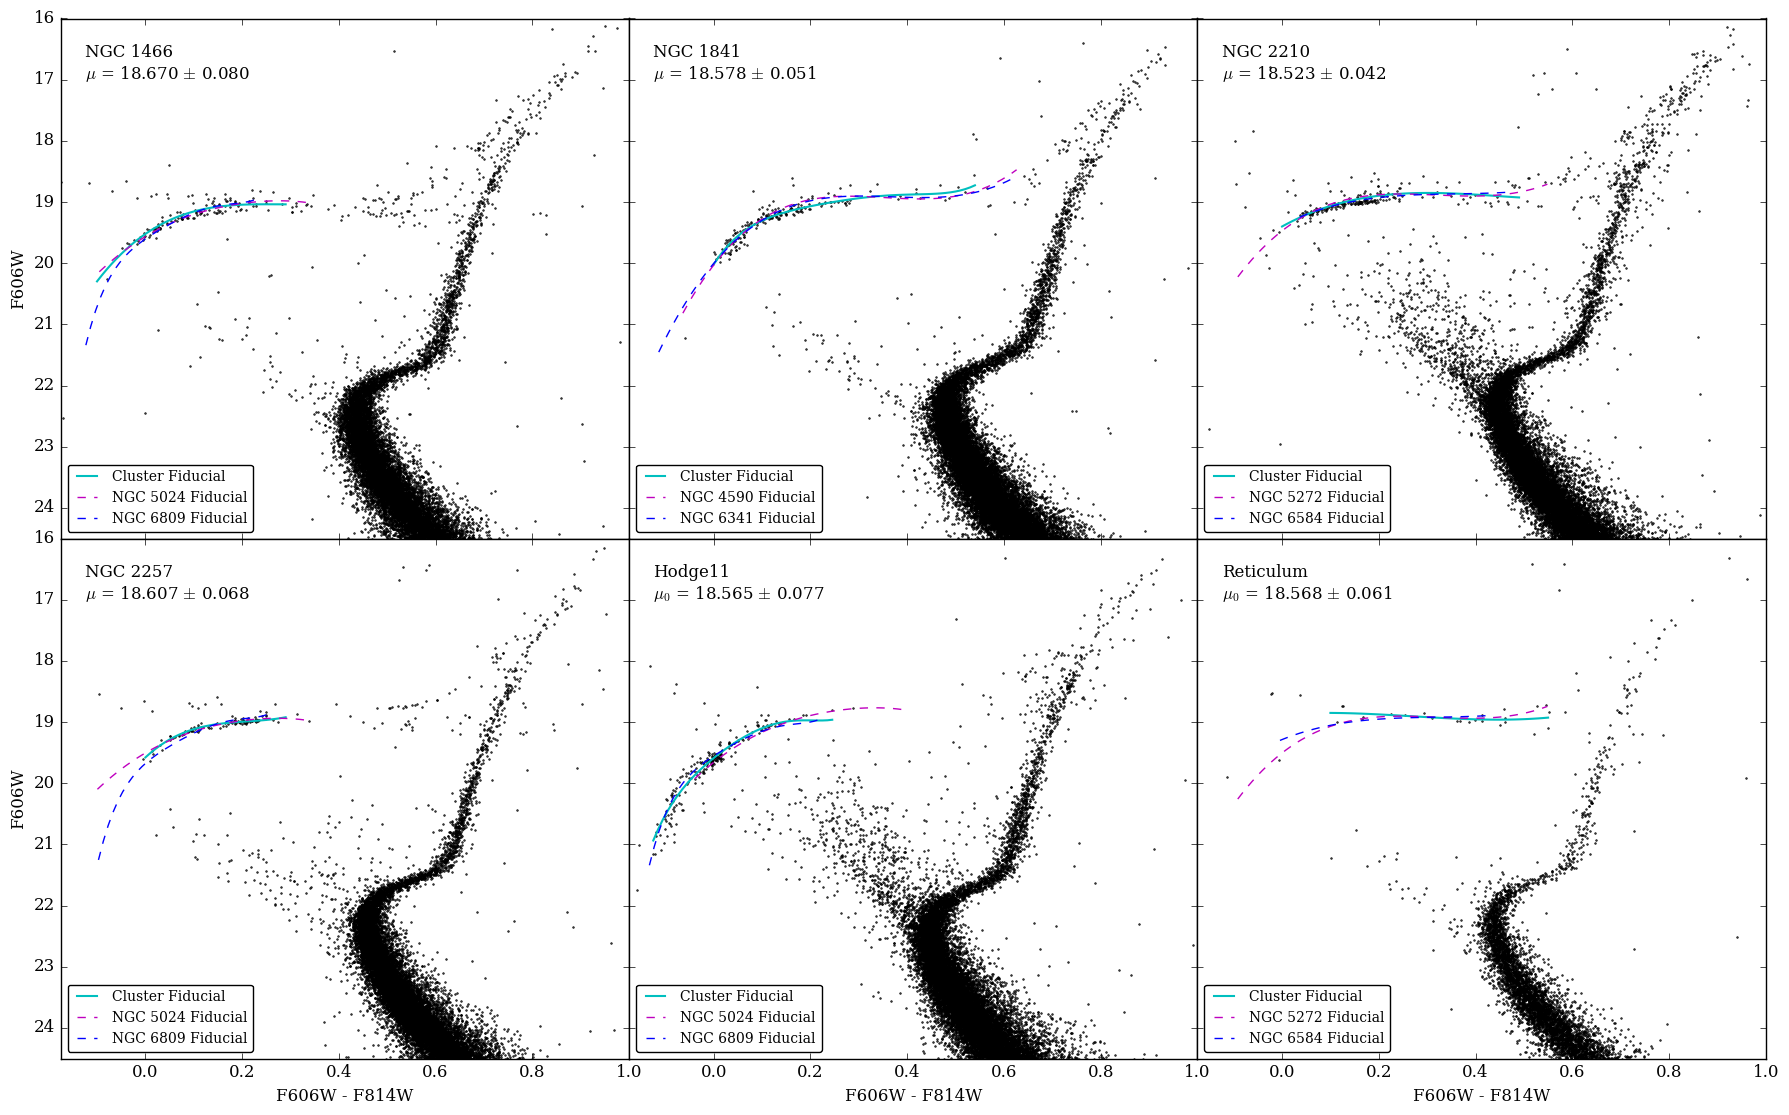
With the derived HB fiducials, the fiducials from the GGC reference clusters are shifted to match those of the LMC clusters in a least-squares fashion. The resulting shift in magnitude from this fit, in conjunction with the assumed GGC distances from Table LABEL:tab:GGCref, determines the distance for each LMC cluster. Each LMC cluster has its distance derived with respect to two reference GGC cluster fiducials, as indicated in the fourth column of Table LABEL:tab:zahb_dists. The final column of this table provides the average of those two distances.
The cited uncertainties on the derived distances in Table LABEL:tab:zahb_dists incorporate the scatter (standard deviation in magnitude) and number of stars used to derive each LMC fiducial, the scatter and number of stars for the GGC fiducials, and the errors from the least-squares fitting between the GGC and LMC fiducials.
[b] Cluster [Fe/H]CG97 a Assumed E(B–V)b E(B–V)c Reference HBs NGC 1466 -1.70 0.09 0.07 NGC 5024, NGC6809 18.67 0.08 NGC 1841 -2.02 0.18 0.19 NGC 4590, NGC6341 18.58 0.05 NGC 2210 -1.45 0.06 0.08 NGC 5272, NGC6584 18.52 0.04 NGC 2257 -1.71 0.04 0.06 NGC 5024, NGC6809 18.61 0.07 Hodge 11 -1.76 0.08 0.08 NGC 5024, NGC6809 18.57 0.08 Reticulum -1.57 0.03 0.02 NGC 5272, NGC6584 18.57 0.06
4.2 Subdwarf Analysis
As the most well-understood phase of stellar evolution, fitting of main-sequence stars offers an opportunity to provide excellent distance measurements. Using parallaxes and highly precise HST photometry of local subdwarfs from GO-11704 (Chaboyer et al. 2017), we leverage the accurately measured subdwarf absolute magnitudes and the clean main sequences of the six LMC clusters to determine distances. Details of the four subdwarfs in the metallicity range of the LMC clusters are presented in Table LABEL:tab:subdwarf_details. The magnitudes and colors of these stars are adjusted for their individual reddening, noted in Column 5.
In order to compare the observed main sequences of the LMC clusters to the photometry for the local subwarfs, it is necessary to adjust the colors of the latter to account for the various metallicities of the clusters and the subdwarfs. First, the metallicities of the individual stars are adjusted for their unique [/Fe] abundances using the following relation from Salaris, Chieffi & Straniero (1993) and Dotter et al. (2010).
| (1) |
A grid of DSED isochrones for the HST/ACS filters over a metallicity range of -2.5 to -0.5 and an absolute magnitude range of 4.5 MF606W 7 is used. In this grid, we interpolate based on the metallicity of each star to determine the change in color necessary to correct the F606WF814W color of the subdwarf to the reference metallicity of each of the clusters. The reference metallicity of each LMC cluster is also corrected as in Equation 1 for an assumed -enhancement of [/Fe] = 0.2.
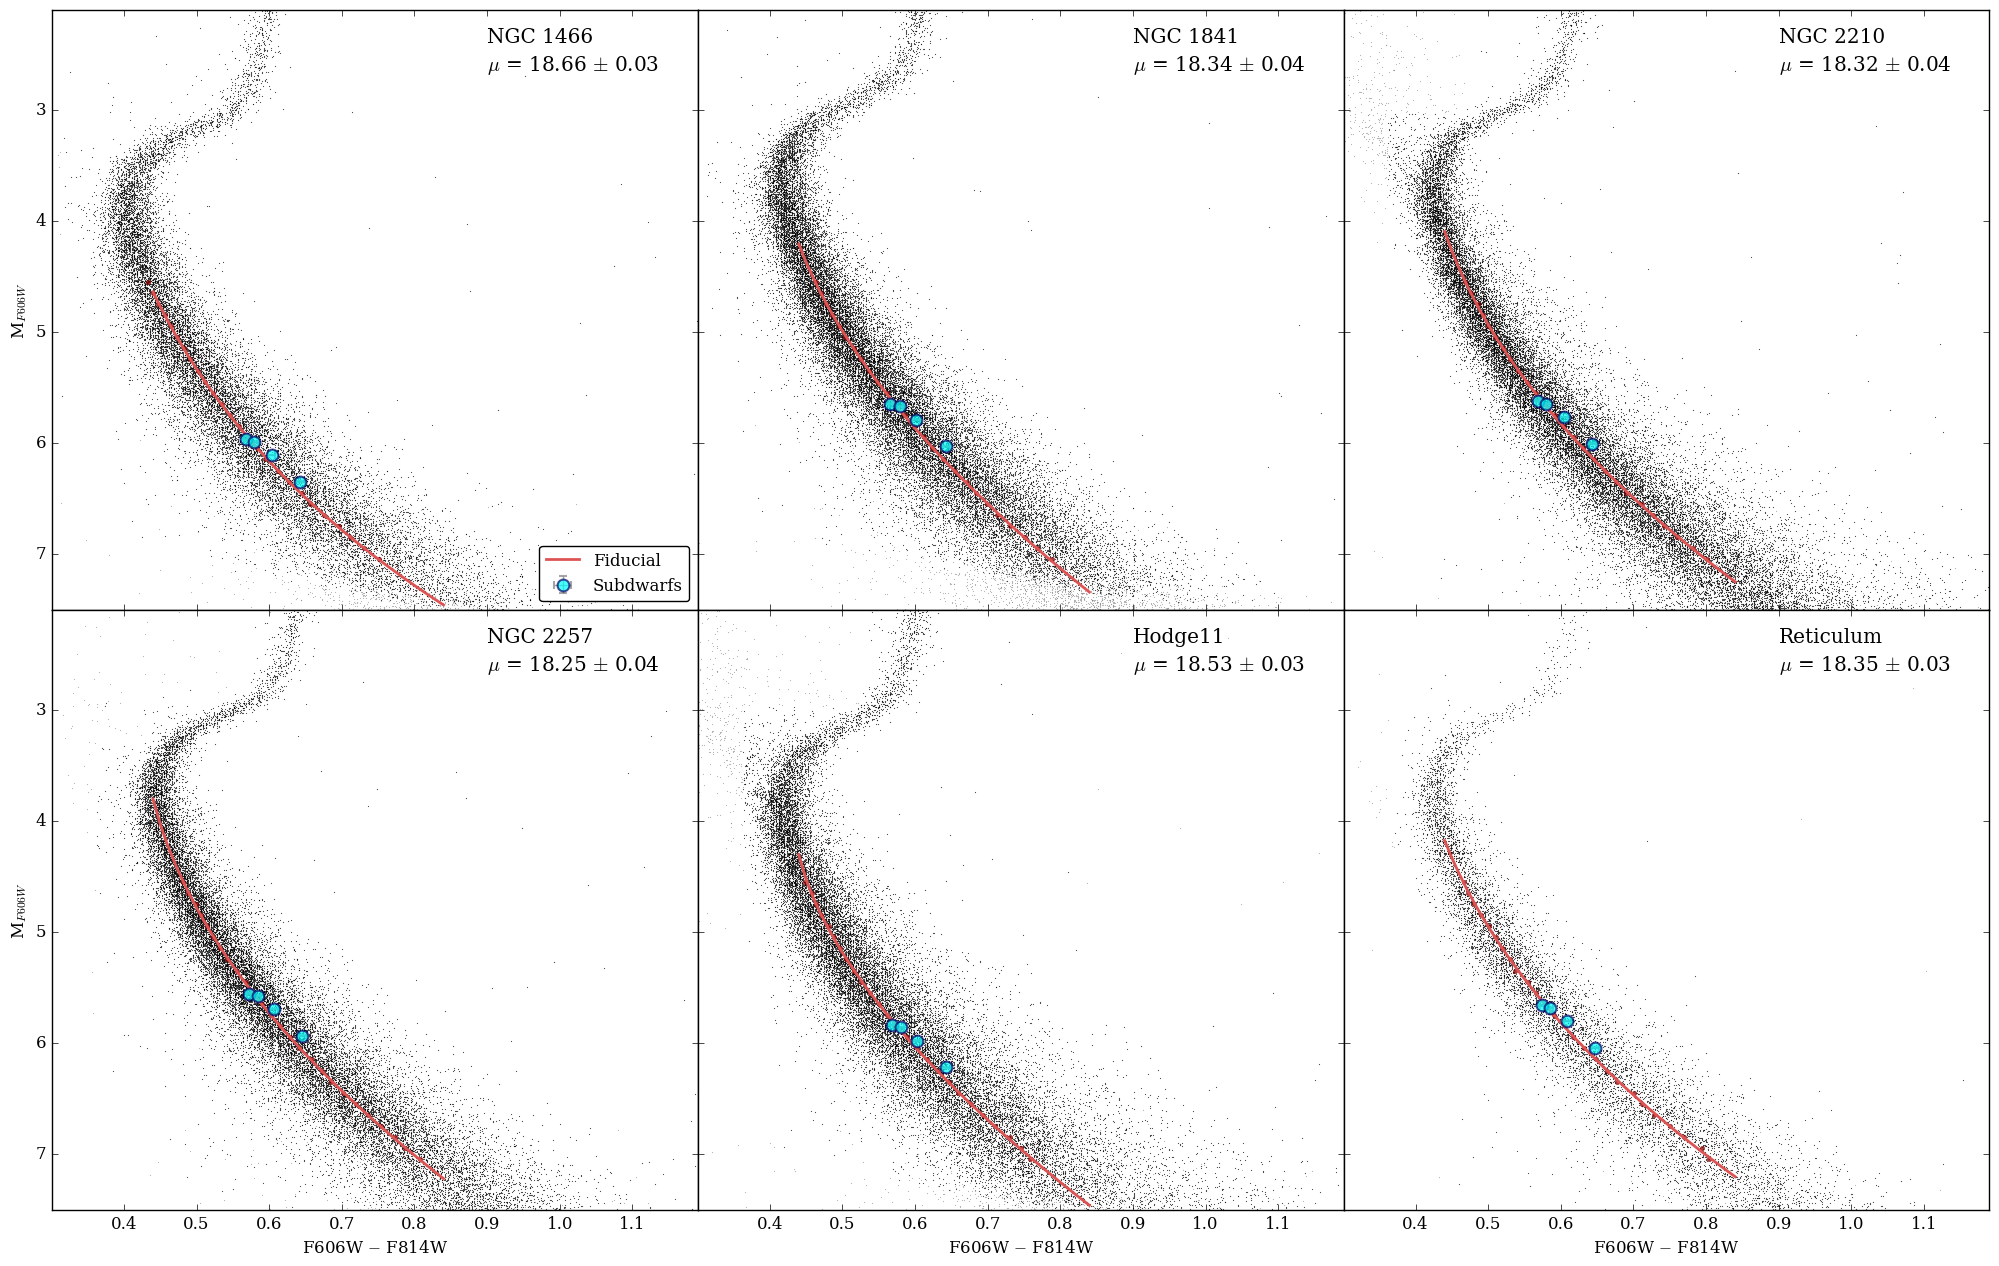
Assuming a reddening for each LMC cluster (Walker 1992a, 1993, see Table LABEL:tab:subdwarfs_res), a main sequence fiducial is fit with a power law for cluster stars between an absolute F606W magnitude of 4.5 and 7 in overlapping magnitude bins of 0.1 mag. The fiducials are shown in the panels of Figure 8 as red curves for each cluster. The fiducial is shifted via least squares to minimize the offsets of the HST parallax stars from the fiducial line in magnitude. The resulting distance moduli are given in the final column of Table LABEL:tab:subdwarfs_res, with the quoted error representing the uncertainty in the fiducial fit.
We find an average distance modulus to the LMC of 18.40 0.04 (47.94 0.32 kpc). This is shorter than the mean distance we determined from the HB analysis in section 4.1 of 18.59 0.06 . The two estimates are within 3- but discrepant. This is likely due to different underlying assumptions, as discussed further at the end of this section. From the HB and subdwarf distances, we derive an average distance to the LMC of 18.52 0.05(50.51 1.19 kpc).
| ID | (mas) | F606W | F814W | E(B-V) | [Fe/H] | [/Fe] |
|---|---|---|---|---|---|---|
| HIP46120 | 14.49 0.16 | 9.938 0.0015 | 9.371 0.0017 | 0.00 | -2.24 | 0.29 |
| HIP103269 | 14.12 0.10 | 10.084 0.0034 | 9.503 0.0027 | 0.00 | -1.85 | 0.06 |
| HIP106924 | 14.48 0.12 | 10.156 0.0024 | 9.555 0.0048 | 0.00 | -2.22 | 0.23 |
| HIP108200 | 12.39 0.08 | 10.785 0.0031 | 10.143 0.0055 | 0.02 | -1.83 | 0.01 |
[b] Cluster Assumed Values Name E(B-V)a [Fe/H]b D (kpc) D0 (kpc) NGC 1466 0.09 -1.7 18.66 0.03 53.94 0.80 18.40 0.06 47.90 1.29 NGC 1841 0.18 -2.02 18.34 0.04 46.61 0.86 17.85 0.11 37.10 1.89 NGC 2210 0.06 -1.45 18.32 0.04 46.05 0.80 18.34 0.02 46.58 0.38 NGC 2257 0.04 -1.71 18.25 0.04 44.60 0.82 18.39 0.04 47.59 0.86 Hodge 11 0.08 -1.76 18.53 0.03 50.83 0.81 18.54 0.02 51.02 0.43 Reticulum 0.03 -1.57 18.35 0.03 46.84 0.68 18.42 0.04 48.35 0.97
Radial velocity measurements suggest that even the oldest clusters in the LMC lie in the disk (Schommer et al. 1992; Grocholski et al. 2006, 2007). Due to the inclination of the LMC on the sky, a simple average of cluster distances assumes a random distribution and could result in a biased distance estimate. However, if we assume the LMC clusters lie in a disk, geometric variations may be accounted for. The locations of the clusters on the sky are used to correct the individual distances for the inclination of the disk, thereby obtaining a more accurate absolute distance for the LMC. By doing so, we obtain an estimate to the distance to the center of the LMC that is more accurate by accounting for the geometry of the galaxy.
This process is outlined in van der Marel & Cioni (2001) and Grocholski et al. (2007), and also presented in the equations 2 through 5 below. The distance to the LMC center is denoted D0. D is the distance to any location on the disk plane; for our case, this is the distance to each cluster. We assume the LMC disk to be inclined to the plane of the sky by the angle i around an axis at position angle . is measured counterclockwise from the west; to align with usual astronomical convention, is defined the position angle from the north ( = - 90). These values are adopted from van der Marel & Cioni (2001); we note that Grocholski et al. (2007) explored a variety of geometries from other past work, finding differences in the resulting distance of 0.2 kpc for varying i and . The right ascension and declination are referred to respectively by and in the equations below.
| (2) |
To calculate the distance to the LMC center (D0 above), it is necessary to calculate and . The former is calculated as in equation 3, below:
| (3) |
Via a typical trigonometric expansion, may be determined as = - . These components are detailed in equations 4 and 5:
| (4) |
| (5) |
Through these equations, we determine an average, error-weighted distance modulus to the LMC center of D0 18.20 0.06, equivalent to 46.42 0.45 kpc. However, NGC 1841 is a clear outlier in these data, lying more than 3- from the mean D0 distance to the LMC center, leading to several possibilities. One interpretation of these results suggests that NGC 1841 may not be a member of the LMC disk or may have been pulled out of the LMC disk (Grocholski et al. 2007). Another view is that an uncertain estimate of the reddening could be affecting the distance measurement; if the reddening of NGC 1841 is doubled from E(B–V) = 0.18, it is brought into agreement with the LMC mean distance. Regardless of the reason(s) for the discrepancy, we remove NGC 1841 as an anomaly and continue determining the distance to the LMC center.
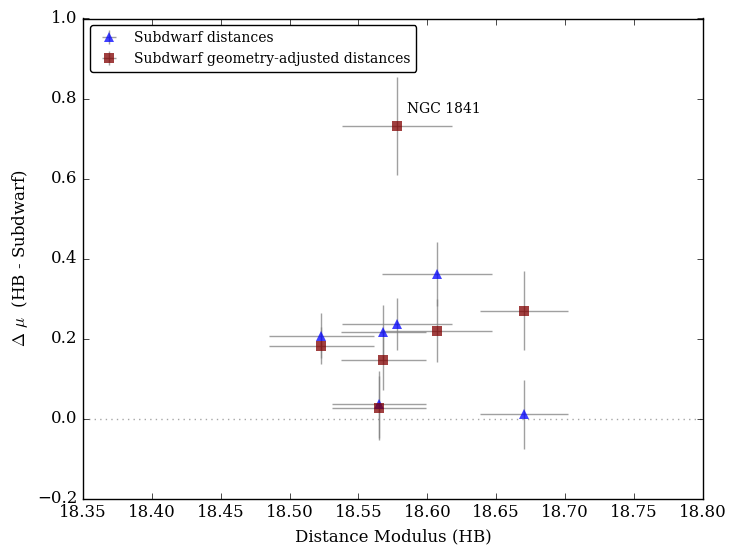
Leaving out the extreme outlier of NGC 1841, the error-weighted mean is 18.41 0.04 (48.29 0.38 kpc). This is within the range of the result from Section 4.1 from the HB analysis, as seen in Figure 9, where the subdwarf distances and the subdwarf distances adjusted for the LMC geometry are compared to those derived from the HB analysis. The subdwarf distances tend to be shorter by 0.14 mag on average than those of the HB analysis; the adjusted subdwarf distances are also shorter than the HB distances by 0.12 (leaving NGC 1841 out). The offset appears to be consistent regardless of the individual cluster. The systematic bias between the derived distances could be due to the combination of necessary assumptions in the two approaches (e.g.: metallicity, reddening, GGC distances) or the zeropoints. The HB distance calibration relies on the assumed metallicity-magnitude scale from Harris (2010), which is more likely to result in a systematic offset relative to the more fundamentally derived subdwarf distances. Regardless, the overall distance estimates of the LMC cluster system from the two methods are in reasonable (though not excellent) agreement.
Our estimated distance D0 to the center of the LMC is also comparable to, though marginally shorter than, recent determinations of the LMC distance of 18.49 0.09 (de Grijs, Wicker & Bono 2014 and references therein) and 18.493 mag 0.008(statistical) 0.047 (systematic) (Pietrzyński et al. 2013). Our result is comparable to the values of 18.40 0.04 and 47.9 0.9 kpc, derived from Grocholski et al. (2007) via red clump distances from K-band observations for 25 clusters in the LMC, also taking into account the geometry of the LMC disk. The two studies agree despite differences from our sample being smaller and our focus on the old globular clusters. The true distance modulus derived from Johnson et al. (1999) of 18.46 0.09 from three LMC clusters is also comparable to our derived 18.41 0.04 (48.29 0.38 kpc). In all cases, the results are consistent within the uncertainties.
5 Conclusions
In this paper, we have used new deep homogeneous photometry for six ancient globular clusters in the Large Magellanic Cloud to measure the epoch of metal-poor globular cluster formation relative to that in the Milky Way, and calculate a new distance estimate to the LMC. Our main results are:
(i) By utilising the same methodology as employed by MF09, we have calculated reddening and distance independent relative ages for our six targets with a mean precision of 8.4%, and down to 6% for individual clusters. The LMC sample is coeval with the metal-poor inner halo Galactic GCs measured by MF09 to within 0.2 0.4 (1.0 Gyr stddev). This is despite the fact that the LMC was most likely widely separated from the Milky Way at this time, and despite the significantly different formation environments implied by the different halo masses of the LMC and Milky Way.
(ii) Through HB magnitude and sub-dwarf fitting methods, we have determined two distance estimates to the LMC. These are 18.59 0.06 and 18.40 0.04 , respectively. There is a systematic mean difference between the individual cluster distance determinations of 0.14 mag; this could be due to differences in the underlying assumptions for the two different methodologies (for example, the assumed distances of the reference GGCs in the HB analysis vs the assumed metallicities of the LMC clusters during the subdwarf analysis). The average distance from the two methods is 18.52 0.05(50.51 1.19 kpc), which is comparable to the distance modulus derived recently by de Grijs et al. 2014.
(iii) To counter the possibility that our distance estimate could be biased if the target clusters are members of the LMC disk, we calculate a geometrically corrected sub-dwarf distance to the LMC of 18.41 0.04 (48.29 0.38 kpc), where the measurement for NGC 1841 has been excluded as an outlier.
Acknowledgments
We thank an anonymous referee whose comments and suggestions were very helpful. D.M. is grateful for support from an Australian Research Council Future Fellowship (FT160100206). D.G. gratefully acknowledges support from the Chilean BASAL Centro de Excelencia en Astrofísica y Tecnologías Afines (CATA) grant PFB-06/2007.
References
- Anderson & Bedin (2010) Anderson J., Bedin L. R., 2010, PASP, 122, 1035
- Bedin et al. (2004) Bedin L. R., Piotto G., Anderson J., Cassisi S., King I. R., Momany Y., Carraro G., 2004, ApJL, 605, L125
- Besla et al. (2007) Besla G., Kallivayalil N., Hernquist L., Robertson B., Cox T. J., van der Marel R. P., Alcock C., 2007, ApJ, 668, 949
- Brocato et al. (1996) Brocato E., Castellani V., Ferraro F. R., Piersimoni A. M., Testa V., 1996, MNRAS, 282, 614
- Cardelli, Clayton & Mathis (1989) Cardelli J. A., Clayton G. C., Mathis J. S., 1989, ApJ, 345, 245
- Carretta et al. (2009) Carretta E., Bragaglia A., Gratton R., D’Orazi V., Lucatello S., 2009, A&A, 508, 695
- Carretta & Gratton (1997) Carretta E., Gratton R. G., 1997, A&AS, 121
- Chaboyer et al. (2017) Chaboyer B. et al., 2017, ApJ, 835, 152
- Dalessandro et al. (2016) Dalessandro E., Lapenna E., Mucciarelli A., Origlia L., Ferraro F. R., Lanzoni B., 2016, ApJ, 829, 77
- de Grijs, Wicker & Bono (2014) de Grijs R., Wicker J. E., Bono G., 2014, AJ, 147, 122
- Dolphin (2000) Dolphin A. E., 2000, PASP, 112, 1383
- Dolphin et al. (2001) Dolphin A. E., Walker A. R., Hodge P. W., Mateo M., Olszewski E. W., Schommer R. A., Suntzeff N. B., 2001, ApJ, 562, 303
- Dotter et al. (2008) Dotter A., Chaboyer B., Jevremović D., Kostov V., Baron E., Ferguson J. W., 2008, ApJS, 178, 89
- Dotter et al. (2010) Dotter A. et al., 2010, ApJ, 708, 698
- Glatt et al. (2008) Glatt K. et al., 2008, AJ, 135, 1106
- Gratton, Carretta & Bragaglia (2012) Gratton R. G., Carretta E., Bragaglia A., 2012, A&A Rev., 20, 50
- Grocholski et al. (2006) Grocholski A. J., Cole A. A., Sarajedini A., Geisler D., Smith V. V., 2006, AJ, 132, 1630
- Grocholski et al. (2007) Grocholski A. J., Sarajedini A., Olsen K. A. G., Tiede G. P., Mancone C. L., 2007, AJ, 134, 680
- Harris (2010) Harris W. E., 2010, ArXiv e-prints, 1012.3224
- Harris et al. (1997) Harris W. E. et al., 1997, AJ, 114, 1030
- Jeon et al. (2014) Jeon Y.-B., Nemec J. M., Walker A. R., Kunder A. M., 2014, AJ, 147, 155
- Johnson et al. (1999) Johnson J. A., Bolte M., Stetson P. B., Hesser J. E., Somerville R. S., 1999, ApJ, 527, 199
- Kallivayalil, van der Marel & Alcock (2006) Kallivayalil N., van der Marel R. P., Alcock C., 2006, ApJ, 652, 1213
- Kallivayalil et al. (2013) Kallivayalil N., van der Marel R. P., Besla G., Anderson J., Alcock C., 2013, ApJ, 764, 161
- Mackey & Gilmore (2004a) Mackey A. D., Gilmore G. F., 2004a, MNRAS, 355, 504
- Mackey & Gilmore (2004b) Mackey A. D., Gilmore G. F., 2004b, MNRAS, 352, 153
- Mackey, Payne & Gilmore (2006) Mackey A. D., Payne M. J., Gilmore G. F., 2006, MNRAS, 369, 921
- Mackey et al. (2017) Mackey D., Sarajedini A., Wagner-Kaiser R., Grocholski A. J., 2017, ApJ
- Marín-Franch et al. (2009) Marín-Franch A. et al., 2009, ApJ, 694, 1498
- Mateluna et al. (2012) Mateluna R., Geisler D., Villanova S., Carraro G., Grocholski A., Sarajedini A., Cole A., Smith V., 2012, A&A, 548, A82
- Mighell, Sarajedini & French (1998) Mighell K. J., Sarajedini A., French R. S., 1998, AJ, 116, 2395
- Milone et al. (2012) Milone A. P. et al., 2012, A&A, 540, A16
- Milone et al. (2009) Milone A. P., Stetson P. B., Piotto G., Bedin L. R., Anderson J., Cassisi S., Salaris M., 2009, A&A, 503, 755
- Mucciarelli, Origlia & Ferraro (2010) Mucciarelli A., Origlia L., Ferraro F. R., 2010, ApJ, 717, 277
- Niederhofer et al. (2017a) Niederhofer F. et al., 2017a, MNRAS, 465, 4159
- Niederhofer et al. (2017b) Niederhofer F. et al., 2017b, MNRAS, 464, 94
- Olsen et al. (1998) Olsen K. A. G., Hodge P. W., Mateo M., Olszewski E. W., Schommer R. A., Suntzeff N. B., Walker A. R., 1998, MNRAS, 300, 665
- O’Malley, Gilligan & Chaboyer (2017) O’Malley E. M., Gilligan C., Chaboyer B., 2017, ArXiv e-prints
- Paust et al. (2010) Paust N. E. Q. et al., 2010, AJ, 139, 476
- Piatti et al. (2009) Piatti A. E., Geisler D., Sarajedini A., Gallart C., 2009, A&A, 501, 585
- Pietrzyński et al. (2013) Pietrzyński G. et al., 2013, Nature, 495, 76
- Piotto et al. (2015) Piotto G. et al., 2015, AJ, 149, 91
- Salaris, Chieffi & Straniero (1993) Salaris M., Chieffi A., Straniero O., 1993, ApJ, 414, 580
- Sarajedini et al. (2007) Sarajedini A. et al., 2007, AJ, 133, 1658
- Sbordone et al. (2011) Sbordone L., Salaris M., Weiss A., Cassisi S., 2011, A&A, 534, A9
- Schlafly & Finkbeiner (2011) Schlafly E. F., Finkbeiner D. P., 2011, ApJ, 737, 103
- Schlegel, Finkbeiner & Davis (1998) Schlegel D. J., Finkbeiner D. P., Davis M., 1998, ApJ, 500, 525
- Schommer et al. (1992) Schommer R. A., Suntzeff N. B., Olszewski E. W., Harris H. C., 1992, AJ, 103, 447
- Sirianni et al. (2005) Sirianni M. et al., 2005, PASP, 117, 1049
- van der Marel & Cioni (2001) van der Marel R. P., Cioni M.-R. L., 2001, AJ, 122, 1807
- VandenBerg et al. (2013) VandenBerg D. A., Brogaard K., Leaman R., Casagrande L., 2013, ApJ, 775, 134
- Wagner-Kaiser et al. (2017) Wagner-Kaiser R. et al., 2017, MNRAS, 468, 1038
- Walker (1992a) Walker A. R., 1992a, ApJL, 390, L81
- Walker (1992b) Walker A. R., 1992b, AJ, 104, 1395
- Walker (1993) Walker A. R., 1993, AJ, 106, 999